
 ?Mathematical formulae have been encoded as MathML and are displayed in this HTML version using MathJax in order to improve their display. Uncheck the box to turn MathJax off. This feature requires Javascript. Click on a formula to zoom.
ABSTRACT
Based on their mechanism of action, two types of anti-CD20 antibodies are distinguished: Type I, which efficiently mediate complement-dependent cytotoxicity, and Type II, which instead are more efficient in inducing direct cell death. Several molecular characteristics of these antibodies have been suggested to underlie these different biological functions, one of these being the manner of binding to CD20 expressed on malignant B cells. However, the exact binding model on cells is unclear. In this study, the binding mechanism of the Type I therapeutic antibodies rituximab (RTX) and ofatumumab (OFA) and the Type II antibody obinutuzumab (OBI) were established by real-time interaction analysis on live cells. It was found that the degree of bivalent stabilization differed for the antibodies: OFA was stabilized the most, followed by RTX and then OBI, which had the least amount of bivalent stabilization. Bivalency inversely correlated with binding dynamics for the antibodies, with OBI displaying the most dynamic binding pattern, followed by RTX and OFA. For RTX and OBI, bivalency and binding dynamics were concentration dependent; at higher concentrations the interactions were more dynamic, whereas the percentage of antibodies that bound bivalent was less, resulting in concentration-dependent apparent affinities. This was barely noticeable for OFA, as almost all molecules bound bivalently at the tested concentrations. We conclude that the degree of bivalent binding positively correlates with the complement recruiting capacity of the investigated CD20 antibodies.
Introduction
Over three decades ago, CD20 was identified as a specific B-cell marker and rapidly became the first target within oncology/hematology for antibody-mediated immunotherapy.Citation1 To date, three unconjugated antibodies recognizing a CD20 epitope are approved by both FDA and EMA for treatment of a variety of B-cell leukemias and lymphomas: rituximab (RTX), ofatumumab (OFA) and obinutuzumab (OBI).Citation2 Monoclonal antibodies (mAbs) can induce direct cell death,Citation3,Citation4 as well as several Fc-dependent immune-mediated mechanisms, such as antibody-dependent cell-mediated cytotoxicity (ADCC),Citation5 complement-dependent cytotoxicity (CDC)Citation6 and antibody-dependent cellular phagocytosis (ADCP).Citation7 Based on their primary mode of action, the anti-CD20 mAbs have been divided into two groups: the Type I molecules RTX and OFA are efficient in activating the complement system, whereas OBI is a Type II molecule, which can induce direct cell death but lacks effective CDC.Citation8 Type I antibodies typically cluster CD20 on the cell surface into specific microdomains termed lipid rafts, and it has been described that this correlates with the ability to efficiently induce CDC.Citation9 This is presumably because the first component of the classical complement pathway, C1q, binds preferably to hexameric arrangements of Fc-tails, whose formation is facilitated by clustering of the antibodies.Citation10
However, not all anti-CD20 mAbs strictly adhere to the Type I/II classification, and antibodies displaying both Type I and II characteristics have been described.Citation11–Citation14 Moreover, the underlying molecular properties governing the functional classification into Type I vs. II antibodies are not fully understood. Molecular features that have been correlated with the mode of action are: 1) the recognized epitope on CD20;Citation15 2) binding orientationCitation16 and kinetics;Citation17 and 3) the elbow angle of the antibody.Citation16,Citation18 As a relevant binding parameter, the off-rate has been suggested to be related to how efficiently antibodies induce CDC.Citation17 However, in a follow-up study this was found not to be the only parameter,Citation15 and an independent study concluded that neither the binding epitope nor the off-rate could explain functional differences, but instead found some indications for the elbow angle to be of importance.Citation11
Understanding how molecular properties relate to biological function is valuable for the design of antibodies with improved effector function. For example, understanding how glycosylation of the Fc region contributes to its interaction with Fcγ-receptors (FcγR) that mediate ADCC resulted in OBI being developed with a glycoengineered Fc that has an increased affinity for the activating FcγRIII on natural killer cells, and thus induces ADCC more efficiently.Citation18,Citation19 Even though antibody binding has been discussed as a potential factor influencing functional aspects, the exact binding mechanism for CD20 antibodies has not been described in a cellular context, and thus the basis for relating antibody binding characteristics to a functional outcome is not well established.
In previous studies, we found that RTX is characterized by a heterogeneous binding pattern on live cells,Citation20 which was also found to be true for other anti-CD20 mAbs.Citation11 This implies that binding is more complex than what can be described with a traditional 1:1 interaction model, which assumes that all binding events can be fully described by a single association and dissociation rate constant. A method designed for interaction analysis of proteins with cell-surface receptors is LigandTracer, which follows the binding of labeled proteins to live cells over time. In this study, LigandTracer was used to perform a detailed analysis of the binding kinetics of RTX, OBI and OFA in order to establish their binding mechanisms to CD20 expressed on the cell surface.
Results
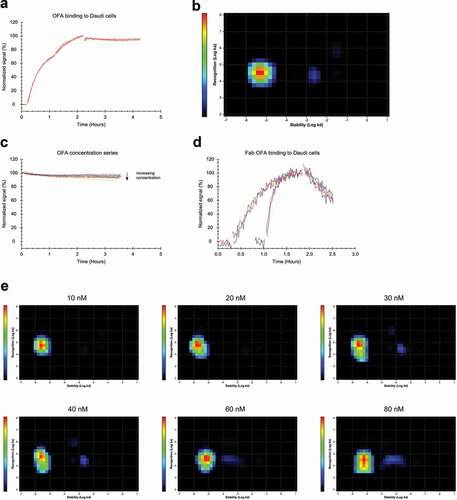
Cell-based real-time interaction analysis of RTX was performed on Daudi cells known to express 130,000–210,000 CD20 molecules per cell.Citation21,,Citation22,Citation23 As noted in a previous studyCitation20 the RTX-CD20 interaction on these cells deviated from a 1:1 binding model (). In particular, the stability of bound RTX could not be described by a single dissociation rate constant (kd). The data were further analyzed by Interaction Map, which searches for individual 1:1 interactions taking place in a 2-dimensional association-dissociation rate constant space, to describe the measured data. This type of analysis revealed two distinct interactions () that had similar association rate constants (ka) of 1.3*104 M−1 s−1, but dissociation rate constants that differed by almost 100-fold (9.6*10−6 s−1 vs. 7.9*10−4 s−1), resulting in apparent affinities of 0.8 nM for the strong interaction and 46 nM for the weak interaction (). The highly similar ka-values imply that the molecular recognition between ligand and target was almost identical for the two interactions, and thus likely represent binding to the same target. However, the two interactions differed in their binding stability, which reveals that a portion of RTX molecules might be stabilized on the cell surface by secondary binding events such as bivalency or Fc-Fc interactions. As represented by the intensities of the interaction peaks, the stronger, more stable interaction contributed more to the overall binding process than the weak interaction.
Table 1. Kinetics for RTX, OBI and OFA binding traces from , and according to Interaction Map analysis.
Figure 1. (a) FITC-labeled RTX binding to Daudi cells with two increasing concentrations of 20 and 60 nM during the association phase, dissociation was measured in plain medium. (red, n = 4) Data was fitted to a 1:1 binding model (black). (b) Interaction Map analysis for RTX binding to Daudi cells, input data from all four binding curves in (a) was used for the calculation. The analysis results in two defined interaction components that mainly differ in their binding stability (x-axis). The more stable component is dominating with the tested RTX concentrations, indicated by warmer colors in the plot. (c) Daudi cells were incubated with 9 nM FITC-labeled RTX and binding recorded (black). After 10, 30, 60 and 90 min, 9 nM of RTX labeled with a quencher was added to the incubation solution (red). Gaps in the binding curves indicate the time point when the incubation solution was changed to cell culture medium not containing any RTX. All displayed curves were normalized in signal height by setting the baseline to 0% and the signal at the timpoint of the first quencher addition (10 min) to 100%. Target occupancy was calculated using the Bmax value obtained from fitting a 1:1 model to the black curve, containing only 9 nM FITC-RTX.
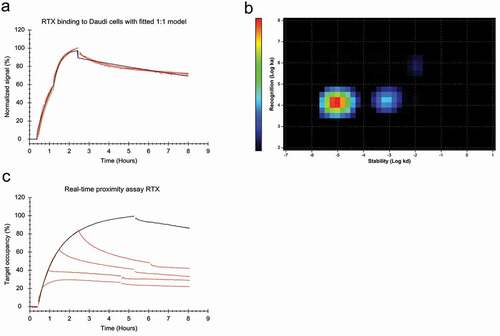
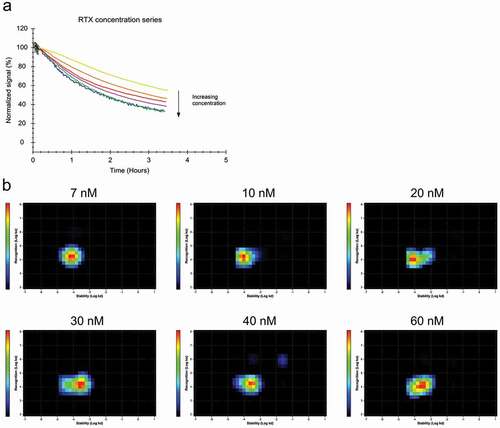
Both bivalent binding and Fc-Fc interactions between antibodies are dependent on binding epitopes being present in close proximity on the cell surface. Therefore, the RTX-CD20 interaction was evaluated with a real-time proximity assayCitation24 to study the clustering of cell surface-bound RTX. Addition of quencher-labeled RTX to cells that were already incubated with fluorescein isothiocyanate (FITC)-labeled RTX for various times resulted in a more pronounced signal decrease () than addition of unlabeled RTX (data not shown). This result confirms that RTX molecules bind in close proximity to each other on the cell surface. Addition of quencher-labeled RTX when 80% of CD20 is already bound by FITC-RTX resulted in a much larger signal decrease than what would be expected given the high target occupancy and slow apparent off-rate of the antibody. It was also noted that RTX displayed a slower and more homogenous apparent off-rate at 9 nM than at 60 nM (see compared to ). Due to these observations, we investigated whether the apparent off-rate, as measured upon removal of RTX, was an accurate representation of the stability of bound RTX. The 1:1 model assumes that, at a certain ligand concentration, association is proportional to the association rate constant ka and the number of unbound receptors, while dissociation is proportional to the number of bound receptors. While both association and dissociation take place during incubation with a ligand, a real-time interaction analysis experiment typically measures the dissociation in absence of ligand as most interaction models, including the 1:1 model, assume that a dissociation event is not affected by ligands in solution. As results indicated that this assumption is not valid for RTX, the interaction was characterized in regards to affinity and dynamics while keeping the antibody concentration constant during the whole experiment. For this purpose, labeled antibody was replaced with equimolar concentration of unlabeled antibody during the dissociation phase (). The presence of free RTX in solution increased the apparent dissociation rate for bound RTX, an effect that became more pronounced at higher concentrations (). Interaction Map analysis showed that the interaction is homogenous at 7 nM, with a kd value centered around 7.8*10−5 s−1 () at 10 nM, the interaction tailed out in the x-axis direction to the right, indicating that a minority of molecules is less stably bound. This tail became more pronounced at 20 nM, implying that a bigger fraction of RTX is bound in the less stable state, and at 30 nM the peak of the interaction shifted, implying that the majority of antibodies are bound less stable. At 40 nM and 60 nM, the interaction became established around a kd of 2.3*10−4 s−1, which is threefold faster than for 7 nM. As the off-rate is directly related to the affinity, the increasing kd value means that the apparent affinity for RTX is decreasing with increasing antibody concentrations from 4.5 nM to 20 nM in a concentration range from 7 to 60 nM ().
Table 2. Affinity values according to IM analysis for RTX, OBI and OFA at highest and lowest tested concentration in the presence of equimolar amount of unlabeled antibody during the dissociation.
Figure 2. (a) Daudi cells were incubated with FITC-RTX in the concentration range from 7 to 60 nM until binding levels are close to equilibrium followed by replacement with the same concentration of unlabeled RTX to observe the release of bound FITC-RTX. (b) Interaction Map analysis for the binding traces displayed in (a). With increasing concentrations, the interaction shifts to the right on the x-axis, indicating that RTX binding becomes less stable with increasing concentrations.
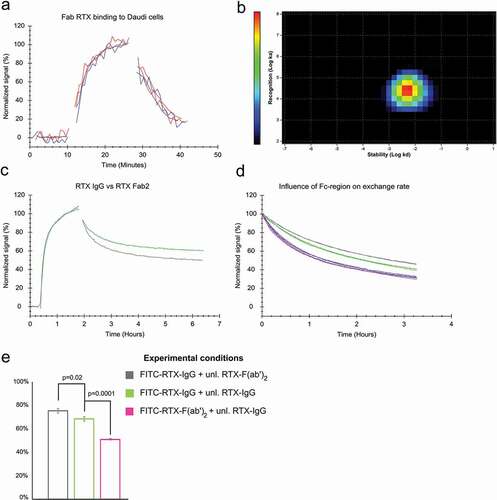
Replacement during the dissociation phase and concentration-dependent affinities indicate that the RTX-CD20 interaction is affected by secondary binding events such as bivalent binding or Fc-Fc interactions. To establish the contributing factors, the binding of the RTX antigen-binding fragment (Fab) and RTX-F(ab’)2 was evaluated. In the absence of free ligand in solution, the Fab displayed a much faster off-rate than IgG RTX (). For RTX-F(ab’)2, the apparent dissociation was also faster than for IgG RTX, although the difference was clearly less pronounced than for RTX-Fab (). The dissociation rate of RTX-Fab was constant and unaffected by either the presence of unlabeled RTX-Fab in solution or the concentration used during incubation, which is assumed for a 1:1 interaction (). The 1:1 behavior for RTX-Fab binding was confirmed by obtaining a good agreement between the experimental data and the curve obtained from fitting the 1:1 binding model. The resulting rate constants amounted to a ka of 4.7*104 M−1 s−1 and a kd of 2.2*10−3 s−1, and thus in an affinity of 46 nM (), i.e., the same value as obtained for the weak interaction for full-length RTX in the absence of unbound antibody in solution. The 1:1 behavior was also confirmed by Interaction Map analysis that resulted in one defined interaction peak for RTX-Fab binding to Daudi cells (), further supporting the absence of secondary binding events for RTX-Fab.
Table 3. Kinetics for Fab fragments of RTX, OBI and OFA extracted with a 1:1 binding model.
Figure 3. (a) Binding of 10 nM and 60 nM FITC-labeled RTX-Fab to Daudi cells in the presence (red) and absence (blue) of 10 nM and 60 nM unlabeled RTX-Fab during dissociation, respectively. (b) Interaction Map analysis for 60 nM FITC-RTX-Fab binding to Daudi cells (c) Binding of 60 nM full-length RTX (green) and RTX-Fab2 (gray) to Daudi cells. Dissociation was recorded in plain cell culture medium for both. (d) The binding stability in the presence of ligand in solution was tested for the following association + dissociation combinations: FITC-RTX-IgG + unlabeled RTX-F(ab’)2 (gray), FITC-RTX-IgG + unlabeled RTX-IgG (green), FITC-RTX-F(ab’)2 + unlabeled RTX-IgG (pink) and for FITC-RTX-F(ab’)2 + unlabeled RTX-F(ab’)2(blue). (e) The percentage of molecules bound more stably as estimated by globally fitting a 1:2 model to the data displayed in (d).
As RTX-F(ab’)2 displays a clearly slower off-rate than RTX-Fab, bivalent binding is the main factor for stabilization of RTX molecules on the cell surface. The bivalent stabilization of RTX seems to become less effective at higher antibody concentrations, as seen by the concentration-dependent stability of the full-length antibody (see ). In this context, bivalent binding should be understood as a dynamic state in which antibodies change between being bound with one or both arms. If the probability that an epitope near an already bound antibody becomes occupied increases, bivalent stabilization will become less efficient, and thus make dissociation more likely to happen. This explains why a more dynamic system at higher RTX concentrations is observed with antibodies exchanging more rapidly between the bound and unbound state.
In contrast to RTX-Fab, the stability of bound RTX-F(ab’)2 was influenced by the presence of free F(ab’)2 in solution. The dissociation rate in the presence of unlabeled ligand in solution was faster for RTX-F(ab’)2 than for RTX-IgG (). To test if Fc-Fc interactions affect RTX binding to CD20 on cells, the stability of bound RTX-IgG in the presence of free RTX-F(ab’)2 and the stability of bound RTX-F(ab’)2 in the presence of RTX-IgG was evaluated. As can be seen in , the dissociation of RTX-F(ab’)2 in the presence of free RTX-IgG was very similar to RTX-F(ab’)2 with free F(ab’)2 present, and thus faster than for RTX-IgG in the presence of free RTX-IgG. However, the dissociation of RTX-IgG in the presence of free RTX-F(ab’)2 was slower compared to RTX-IgG in the presence of free RTX-IgG. After fitting the data to a 1:2 binding model, we found an estimated 68% of RTX-IgG was bound in a more stable state at 60 nM when free RTX-IgG is present compared to 75% of molecules when the free molecule is missing the Fc-region and 51% when the bound molecule is missing the Fc-region (). This data suggests that RTX-IgG, in addition to bivalency, is also stabilized by Fc-mediated interactions on the cell surface.
To investigate the binding pattern of the Type II antibody OBI, its interaction with Daudi cells was recorded, initially with a standard assay set-up at 5 and 15 nM ligand concentration (). The Interaction Map displayed two distinct interactions () with the main difference in the off-rate, which differed by roughly two orders of magnitude (1.6*10−5 s−1 vs. 9.2*10−4 s−1), resulting in apparent affinities of 0.2 nM for the more stable interaction and 19 nM for the weaker interaction (). Of note, the stronger affinity values compared to RTX are not due to binding stability, as the kd values are similar, but rather due to an increase in ka values (OBI strong interaction ka = 7.0*104 M−1 s−1, weak interaction ka = 4.8*104 M−1 s−1) reflecting a better molecular recognition between OBI and CD20. For OBI, the weaker interaction is contributing more to the overall binding process than for RTX. A concentration series, with equimolar amount of unlabeled ligand in the dissociation phase, showed a similar pattern as for RTX, in that the stability of bound antibody decreased with increasing concentration (). Interaction Map analysis revealed that there is one interaction present at 5 nM (), whereas two interactions start to emerge at 7 nM that become two distinct peaks at 10 nM. The two peaks moved slightly further away from each other with increasing concentrations until 40 nM. The contribution of the more stable peak was on average 11% (Stdev = ± 1%) in the concentration range 10–60 nM to the overall binding process. Interaction Map analysis for the main contributing peak gave a kd of 3.8*10−4 s−1 at 5 nM, which increased by threefold to a kd of 1.1*10−3 s−1 at 60 nM. The apparent affinity for OBI changed from 5 to 26 nM when the OBI concentration was increased from 5 to 60 nM, respectively ().
Figure 4. (a) FITC-labeled OBI binding to Daudi cells with two increasing concentrations of 5 and 15 nM during the association phase, dissociation was measured in plain medium. (n = 4) (b) InteractionMap analysis for OBI binding to Daudi cells, input data from all four binding curves in (a) was used for the calculation. The analysis results in two defined interaction components that mainly differ in their binding stability (x-axis). The more stable component is contributing more to the overall interaction pattern, as indicated by warmer colors in the plot. However, the difference in contribution is less between the two components than for RTX (compare to ). (c) Daudi cells were incubated with FITC-OBI in the concentration range from 5 to 60 nM until binding levels are close to equilibrium followed by replacement with the same concentration of unlabeled OBI to observe the release of bound FITC-OBI. (d) Binding of 60 nM FITC-labeled OBI-Fab to Daudi cells in the presence (red) and absence (blue) of 60 nM unlabeled OBI-Fab. (e) Interaction Map analysis for the binding traces displayed in (c). With increasing concentration the main interaction component shifts to the right on the x-axis, indicating that OBI binding becomes overall less stable with increasing concentrations. From 7 nM on, a second interaction component becomes visible with separates completely from the main interaction at 10 nM. This secondary interaction component is more stable and does not change with further concentration increase, but has a minor contribution to the overall interactions, as indicated by the color scale.
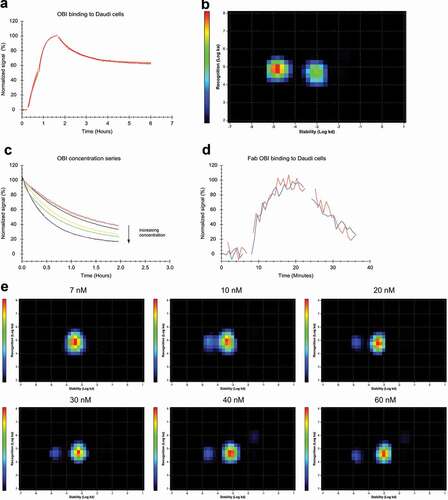
Binding experiments with OBI-Fab showed rapid dissociation and no influence of the presence of free ligand during dissociation on the stability of bound OBI-Fab (). The data fitted well to a 1:1 interaction model, resulting in kinetic parameters ka = 6.2*104 M−1 s−1 and kd = 1.6*10−3 s−1 that are similar to those obtained for RTX-Fab (). The affinity for OBI-Fab of KD = 25 nM is very similar to the affinity for 60 nM OBI-IgG in the presence of unbound antibody (KD = 26 nM), indicating that under these conditions OBI primarily binds monovalently.
In summary, the data suggest a similar binding model for OBI as for RTX: a model in which the fraction of antibodies stabilized by bivalency is decreasing with increasing concentration. The apparent off-rate in the tested concentration ranges changed by roughly threefold for both mAbs; however, OBI displays a fivefold faster off-rate to start with at the lowest concentrations (kd = 7.8*10−5 s−1 for RTX at 7 nM; kd = 3.8*10−4 s−1 at 5 nM for OBI), indicating that the portion of antibodies forming bivalent interactions is smaller for OBI compared to RTX. As the affinity is defined as the ratio between off- and on-rate, the affinity values are nevertheless similar for the two mAbs since the faster off-rate for OBI is balanced with a faster on-rate. Thus, although RTX and OBI have similar apparent affinities in the tested concentration range, the interaction of OBI with CD20 is less stabilized by bivalency and is more dynamic than for RTX.
As a third antibody, the binding pattern of OFA to Daudi cells was evaluated with association phases at 12 and 36 nM, followed by a dissociation phase in the absence of free ligand (). Interaction Map analysis of the data resulted in one dominating peak () with the kinetic parameters ka = 3.1*104 M−1 s−1 and kd = 5.1*10−6 s−1, resulting in an apparent affinity of 0.2 nM (). For OFA, a concentration series with equimolar amounts of unlabeled antibody present in the dissociation phase did not result in any clear decrease of the stability of bound antibody (), implying that the OFA interaction is less dynamic than that of RTX. This observation was supported by Interaction Map analysis which resulted in one dominating interaction peak that remained centered around a median kd of 3*10−6 s−1 (). There was, however, a faint second interaction peak that started appearing at a concentration of 40 nM and represents ca. 6% of binding events. This interaction peak became slightly more pronounced at 80 nM, now representing ca. 10% of binding events centered around a ka of 3.2*104 M−1 s−1 and a kd of 6.5*10−4 s−1, with the latter being not clearly defined, as can be seen by the spread of the interaction peak in the x-axis direction. The secondary interaction did not become significantly more pronounced at higher OFA concentrations of up to 250 nM (data not shown).
Figure 5. (a) FITC-labeled OFA binding to Daudi cells with two increasing concentrations of 12 and 36 nM during the association phase, dissociation was measured in plain medium. (n = 3) (b) InteractionMap analysis for OFA binding to Daudi cells, input data from all three binding curves in (a) was used for the calculation. The analysis results in one main interaction component with a second component only very faintly visible, barely contributing to the overall binding pattern. (c) Different concentrations of FITC-OFA were incubated on Daudi cells, close to binding equilibrium the solution was replaced with cell media containing the same amount of unlabeled OFA to observe the stability of bound OFA in the presence of free OFA in solution. (d) Binding of 10 nM (traces with longer incubation times) and 60 nM FITC-labeled OFA-Fab to Daudi cells in the presence (red) and absence (blue) of 10 nM and 60 nM unlabeled OFA-Fab, respectively. (e) Interaction Map analysis for the binding traces displayed in (c). With increasing concentration, the main interaction component spreads in y-axis direction implying that the interaction cannot be described with a single ka-value at higher concentrations. At concentrations of 40 nM and above a faintly visible second interaction component appears that is less stable compared to the main interaction component and contributes little to the overall binding pattern.
In contrast to the other two antibodies, the dominating interaction peak for OFA started moving into the y-axis direction. At 20 nM, a tail toward a slower ka-value became visible () and this tail became more pronounced with increasing concentrations until at 80 nM also the center of the interaction (depicted in red) became elongated in the y-axis direction. This pattern reflects that with increasing concentration, it becomes difficult to describe the association process with a 1:1 interaction model, as it seems that a portion of the antibodies binds slower at higher concentrations and thus the interaction cannot be described by a single ka value. As the recognition (ka) is obtained by fitting EquationEquation (2)(2)
(2) to the experimental data, the apparent slower binding can be caused by reducing the number of available CD20 epitopes while monitoring association due to bivalent binding.
To confirm that the observed weak interaction on the Interaction Map represents monovalent binding, the interaction of OFA-Fab with Daudi cells was evaluated. As expected for a 1:1 interaction, the apparent off-rate was concentration independent and not influenced by the presence of free ligand in solution during dissociation (). Fitting the binding traces to a 1:1 model resulted in kinetic parameters ka = 2.9*104 M−1 s−1 and kd = 2.2*10−4 s−1, with KD = 7.5 nM. Compared to the other two Fabs, which have similar off-rates, the off-rate for OFA-Fab was almost 10-fold slower, resulting in an affinity that is threefold stronger than for OBI-Fab and sixfold stronger than for RTX-Fab ().
In summary, from the three evaluated antibodies, OFA was stabilized the most by bivalency, followed by RTX and then OBI with the least bivalent stabilization. Bivalency inversely correlated with binding dynamics for the antibodies, with OBI displaying the most dynamic binding pattern, followed by RTX and OFA. In an ongoing study these binding patterns were confirmed on Ramos cells (data not shown).
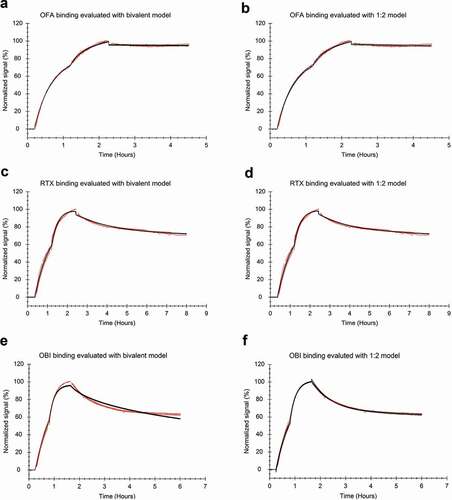
Different established kinetic binding models were fitted to the data to evaluate which model would capture the formation of monovalent and bivalent antibody-CD20 complexes best given data obtained from a typical real-time binding assay consisting of two or more association phases and a dissociation phase in the absence of unlabeled ligand. The bivalent interaction model assumes that monovalently bound ligands can bind a second target, taking into account that the number of available binding epitopes decreases faster than predicted by a 1:1 interaction. This binding model could adequately represent the shape of the OFA binding trace as it captures the underlying binding process (). The shape of the RTX binding trace could also be approximated by the bivalent model (), whereas binding of OBI to Daudi cells could not be described in a suitable manner (). For both OFA and RTX, the bivalent model was not able to reliably define the kinetic constants for the secondary interaction that describes the binding dynamics of the second arm. For all three antibodies, the binding traces could be represented by the 1:2 interaction model (), which assumes that the binding process is the sum of two interaction processes. In accordance with the Interaction Maps, the interaction components mainly differed in their stability and thus kd-values for OBI and RTX (see ), as the major deviation from a 1:1 interaction is the differing binding stabilities of monovalent and bivalent bound antibodies. In this case, the two interaction processes defined by the 1:2 model represent the monovalent and bivalent fraction. The OFA interaction is the least dynamic and almost all antibodies bind bivalently at the tested concentrations, which is why the most pronounced deviation from a 1:1 interaction lies in the decrease of available epitopes due to bivalent binding seemingly causing a decrease in recognition. This is reflected by differing ka-values for the two interaction components obtained from fitting the 1:2 model (see ) that, in the case of OFA, represent binding to a non-crowded and crowded cell surface, as the fraction of antibodies binding monovalently is too small to be assigned to one of the two interaction processes.
Table 4. Kinetics for RTX, OBI and OFA binding traces from , and as extracted with a 1:2 binding model.
Figure 6. Antibody binding to Daudi cells with two increasing concentrations and a dissociation measured in plain medium (red) evaluated by applying a global fit (black) (a, b) FITC-labeled OFA at 12 and 36 nM during the association phase (n = 3) fitted to the bivalent model (a) or the 1:2 model (b). (c, d) FITC-labeled RTX at 20 and 60 nM during the association phase (n = 4) fitted to the bivalent model (c) or the 1:2 model (d). (e, f) FITC-labeled OBI at 12 and 36 nM during the association phase (n = 3), fitted to the bivalent model (e) or the 1:2 model (f).
Discussion
In this study, the binding mode for the three therapeutic mAbs, RTX, OBI and OFA was investigated in detail on live Daudi cells. When comparing the kinetics of the three therapeutic mAbs, RTX, OBI and OFA, we found that OFA is the most stabilized by bivalency on the cell surface, followed by RTX and then OBI, which displays the least amount of bivalent binding. For RTX and OBI, we found that bivalent stabilization decreases when free antibody is present in solution, and this reduced stability increases with antibody concentration until a certain concentration after which the apparent affinity reaches a plateau value. The decrease in stabilization seems to be mainly a consequence of a concentration-dependent crowding effect at the cell surface, which lowers the presence of free epitopes for bivalent binding in proximity to occupied epitopes. This phenomenon is barely noticeable for OFA due to an overall very stable binding, with an estimated 90% of antibodies binding bivalently at a concentration of 80 nM. Monovalent binding of Fabs was found to be more stable for OFA, with an almost 10-fold slower off-rate than for the other two antibodies. An increased stability, when being bound with one arm, allows more time to find a second epitope nearby, and could thereby contribute to the more efficient bivalent stabilization of OFA. Rougé et al. recently reported that CD20 is a dimer to which two RTX-Fab can bind, whereas due to sterical constraints only one OBI-Fab can bind per CD20 dimer.Citation25 This provides a well-fitting structural explanation for why we observed a higher degree of bivalent binding on cells for RTX compared to OBI, which showed little bivalent stabilization, while the dynamics of their Fab binding is similar. Rougé et al. further describe the presence of Fab:Fab contacts for RTX in the CD20 dimer structure, but do not find RTX Fab-Fab interactions in solution.Citation25 The RTX-Fab binding data presented here followed a 1:1 Langmuir binding model, and no indications for secondary stabilizing events were found. We therefore conclude that while Fab:Fab contacts may also be present in a cellular context, Fab-Fab interactions do not seem to be a significant driving force for RTX binding to CD20 expressed on cells. Instead, we found indications for Fc-mediated interactions to be a secondary stabilizing factor for RTX binding on the cell surface, although they clearly contributed less than bivalency.
Affinity values previously obtained by others with end-point binding assays for the three mAbs on B-cell lines lie between the affinity values for the strong and weak interactions reported here, as derived from the experiments in the absence of unlabeled ligand during dissociation, with values ranging from 3.6 to 7.4 nM for RTX,Citation8,Citation12,Citation26 3.7 nM for OBI and 4.1 nM for OFA.Citation8 Indications for the suggested binding models in this study can also be found in previous work. For example, it has been reported that OFA has a slower off-rate compared to RTX, and it has also been observed that the apparent off-rate for RTX is faster in the presence of antibody in solution compared to dissociation in plain medium.Citation11,Citation17 Furthermore, a biphasic dissociation behavior for RTX, but not for OFA, was reported previously by Meyer et al.Citation11 and indications for this can also be found in published data by others.Citation17
In a previous study, we noted that RTX binding to Daudi cells did not follow a 1:1 interaction model and evaluated the interaction with various established binding models, concluding that, even though the bivalent model could represent the data in an acceptable manner, it was not the most robust in the fitting analysis amongst all applied models.Citation22 This is in agreement with the data presented in this report for the RTX and OFA interaction: the bivalent model fits to the recorded data, but the rates describing bivalency cannot be reliably determined. In the previously reported analysis the 1:1, 2-state model was found to be more robust for fitting to RTX binding traces, but further experiments with different incubation times and ligand concentration revealed that the 1:1, 2-state model did not fully explain the obtained data. Both the 1:1, 2-state and the bivalent model describe a stabilization of the bound ligand with increasing incubation times, which could not be captured with the type of real-time binding experiments on live cells presented here (data not shown). A plausible reason for this is that the bivalent model assumes that epitopes are equally distributed, which is not the case for CD20 expressed on a cell surface as CD20 is an oligomer known to cluster in microdomains. The high local epitope concentration is reflected by the model by generating relatively high values that are poorly defined for the rate in which bivalent bound antibodies are formed. When in this scenario of high local epitope concentration, the binding is also dynamic, this results in a fast establishment of monovalent and bivalent bound antibody fractions. This makes fitting the rates that describe the bivalency less robust, and also explains why increasing incubation times in the timescale of minutes or hours does not noticeably affect the stabilization of the antibody. However, a concentration-dependent de-stabilization due to crowding effects on the cell surface was clearly noticeable in the experimental data: during the dissociation phase in plain medium the cell-surface becomes less crowded over time and more CD20 is available for bivalent stabilization, causing the apparent off-rate to slow down, resulting in a biphasic dissociation pattern. A model that describes concentration-dependent stabilization is the 1:2 model, and for rapid establishment of bivalency in comparison to the measurement time, this model is more appropriate as it regards the overall binding process as a sum of two fractions, monovalently and bivalently bound antibodies. This was clearly exemplified by binding of OBI, which was the most dynamic of three antibodies and could not be represented by the bivalent model, but was well described by the 1:2 model.
Strasser et al.Citation27 recently reported that, on artificially generated antigenic lipid membranes, bound antibodies can form transient Fc-Fc interaction with antibodies in solution and thereby increase the likelihood for binding to a nearby epitope. We found indications for transient Fc-Fc interactions for RTX binding to CD20 on Daudi cells, thereby confirming the observations made by Strasser et al. in a cellular system. Full-length RTX displayed a faster apparent off-rate in the presence of unbound RTX-IgG compared to RTX-F(ab)2. This could be explained by Fc-Fc interactions between bound and free RTX-IgG, which increases the likelihood of binding in proximity to already bound RTX and thus locally decreases the availability of unoccupied CD20, leading to fewer possibilities for bivalent stabilization of bound RTX. An increased likelihood of binding events taking place close to already bound antibody is also supported by the observed fast and relatively strong quenching in the real-time proximity assay.
In the same study by Strasser et al., the authors also mentioned that better CDC efficiency was observed for bivalent antibody compared to monovalent antibody.Citation27 This is in accordance with the data presented here that shows a degree of bivalent binding OFA > RTX > OBI that corresponds to how efficiently these mAbs can mediate CDC.Citation8,Citation17 Antibodies that efficiently mediate CDC have been shown to promote cluster formation of CD20, whereas antibodies that show low CDC efficacy do not induce clustering of CD20. One of the defining features of Type I antibodies is complement activation, and it has been suggested that Type I antibodies bind between CD20 tetramers causing them to be cross-linked, whereas Type II antibodies bind (depicted as bivalently in most schematics) within one tetramer.Citation16,Citation28,Citation29 Taken together, this makes one wonder if antibodies that bind bivalently to a higher degree have a bigger capacity to cross-link CD20 on the cell surface, and thereby can induce CDC more efficiently, whereas antibodies that bind monovalently to a higher degree result in less efficient cross-linking of CD20, and therefore less efficient CDC. This is further supported by a recent study that found CD20 to be a dimer that can be bound by two RTX-Fab arms, but for sterical reasons likely belong to two different antibody molecules.Citation25 However, the notion that bivalent binding correlates with CDC efficacy is contradicted by previous studies that found changing one of the Fab arms of anti-epidermal growth factor receptor antibodies to an irrelevant binding epitope, and thereby making them functionally monovalent, enhanced the CDC capacity of these antibodies compared to their parental version.Citation10,Citation30 It is possible that the optimal binding mode for efficient complement activation differs for mAbs targeting different receptors.
Complement activation is one of the functional aspects that divides antibodies into Type I and II, and, among the underlying molecular parameters for this distinction, the apparent off-rate, binding epitope and elbow angle are all discussed in several studies with both confirmatory and contradictory data.Citation11,Citation12,Citation15-Citation17,Citation31 How well an antibody can bind bivalently is influenced by the binding epitope and the elbow angle, while the apparent off-rate might reflect the degree of bivalent binding. However, it is likely that no perfect correlation exists, as some antibodies could have relatively strong monovalent binding while their binding geometry might hinder bivalency. This further suggests that bivalency is a potential molecular feature that might be connected to complement activation, but a larger panel of anti-CD20 mAbs should be evaluated to establish with certainty if and how bivalency influences CDC efficacy.
Traditionally, affinity is the binding parameter that is evaluated during drug development. As shown here, however, antibodies may have similar affinities but differ in their binding dynamics and degree of bivalent binding. Understanding which binding characteristics have a potential influence on the mode of action of therapeutic antibodies would allow antibody screening for desired functional properties early on in the drug development process and facilitate rational drug design.
Materials and methods
Cell culture and seeding
Daudi (ATCC) and K562 (kind gift from Prof. Stenerlöw, Uppsala University) cells were both cultured in RPMI 1640 cell medium (Biochrom AG) supplemented with 10% fetal bovine serum (Sigma Life Science), 2 mM L-glutamine (Biochrom AG) and 100 µg/ml penicillin-streptomycin (Biochrom AG). In addition, 1 mM sodium pyruvate (Sigma-Aldrich) was added to Daudi cells. For real-time binding assays, cells were tethered to Petri dishes (Nunc 263991, Thermo Fischer Scientific) using a biomolecular anchor molecule (BAM) (SUNBRIGHT® OE-040CS, NOF Corporation), essentially according to a previously published protocol.Citation20 In brief, BAM was dissolved in Milli-Q water to 2 mg/ml and drops of 400 µl were carefully placed opposite each other on a Petri dish. Differing from the previous published protocol, BAM was incubated for 1 h (instead of 2 h) at room temperature. Then the solution was carefully aspirated and replaced with cells suspended in phosphate-buffered saline (PBS). Due to differences in cell size, 3*106 Daudi and 1*106 K562 cells were added to opposing spots and let to adhere at room temperature for 40 min. The remaining cell suspension was aspirated by tilting the dish, followed by adding 10 ml cell culture medium and placing the dish in a humidified incubator at 37°C with 5% CO2.
Antibody fragmentation and labeling
Rituximab and ofatumumab were purchased from Apoteket AB (Sweden) in clinical formulation, obinutuzumab was kindly gifted by Dr. Matthias Peipp (Kiel University, Germany). Fabs were generated using the Pierce Fab Preparation Kit (Thermo Fisher Scientific) following the manufacturer’s instructions. F(ab’)2 were generated using pepsin immobilized on agarose resin beads (Thermo Fisher Scientific) following the user guide provided by the manufacturer. After Fab and F(ab’)2 fragmentation, the buffer was exchanged to PBS using a Nap-5 Sephadex G-25 column (Illustra, GE Healthcare). For fragments that were to be labeled with FITC (Sigma-Aldrich), the buffer was directly exchanged to borate buffer pH 9.2. Full-length antibodies were diluted in PBS to a concentration of 2 mg/ml and then further diluted 1:2 with borate buffer. Roughly 100 ng of FITC, dissolved in dimethlysulfoxide, was added for every µg of protein and the mixture was incubated for 1.5 h at 37°C. Excess FITC was removed through another buffer exchange into PBS with a Nap-5 column. RTX was labeled according to the same procedure also with the quencher Q540 (Atto-tech). The concentrations of antibodies and fragments were measured with Nanophotometer P360 (Implen) at 280 nm using an estimated extinction coefficient of 1.4 with dye correction at 495 nm for FITC where appropriate. Labeled antibodies and fragments were kept at 4°C for short term (<1 month) and at −20°C for long storage.
Real-time cell-binding assay
Binding kinetics to live cells were measured with LigandTracer Green (Ridgeview Instruments, Sweden) as detailed previously.Citation20 In the LigandTracer instrument, the cell dish is kept on an inclined and rotating support with the detection unit mounted above the upper part, thereby allowing discrimination between fluorescence originating from free and cell-bound labeled proteins. During each rotation, signals from both cell areas are recorded and the signal from the reference area containing the CD20-negative cell line K562 is automatically subtracted from the signal obtained from the area where Daudi cells were tethered to the dish. A standard assay set-up consists of a baseline with typically 3 ml fresh cell culture medium, followed by two association phases with increasing ligand concentrations that result in curvature and a dissociation phase. For the latter, the incubation medium is exchanged for cell media not containing any ligand to record the stability of formed ligand-target complexes on the cell surface. To obtain the highest data quality for extracting interaction rates and affinity values, concentrations during the association phases are adapted to the interaction characteristics.
This assay can be adapted to measure if ligands bind in proximity on the cell-surface by introducing a second ligand labeled with a quencher that upon addition decreases the fluorescent binding signal of the first ligand.Citation24 Here, this real-time proximity assay was used to follow co-localization of RTX with itself by first incubating the cells with FITC-RTX and then adding RTX labeled with quencher Q540-RTX. Signal decrease due to self-competition was accounted for by control experiments with unlabeled RTX.
Real-time interaction analysis with binding models
The simplest interaction model that describes the reversible interaction between a ligand (L) in solution and a target (T) expressed on the cell surface, is the so-called 1:1 Langmuir binding model (EquationEquation 1(1)
(1) ). This model assumes that an interaction is described by a single association rate constant, ka, for complex formation and a single dissociation rate constant kd for complex decay. The molecular recognition between target and ligand is reflected by ka, whereas kd, reflects the stability of the formed complex. The ratio of the rate constants kd/ka gives the affinity KD, a parameter often used to express the overall strength of an interaction.
Given that the total number of targets is constant, EquationEquation (1)(1)
(1) can be rewritten as a function of time (t) and ligand concentration ([L]) to describe the change in the number of complexes.
In real-time interaction analysis, the measured signal B is proportional to the number of complexes, and Bmax is the theoretical signal obtained at target saturation. The kinetic parameters ka and kd, as well as the target saturation level (=B/Bmax) for each datapoint, are derived from the non-linearity of the binding signal over time.
More complex interaction models are required to describe heterogeneous interactions with more than one ka and kd. For example, the 1:2 model assumes that the ligand can bind two different types of target populations, resulting in two independent 1:1 interactions with distinct kinetic parameters.
The bivalent model assumes that after being bound to one target, all ligands have the capacity to bind a second target of the same type and are thereby stabilized. Dissociation happens step-wise, first from one target, then from the second target, with both steps being reversible.
Real-time binding traces were analyzed with TraceDrawer 1.8.3 (Ridgeview Instruments AB) according to one of the models described above. For easier visual comparison, binding traces were normalized to 0% signal level at baseline level and 100% at the beginning of the dissociation phase. Normalization does not affect data analysis, as interaction rate constants are derived from the shape of the binding trace irrespective of signal height.
Interaction Map analysis
Interaction Map (Ridgeview Diagnostics, Sweden) is a data analysis method that estimates the presence and rate constants of multiple 1:1 interactions and their contribution to an overall binding process. Mathematically, the method searches a defined 2-dimensional space of ka and kd values for independent 1:1 interactions that are assigned weighing factors according to their contribution to the measured binding trace. The weighted sum of all interactions represents the measured binding curve. Visually, all individual interactions are presented in a ka/kd-plot with heat-map coloration indicating the weight of each interaction peak at the measured ligand concentrations.
Abbreviations
Disclosure of potential conflicts of interest
SB is an employee and JB is an employee and shareholder of Ridgeview Instruments AB.
Acknowledgments
The authors wish to thank Dr. Matthias Peipp for providing obinutuzumab.
Additional information
Funding
References
- Pierpont TM, Limper CB, Richards KL. Past, present, and future of rituximab-the world’s first oncology monoclonal antibody therapy. Front Oncol. 2018;8:163. doi:https://doi.org/10.3389/fonc.2018.00163.
- Salles G, Barrett M, Foà R, Maurer J, O’Brien S, Valente N, Wenger M, Maloney DG. Rituximab in B-cell hematologic malignancies: a review of 20 years of clinical experience. Adv. Ther. 2017;34:2232–13. doi:https://doi.org/10.1007/s12325-017-0612-x.
- Chan HTC, Hughes D, French RR, Tutt AL, Walshe CA, Teeling JL, Glennie MJ, Cragg MS. CD20-induced lymphoma cell death is independent of both caspases and its redistribution into Triton X-100 insoluble membrane rafts. Cancer Res. 2003;63:5480–89.
- Ivanov A, Beers SA, Walshe CA, Honeychurch J, Alduaij W, Cox KL, Potter KN, Murray S, Chan CHT, Klymenko T, et al. Monoclonal antibodies directed to CD20 and HLA-DR can elicit homotypic adhesion followed by lysosome-mediated cell death in human lymphoma and leukemia cells. J Clin Invest. 2009;119:2143–59. doi:https://doi.org/10.1172/JCI37884.
- Wang W, Erbe AK, Hank JA, Morris ZS, Sondel PM. NK cell-mediated antibody-dependent cellular cytotoxicity in cancer immunotherapy. Front Immunol. 2015;6:368. doi:https://doi.org/10.3389/fimmu.2015.00368.
- Meyer S, Leusen JHW, Boross P. Regulation of complement and modulation of its activity in monoclonal antibody therapy of cancer. mAbs. 2014;6:1133–44. doi:https://doi.org/10.4161/mabs.29670.
- Weiskopf K, Weissman IL. Macrophages are critical effectors of antibody therapies for cancer. mAbs. 2015;7:303–10. doi:https://doi.org/10.1080/19420862.2015.1011450.
- Herter S, Herting F, Mundigl O, Waldhauer I, Weinzierl T, Fauti T, Muth G, Ziegler-Landesberger D, Puijenbroek EV, Lang S, Duong MN, et al. Preclinical activity of the Type II CD20 antibody GA101 (Obinutuzumab) compared with rituximab and ofatumumab in vitro and in xenograft models. Mol Cancer Ther. 2013;12:2031–42. doi:https://doi.org/10.1158/1535-7163.MCT-12-1182.
- Cragg MS, Morgan SM, Chan HTC, Morgan BP, Filatov AV, Johnson PWM, French RR, Glennie MJ. Complement-mediated lysis by anti-CD20 mAb correlates with segregation into lipid rafts. Blood. 2003;101:1045–52. doi:https://doi.org/10.1182/blood-2002-06-1761.
- Diebolder CA, Beurskens FJ, de Jong RN, Koning RI, Strumane K, Lindorfer MA, Voorhorst M, Ugurlar D, Rosati S, Heck AJR, et al. Complement is activated by IgG hexamers assembled at the cell surface. Science. 2014;343:1260–63. doi:https://doi.org/10.1126/science.1248943.
- Meyer S, Evers M, Jansen JHM, Buijs J, Broek B, Reitsma SE, Moerer P, Amini M, Kretschmer A, ten Broeke T, et al. New insights in Type I and II CD20 antibody mechanisms-of-action with a panel of novel CD20 antibodies. Br J Haematol. 2018;180:808–20. doi:https://doi.org/10.1111/bjh.15132.
- Li B, Zhao L, Guo H, Wang C, Zhang X, Wu L, Chen L, Tong Q, Qian W, Wang H, et al. Characterization of a rituximab variant with potent antitumor activity against rituximab-resistant B-cell lymphoma. Blood. 2009;114:5007–15. doi:https://doi.org/10.1182/blood-2009-06-225474.
- Nishida M, Uematsu N, Kobayashi H, Matsunaga Y, Ishida S, Takata M, Niwa O, Padlan EA, Newman R. BM-ca is a newly defined type I/II anti-CD20 monoclonal antibody with unique biological properties. Int J Oncol. 2011;38:335–44. doi:https://doi.org/10.3892/ijo.2010.864.
- Bornstein GG, Quéva C, Tabrizi M, van Abbema A, Chavez C, Wang P, Foord O, Ahluwalia K, Laing N, Raja S, et al. Development of a new fully human anti-CD20 monoclonal antibody for the treatment of B-cell malignancies. Invest New Drugs. 2010;28:561–74. doi:https://doi.org/10.1007/s10637-009-9291-z.
- Teeling JL, Mackus WJM, Wiegman LJJM, van den Brakel JHN, Beers SA, French RR, van Meerten T, Ebeling S, Vink T, Slootstra JW, et al. The biological activity of human CD20 monoclonal antibodies is linked to unique epitopes on CD20. J Immunol. 2006;177:362–71. doi:https://doi.org/10.4049/jimmunol.177.1.362.
- Niederfellner G, Lammens A, Mundigl O, Georges GJ, Schaefer W, Schwaiger M, Franke A, Wiechmann K, Jenewein S, Slootstra JW, et al. Epitope characterization and crystal structure of GA101 provide insights into the molecular basis for type I/II distinction of CD20 antibodies. Blood. 2011;118:358–67. doi:https://doi.org/10.1182/blood-2010-09-305847.
- Teeling JL, French RR, Cragg MS, van den Brakel J, Pluyter M, Huang H, Chan C, Parren PWHI, Hack CE, Dechant M, et al. Characterization of new human CD20 monoclonal antibodies with potent cytolytic activity against non-Hodgkin lymphomas. Blood. 2004;104:1793–800. doi:https://doi.org/10.1182/blood-2004-01-0039.
- Mössner E, Brünker P, Moser S, Püntener U, Schmidt C, Herter S, Grau R, Gerdes C, Nopora A, van Puijenbroek E, et al. Increasing the efficacy of CD20 antibody therapy through the engineering of a new type II anti-CD20 antibody with enhanced direct and immune effector cell–mediated B-cell cytotoxicity. Blood. 2010;115:4393–402. doi:https://doi.org/10.1182/blood-2009-06-225979.
- Ferrara C, Stuart F, Sondermann P, Brünker P, Umaña P. The carbohydrate at FcgammaRIIIa Asn-162. An element required for high affinity binding to non-fucosylated IgG glycoforms. J Biol Chem. 2006;281:5032–36. doi:https://doi.org/10.1074/jbc.M510171200.
- Bondza S, Foy E, Brooks J, Andersson K, Robinson J, Richalet P, Buijs J. Real-time characterization of antibody binding to receptors on living immune cells. Front. Immunol. 2017;8. doi:https://doi.org/10.3389/fimmu.2017.00455.
- Engelberts PJ, Voorhorst M, Schuurman J, van Meerten T, Bakker JM, Vink T, Mackus WJM, Breij ECW, Derer S, Valerius T, et al. Type I CD20 Antibodies Recruit the B Cell Receptor for Complement-Dependent Lysis of Malignant B Cells. J Immunol. 2016;197:4829–4837. doi:https://doi.org/10.4049/jimmunol.1600811 12
- Natsume A, Shimizu‐Yokoyama Y, Satoh M, Shitara K, Niwa R. Engineered anti-CD20 antibodies with enhanced complement-activating capacity mediate potent anti-lymphoma activity. Cancer Sci. 2009;100:2411–18. doi:https://doi.org/10.1111/j.1349-7006.2009.01327.x.
- Singh V, Gupta D, Arora R, Tripathi RP, Almasan A, Macklis RM. Surface levels of CD20 determine anti-CD20 antibodies mediated cell death in vitro. PLoS One. 2014;9. doi:https://doi.org/10.1371/journal.pone.0111113.
- Bondza S, Björkelund H, Nestor M, Andersson K, Buijs J. Novel real-time proximity assay for characterizing multiple receptor interactions on living cells. Anal Chem. 2017;89:13212–18. doi:https://doi.org/10.1021/acs.analchem.7b02983.
- Rougé L, Chiang N, Steffek M, Kugel C, Croll TI, Tam C, Estevez A, Arthur CP, Koth CM, Ciferri C, et al. Structure of CD20 in complex with the therapeutic monoclonal antibody rituximab. Science. 2020;367:1224–30. doi:https://doi.org/10.1126/science.aaz9356.
- Lindorfer MA, Cook EM, Tupitza JC, Zent CS, Burack R, de Jong RN, Beurskens FJ, Schuurman J, Parren PWHI, Taylor RP, et al. Real-time analysis of the detailed sequence of cellular events in mAb-mediated complement-dependent cytotoxicity of B-cell lines and of chronic lymphocytic leukemia B-cells. Mol Immunol. 2016;70:13–23. doi:https://doi.org/10.1016/j.molimm.2015.12.007.
- Strasser J, de Jong RN, Beurskens FJ, Wang G, Heck AJR, Schuurman J, Parren PWHI, Hinterdorfer P, Preiner J, et al. Unraveling the macromolecular pathways of IgG oligomerization and complement activation on antigenic surfaces. Nano Lett. 2019;19:4787–96. doi:https://doi.org/10.1021/acs.nanolett.9b02220.
- Klein C, Lammens A, Schäfer W, Georges G, Schwaiger M, Mössner E, Hopfner K-P, Umaña P, Niederfellner G. Epitope interactions of monoclonal antibodies targeting CD20 and their relationship to functional properties. mAbs. 2013;5:22–33. doi:https://doi.org/10.4161/mabs.22771.
- Oldham RJ, Cleary KLS, Cragg MS. CD20 and its antibodies: past, present, and future. Forum Immunopathol Dis Ther. 2014;5:7–23.
- Wang B, Yang C, Jin X, Du Q, Wu H, Dall’Acqua W, Mazor Y. Regulation of antibody-mediated complement-dependent cytotoxicity by modulating the intrinsic affinity and binding valency of IgG for target antigen. mAbs. 2020;12:1690959. doi:https://doi.org/10.1080/19420862.2019.1690959.
- Uchiyama S, Suzuki Y, Otake K, Yokoyama M, Ohta M, Aikawa S, Komatsu M, Sawada T, Kagami Y, Morishima Y, et al. Development of novel humanized anti-CD20 antibodies based on affinity constant and epitope. Cancer Sci. 2010;101:201–09. doi:https://doi.org/10.1111/j.1349-7006.2009.01392.x.