
ABSTRACT
Current combination therapies elicit high response rates in B cell malignancies, often using CD20 antibodies as the backbone of therapy. However, many patients eventually relapse or develop progressive disease. Therefore, novel CD20 antibodies combining multiple effector mechanisms were generated. To study whether neutrophil-mediated destruction of B cell malignancies can be added to the arsenal of effector mechanisms, we chimerized a panel of five previously described murine CD20 antibodies to the human IgG1, IgA1 and IgA2 isotype. Of this panel, we assessed in vitro antibody-dependent cell-mediated cytotoxicity (ADCC), complement-dependent cytotoxicity (CDC) and direct cell death induction capacity and studied the efficacy in two different in vivo mouse models. IgA antibodies outperformed IgG1 antibodies in neutrophil-mediated killing in vitro, both against CD20-expressing cell lines and primary patient material. In these assays, we observed loss of CD19 with both IgA and IgG antibodies. Therefore, we established a novel method to improve the assessment of B-cell depletion by CD20 antibodies by including CD24 as a stable cell marker. Subsequently, we demonstrated that only IgA antibodies were able to reduce B cell numbers in this context. Additionally, IgA antibodies showed efficacy in both an intraperitoneal tumor model with EL4 cells expressing huCD20 and in an adoptive transfer model with huCD20-expressing B cells. Taken together, we show that IgA, like IgG, can induce ADCC and CDC, but additionally triggers neutrophils to kill (malignant) B cells. We conclude that antibodies of the IgA isotype offer an attractive repertoire of effector mechanisms for the treatment of CD20-expressing malignancies.
Introduction
Three CD20 antibodies are clinically approved for the treatment of patients with CD20-expressing Non-Hodgkin lymphomas and chronic lymphocytic leukemia. Rituximab, the first approved antibody to target CD20, functions via antibody-dependent cell-mediated cytotoxicity (ADCC) and complement-dependent cytotoxicity (CDC), without inducing direct cell death (Type I antibody characteristics).Citation1 Ofatumumab was developed as a second-generation CD20 antibody, selected to enhance complement activation and is, in contrast to rituximab, fully human. The most recently approved CD20 antibody, obinutuzumab, is a afucosylated, which enhances ADCC. Furthermore, obinutuzumab differs from its predecessors by the ability to induce direct apoptosis, but it induces CDC to a lesser extend (type II antibody characteristics).Citation2
Currently, standard treatment for the most prevalent lymphoma and leukemia includes CD20 antibodies. For diffuse large B cell lymphoma (DLBCL), first-line therapy encompasses R-CHOP (rituximab, cyclophosphamide, doxorubicin, vincristine, and prednisone). Although response rates are high, patients who initially respond often become resistant to therapy. For these groups, outcome is particularly poor. Efforts to improve R-CHOP, such as intensifying antibody dose, chemotherapeutics, or substituting rituximab for obinutuzumab have failed to show significant improvements in patient outcomes.Citation3–Citation5
For chronic lymphocytic leukemia (CLL), modifications of the treatment regimen are showing benefit. By substituting obinutuzumab for rituximab/ofatumumab, addition of Bruton’s Tyrosine kinase (BTK) inhibitors or the Bcl-2 inhibitor venetoclax, significant progress is being made. Nevertheless, patients still relapse or progress frequently, and resistance to antibody therapy often occurs.Citation6 Therefore, CD20 antibodies eliciting different modes of action are urgently required.
We previously described a novel panel of murine CD20 antibodies with distinct variable regions.Citation7 These antibodies all display Type I characteristics, and some induced more potent complement activation as mouse IgG2c antibodies than rituximab or 7D8, a murine antibody with similar characteristics as ofatumumab. Upon chimerization of a subpanel of these CD20 antibodies to human IgG1, one antibody gained the ability to perform both type I and type II properties.
The aim of our study was to enhance the potential of these antibodies to stimulate polymorphonuclear granulocytes (PMN). Therefore, we chose to chimerize them to the human IgA isotype, since this isotype was previously shown to elicit superior killing of tumor cells via PMN.Citation8,Citation9 Here, we compared the effector mechanisms of five novel antibodies as IgG1, IgA1 and IgA2(m1) in vitro and assessed their efficacy in vivo.
Results
Antibody binding and glycoprofile
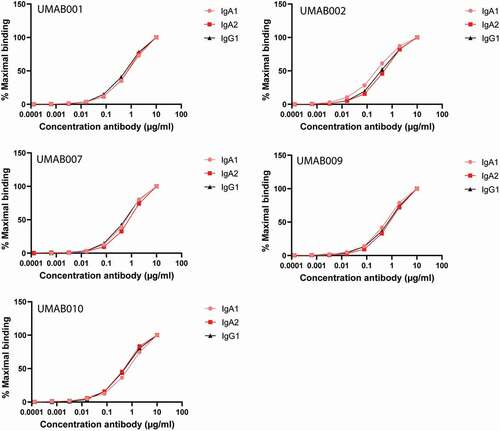
We compared the effector mechanisms of five CD20 antibodies as IgG1, IgA1 and IgA2(m1). The chimerized antibodies were named UMAB, with each number referring to the original murine antibody names described previously.Citation7 First, antibody binding to CD20-expressing Ramos cells was evaluated by flow-cytometric analysis. All antibodies showed similar binding patterns between the IgG1, IgA1 or IgA2 isotypes of the different variable regions (). In addition, binding was similar between the variable regions when compared between each isotype ().
Figure 1. CD20 antibodies bind similarly to CD20. Antibody-binding to Ramos cells analyzed by flow cytometry. Graphs show binding for IgG1, IgA1 and IgA2 for each different variable region antibody at several antibody concentrations. One representative graph is shown for at least n = 3 independent experiments.
Because glycosylation is an important therapeutic antibody feature, the glycoprofiles of our antibodies were analyzed by a mass-spectrometry-based approach. As expected, N-glycosylation of IgG1 antibodies was homogenous between antibodies (). For the IgA1 antibodies, multiple major and minor glycoforms could be detected (). Dominant signals included a nonfucosylated diantennary species with a single α2,6-sialylated galactose, as well as its variants with an additional galactose or without the sialic acid. Minor signals included tri- and tetraantenary species, α2,3-linked sialylation, fucosylation, as well as some high-mannose species. In general, the relative glycosylation was highly similar between the different IgA1 CD20 antibodies. All tested IgA2 antibodies shared the most prevalent glycoform with IgG1, a complex fucosylated diantennary glycan lacking galactose. Next to this, species with galactosylation and sialylation (both α2,3- and α2,6-linked) could be detected, differing somewhat in relative intensity depending on the antibody (). Altogether, glycan analysis indicated the glycosylation to be consistent across antibodies of the same isotype (either IgG1, IgA1 or IgA2), but different between the isotypes.
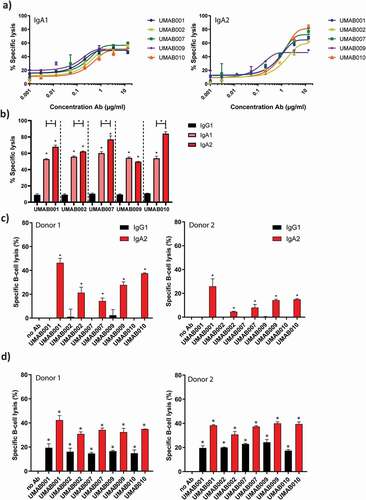
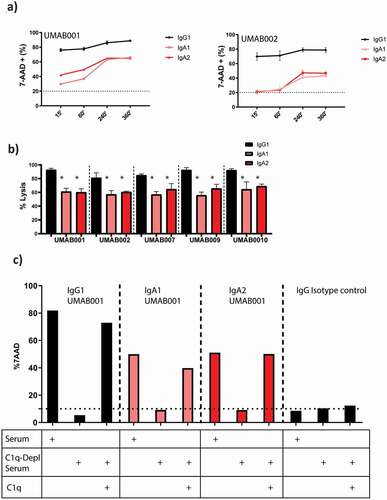
Figure 2. ADCC by a panel of CD20 antibodies of the IgA1, IgA2 and IgG1 isotype. (a) PMN-mediated ADCC against Ramos cells by IgA CD20 antibodies at several antibody concentrations. After 4 h at 37°C,51-Cr-release was measured to assess specific lysis. PMN were added to tumor cells at an ET ratio of 40:1. One representative graph is shown for at least n = 3 independent experiments. (b) Maximal lysis achieved by antibodies in A. Asterisks indicate statistically significant differences between IgG1 and IgA antibodies. Capped lines with asterisks indicate a statistically significant difference between IgA1 and IgA2 antibodies. (c) ADCC assays against healthy B cells with autologous PMN as effector cells. Antibodies were added to tumor cells at 5 µg/ml. PMN were added to tumor cells at an ET ratio of 40:1. After 4 h at 37°C,51-Cr-release was measured to assess specific lysis. Results of two different donors are shown (left and right panel). Asterisks indicate a significant difference to the no Ab control. (d) B-CLL ADCC assays with allogenic PMN as effector cells. Results of two different PMN donors are shown (left and right panel). After 4 h at 37°C,51-Cr-release was measured to assess specific lysis. Antibodies were added to tumor cells at 4 µg/ml. PMN were added at an E:T ratio of 40:1. Asterisks indicate statistically significant differences to the no Ab control.
Next, we studied the effector mechanisms of these antibodies in ADCC, CDC and apoptosis assays.
IgA antibodies outperform IgG1 antibodies in PMN-mediated ADCC and B-cell depletion
We analyzed the capacity of the novel human IgG1, IgA1 and IgA2 CD20 antibodies to trigger ADCC against CD20-expressing tumor cells by human PMN. As previously observed with the murine variants of these antibodies, ADCC of the different antibodies was similar over a range of antibody concentrations between IgA1 (, left panel) and IgA2 antibodies (, right panel).Citation7 Interestingly, IgA2 antibodies were able to lyse significantly more cells at the highest tested concentration compared to IgA1 for 4 of 5 tested antibodies (). All IgG1 antibodies facilitated poor lysis by granulocytes in comparison to IgA antibodies (), as observed for other CD20 antibodies.Citation1,11Citation10
Next, we evaluated the ability of these antibodies to perform ADCC against isolated B cells with PMN as effector cells. In an autologous setting with B cells from a healthy donor, IgA2 antibodies killed B cells more efficiently in comparison to IgG1, shown for two different donors (). Finally, ADCC assays on isolated primary B-CLL cells from a CLL patient were performed, with granulocytes from two different healthy donors as effector cells. Also here, IgG1 antibodies recruited PMN less efficiently as compared to IgA2 antibodies, although higher lysis was achieved for IgG1 antibodies than in the previous assays with healthy B cells ().
CD24 as an additional marker improves reliability of FACS-based B-cell depletion assays
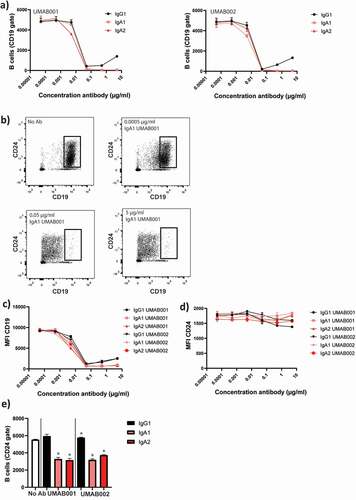
In flow-cytometric autologous B-cell depletion assays with whole leukocytes, we initially gated on CD19+ cells to track B cells. Here, loss of CD19 in a concentration-dependent manner was observed, excluding cells from gating, thus letting us initially believe B cell reduction occurred for all antibodies in a similar fashion (). However, when CD24 was used as a secondary marker for B cells (gating strategy shown in ), it became apparent that cells only lost CD19 (), but remained stable in CD24 staining, and were not killed, based on forward scatter (FSC)/side scatter (SSC) values (). When gating on the CD24 + B cells, it became clear that IgG antibodies did not reduce B cell numbers, while IgA antibodies were able to significantly decrease B cell numbers ().
Figure 3. CD24 is a stable marker for B cell depletion and indicates B-cell depletion more closely than CD19. WBLs were incubated for 4 h at 37°C in the presence of CD20 antibodies. The level of B-cell depletion was analyzed by flow cytometry. (a) Apparent loss of B cells mediated by IgA1, IgA2 and IgG1 CD20 antibodies. (b) Effect of increasing antibody concentration (IgA1 UMAB001) on CD19 levels. (c) Quantification of CD19 expression at several antibody concentrations, gated on CD24 + B cells (d) Quantification of CD24 expression on initially CD19 positive B cells. (e) Quantification of remaining B cells after whole blood leukocyte-mediated B cell depletion assay with CD20 antibodies gating on CD24 + B cells. One representative graph is shown for at least n = 3 independent experiments. Asterisks indicate statistically significant differences compared to the no Ab control.
Apoptosis induction
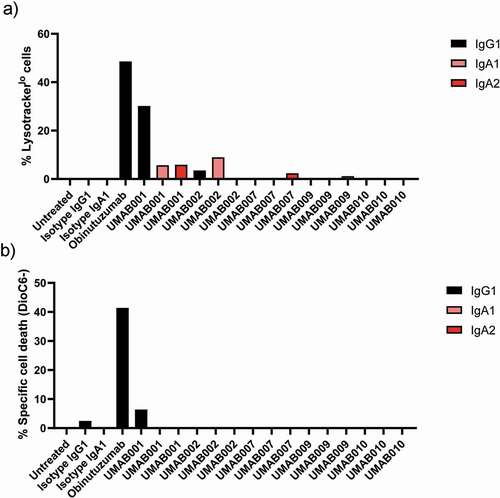
Previously we have shown that after chimerization of UMAB001 to human IgG1, the antibody acquired the ability to induce homotypic aggregation and apoptosis, while retaining type I antibody characteristics.Citation7 Here, we evaluated the ability of the whole panel of chimerized antibodies as IgG1, IgA1 and IgA2 to induce apoptosis and lysosomal cell death. Interestingly, only IgG1 UMAB001 showed a significant amount of lysosomal cell death induction, while IgA variants with the same variable region induced a significantly lower amount of lysosomal cell death, as was assessed by lysotracker staining (). In addition, we also observed loss of mitochondrial membrane potential, indicative for apoptosis (). Obinutuzumab induced more direct cell death in comparison to IgG1 UMAB001.
Figure 4. Apoptosis induction by CD20 antibodies. Apoptosis induction on Ramos cells by CD20 antibodies at 10 µg/ml. After 6 h of incubation time at 37°C, cells were stained with (a) lysotracker red or (b) DioC6 and analyzed by flow cytometry. Results are shown of a single experiment.
CD20 antibodies of the IgA isotype activate the complement system via the classical pathway
Next, complement activation by these CD20 antibodies was investigated against Ramos cells. As expected, IgG antibodies efficiently performed cell lysis within 15 minutes incubation with human serum, while no to low amounts of lysis could be observed by IgA antibodies (). However, when the incubation time was increased, lysis mediated by IgA antibodies substantially increased for all tested antibodies. IgG1 antibodies reached maximal lysis after 15 minutes, while IgA antibodies reached maximal lysis after 4 h. At the highest tested antibody concentration, IgG antibodies induced significantly more lysis in comparison to IgA antibodies with the same variable regions. IgA1 and IgA2 antibodies did not differ significantly in CDC induction at this concentration (). At lower concentrations, IgA2 antibodies induced more lysis in comparison to IgA1 antibodies (). Since IgA antibodies do not contain a C1q binding site, we assessed which complement pathway is responsible for complement-mediated lysis by IgA antibodies. Through the use of C1q-depleted serum, the contribution of the classical pathway was studied. Interestingly, lack of C1q completely inhibited CDC by IgA and IgG1 antibodies. Supplementing recombinant C1q to the depleted serum restored CDC for both IgA and IgG antibodies, indicating that both isotypes require the classical complement pathway for CDC ().
Figure 5. IgA antibodies activate the complement system via the classical pathway. (a) FACS-based CDC assay against Ramos cells by isotype variants of CD20 UMAB002 antibodies at 10 µg/ml at indicated timepoints at 37°C. (b) FACS-based CDC assay against Ramos cells by IgA CD20 antibodies at 10 µg/ml for 4 h at 37°C. Asterisks indicate a significant difference with IgG antibodies with the same variable region. (c) CDC assay against Ramos cells by IgA CD20 antibodies at 10 µg/ml in presence or absence of C1q for 4 h at 37°C. One representative graph is shown for at least n = 3 independent experiments.
As expected, inhibition of all complement activity by ethylenediaminetetraacetic acid (EDTA) or heat inactivation of serum showed that both IgA and IgG require a functional complement system to achieve lysis with serum (). All tested isotypes mediate lysis through the terminal complement pathway, as pretreatment of serum with the C5 inhibitor eculizumab completely inhibited CDC (). By inhibiting all except the alternative pathway through treatment of serum with MgEGTA, we showed that the alternative pathway does not play a role in IgA and IgG-mediated complement activation ().
Previously, it was described that binding of CD20 by type I antibodies lacking a C1q binding site can indirectly initiate complement activation through formation of a lipid raft on the membrane containing the B cell receptor (BCR) of the IgM or IgG subclass. Since these BCRs do contain a C1q binding site, it was suggested that this clustering can form a platform with enough avidity for C1q binding, and, therefore, complement activation.Citation11 To assess whether the BCR was important for IgA-mediated complement activation, the BCR was knocked-out in Ramos cells via CRISPR/Cas9 to further investigate this. As described previously, knock-out of the BCR did not significantly influence CDC by non-C1q binding antibodies.Citation12 This also held true for all tested IgA antibodies ().
IgA antibodies show tumor kill and B cell depletion in vivo
To compare the efficacy of these antibodies in vivo, C57BL/6 mice either expressing the human FcαR (CD89) or not were intraperitoneally (IP) injected with EL4 cells expressing human CD20, and, after 24 hours, 100 µg of antibodies was injected at the same site. After 24 hours of therapy, peritoneal lavage was performed to gather the remaining EL4 cells. Over this short period, all injected antibodies reduced tumor cells to a similar extend () in the model.
Figure 6. In vivo efficacy of CD20 antibodies. (a) EL4-CD20 intraperitoneal model. CD89 Tg and NTg C57bl/6 j mice were injected IP with EL4-CD20 cells and 16 h later were treated with 100 µg of CD20 antibodies or phosphate-buffered saline (PBS). After 24 h, the number of tumor cells in the peritoneal wash was determined by flow cytometry via TrueCount tubes (4–12 mice per group, data of two pooled independent experiments are shown). Asterisks indicate a statistically significant difference compared to the PBS-treated group. (b) CD89 Tg and NTg C57bl/6 j mice were i.v. injected with huCD20+ and CD20- murine splenocytes labeled with a with either a high or low concentration of CellTrace Violet. After 24 h, mice were injected intravenously with 37.5 µg of IgG1 or 150 µg of IgA antibodies to correct for differences in half-life. After 16 h, spleens were isolated and the ratio of huCD20+ and huCD20- murine B220+ splenocytes was determined by flow cytometric analysis. Asterisks indicate statistically significant differences compared to the PBS-treated group.
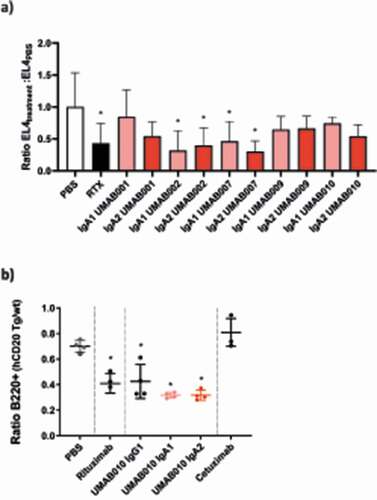
In a second in vivo model, B cell depletion by UMAB010 IgA1, IgA2 and IgG1 antibodies was investigated. Here, CD89 transgenic (Tg) mice were injected with a mix of CellTrace Violet (CTV)-labeled splenocytes from huCD20 Tg and huCD20 NTg mice. Mice were injected with 37.5 µg of IgG1 or 150 µg of IgA antibodies. In this model, all tested CD20 antibodies significantly decreased the number of CD20-expressing B cells. Taken together, these results signify the use of IgA as an antibody isotype for CD20-expressing B cell malignancies.
Discussion
Here, we have shown that conversion of human IgG1 antibodies against CD20 to the human IgA isotype enhances neutrophil-mediated killing of B cells and elicits CDC. Additionally, CD20 antibodies of the IgA isotype showed efficacy in two different mouse models in vivo. These data support the concept that monoclonal antibodies of the IgA isotype could be a treatment option for CD20-expressing lymphomas.
However, the clinical application of IgA is hindered by several factors. First, IgA1 and IgA2 antibodies contain more N-glycosylation sites compared to the IgG1 isotype. This complexity is a well-recognized issue for protein-based therapeutics because it contributes to drug heterogeneity. Furthermore, the high amount of N-glycosylation negatively influences in vivo half-life in mice through interaction with the asialoglycoprotein receptor in the liver.Citation13,Citation14 Therefore, half-life of IgA is relatively short in comparison to IgG1. Although the half-life of IgA in humans is 6 d, in mice a half-life of approximately 1 d is observed.
Heterogeneity in protein glycosylation influences the function, pharmacokinetics and safety of biological therapeutics, and it is therefore a critical attribute.Citation15 Because IgA1 contains 2 N-glycosylation sites per heavy chain, the number of different glycans found was more diverse in comparison to IgG1, although heterogeneity remained limited between antibodies. IgA2 antibodies incorporate five distinct N-glycosylation sites on each heavy chain, but has the advantage over IgA1 that it is not O-glycosylated and is not associated with development of IgA nephropathy. The two different antibodies of the IgA2 isotype analyzed in this study differed in their N-glycosylation pattern. However, more antibodies, stable cell line development, and testing of different batches is required to get a clearer image regarding this important drug property.
To investigate the B-cell depleting capacity of IgA CD20 antibodies, we used both51-Cr-release assays and a flow cytometric approach. Using the latter method, we were able to determine B-cell loss in an autologous setting with whole blood leukocytes. At first, we noticed a reduction of CD19 levels after addition of antibody to these cells. This observation is reminiscent of the shaving effect described for CD20, attributed to Fc receptor-mediated trogocytosis after CD20 antibody exposure to target cells.51-Cr-release assays and a flow cytometric approach. Using the latter method, we were able to determine B-cell loss in an autologous setting with whole blood leukocytes. At first, we noticed a reduction of CD19 levels after addition of antibody to these cells. This observation is reminiscent of the shaving effect described for CD20, attributed to Fc receptor-mediated trogocytosis after CD20 antibody exposure to target cells.Citation16 This led us to believe that CD19 might also be concomitantly removed from B cells as CD19 resides in the same protein-membrane domains at the cell surface.Citation17,Citation18 Considering this, we included CD24 as an additional B cell marker in our analysis, which is, to our knowledge, not associated with the aforementioned CD20 protein-membrane domain and was not affected by CD20 antibody treatment in the presence of leukocytes. In agreement with published data concerning rituximab-mediated CD19 loss, we observed that both IgG and IgA CD20 antibodies dramatically reduced CD19.Citation10 These experiments demonstrated that in this context, only CD20 antibodies of the IgA isotype were capable of reducing B cell numbers. Macrophages, and in particular neutrophils, have recently been indicated to exert ADCC by a trogocytosis-based mechanism called trogoptosis.Citation19,Citation20 This cell-death inducing mechanism by neutrophils is profoundly more effective when mediated by the IgA isotype, and can be attributed to a strong triggering of CD89 present on neutrophils.Citation8,Citation21 Strikingly, we did not observe IgG-mediated B cell reduction with whole blood leukocytes as effector cells, although CD20 IgG1 antibodies have shown clear clinical benefit. One possible explanation could be that IgG-mediated trogocytosis of CD20 by the vast numbers of neutrophils in blood does not reflect the tumor microenvironment in patients. Nevertheless, CD19 is still often used as a marker for B cell depletion. Based on our experience and results, we strongly encourage reevaluation of the use of CD19 as the only biomarker for assessment of CD20 therapeutics.
When we tested complement activation of the novel chimerized antibodies, the same order of efficacy was observed as with mouse antibodies. As shown before, UMAB001, UMAB007 and UMAB009 elicited a high degree of complement activation while UMAB002 showed this to a lower extent.Citation7 The same order was also observed between the IgA antibodies, indicating that the variable region strongly dictates the ability to perform CDC. Interestingly, although both the IgA1 and IgA2 Fc tail lack a C1q binding site, all IgA antibodies could perform CDC against CD20-expressing cell lines. Previously, it was reported that CD20 antibodies lacking a C1q binding site could activate the classical complement pathway, through indirect clustering of the BCR.Citation11 Although it was shown that the BCR could evoke this, other molecules present within the CD20 lipid raft are likely to show this as well, since the same effects could be obtained after knock-out of this receptor.Citation12 We hypothesize that other molecules present within the CD20 lipid raft containing a C1q binding site also are able to bind C1q after clustering. Likely candidate molecules able to bind C1q on B cells are CD21, CD35, CD93 and the gC1qR. Nevertheless, it is questionable how relevant IgA-mediated CDC will be in patients, since even strong CDC-inducing antibodies such as ofatumumab do not show a clear clinical benefit over rituximab or obinutuzumab for CLL or DLBCL patients.Citation22,Citation23
Although this panel of antibodies showed both differences between isotypes and between variable regions in vitro, the short IP model did not show substantial differences in tumor cell killing between the antibody groups. This model showed a rather large variation within a treatment group, perhaps because of the site of injection. The intraperitoneal cavity is often used as an injection site for in vivo tumor models, but cells can adhere easily in this site, which can influence the recovery after peritoneal lavage. Therefore, the model might not be ideal for comparison of a panel of antibodies. This variation is not inherent to the therapeutic antibody, since, in a second adoptive transfer model, inter-treatment variation could be reduced. To improve the short IP model for future experiments, we propose to include a reference population of cells, as was done for the adoptive transfer model. That way, a ratio, instead of an absolute number of cells, can be determined.
To conclude, we showed that chimerization of a panel of five novel antibodies to the IgA isotype showed an interesting repertoire of effector mechanisms: strong activation of PMN together with low, but still significant, complement activation. In the future, it will be especially important to evaluate whether this combination of effector mechanisms can be beneficial in the refractory/relapsed setting for CD20-expressing malignancies.
Materials and methods
Cell lines
All cell lines were cultured in RPMI culture medium supplemented with HEPES, glutamax, 10% fetal calf serum, 100 U/mL penicillin-streptomycin (Gibco, Life Technologies) at 37°C in a humidified incubator containing 5% CO2. HEK293F cells were cultured in FreeStyle 293 expression medium at 37°C in a humidified incubator with orbital shaker platform containing 8% CO2.
Antibodies
Antibodies were produced and purified as previously described.Citation13 Briefly, variable heavy chain sequences coding for IgA1, IgA2(m1) or IgG1 and the variable kappa light chain sequence were separately cloned into a Lonza expression vector (pEE14.4). Monomeric antibodies were produced by transient transfection of HEK293F cells with vectors coding for the heavy chain, light chain and pAdvantage (accession number U47294; Promega), using 293 Fectin transfection reagent according to the manufacturer’s instructions. IgG1 antibodies were purified using protein A columns (Hi-trap protein A) coupled to an ÄKTAprime plus chromatography system (GE Lifesciences). Bound antibody was eluted with 0.1 M sodium acetate pH 2.5 and neutralized with 1 M TRIS-HCl pH 8.8. The eluate was dialyzed against phosphate-buffered saline (PBS). IgA antibodies were purified using kappa light chain affinity chromatography columns (Hi-trap kappaSelect, GE healthcare) and eluted with 0.1 M glycine buffer pH 2.5. The eluate was applied on a SEC column ran with PBS as mobile phase. The fractions containing monomeric IgA were collected and concentrated with a 100 kDa spin column (Vivaspin 20, GE Healthcare). All antibodies were filtered over 0.22 µm filters.
Binding assays
1x10⁵ cells were plated out in 96-well plates, washed and incubated with antibody at several concentrations for 45 minutes on ice. Next, cells were washed and stained by a secondary phycoerythrin-conjugated anti-IgA or IgG antibody (Southern Biotech #2042-09, #2052-09). Finally, cells were washed and resuspended in PBS. The amount of bound antibody to the cells was determined by flow cytometry (BD FacsCanto II). Results were displayed as % maximal binding (MFI/MFImax)x 100%.
Mass spectrometric glycan analysis
Chemicals and reagents used for mass spectrometry (MS) were as follows: high purity water (MQ) was generated using a Q-Gard 2 system (Millipore, Amsterdam, Netherlands), maintained at ≥18 MΩ. Ethanol, trifluoroacetic acid (TFA), sodium dodecyl sulfate (SDS), Na2HPO4 x 2H2O, KH2PO4 and NaCl were purchased from Merck (Darmstadt, Germany). Nonidet P-40 substitute (NP-40), 1-hydroxybenzotriazole (HOBt), super-DHB and 50% NaOH originated from Sigma-Aldrich (Steinheim, Germany), while 1-ethyl-3-(3-dimethylaminopropyl)carbodiimide (EDC) hydrochloride was bought from Fluorochem (Hadfield, U.K.), peptide-N-glycosidase F (PNGase F) from Roche Diagnostics (Mannheim, Germany), and HPLC SupraGradient acetonitrile (ACN) from Biosolve (Valkenswaard, Netherlands).
Antibody glycans were prepared for mass spectrometric analysis by enzymatic release and chemical derivatization as reported previously.Citation24,Citation25 Briefly, 20 µL 2% SDS was added to 10 µL antibody sample, followed by 10 min incubation at 60°C. After letting the samples cool to room temperature, 20 µL release mix was added containing 2% NP-40 and 2.5 mU PNGase F in 2.5x PBS (14.25 g/L Na2HPO4 x 2H2O, 1.25 g/L KH2PO4 and 21.25 g/L NaCl), followed by overnight incubation at 37°C. Next, 5 µL of the release mixtures was derivatized by adding 35 µL 0.25 M EDC + 0.25 M HOBt in ethanol and incubating for 1 h at 37°C, resulting in lactones for α2,3-linked sialic acids and ethyl esters for α2,6-linked sialic acids.Citation24,Citation25 40 µL ACN was subsequently added to prepare for glycan enrichment. The glycans were recovered from the reaction mixture by hydrophilic interaction liquid chromatography (HILIC) solid phase extraction (SPE), using cotton as stationary phase.Citation26 For this, 200 µL pipette tips were packed with 200 µg cotton, washed three times with 100 µL MQ, and three times with 100 µL 85% ACN. Next, the glycans were loaded by pipetting the samples up and down 30 times, followed by three washes with 100 µL 85% ACN 1% TFA, another three washed with 100 µL 85% ACN, and eluted in 10 µL MQ.
One microliter of the eluted samples was spotted on an MTP AnchorChip 600/384 TF target (Bruker Daltonics, Bremen, Germany), and mixed on-plate with 1 µL 5 mg/mL super-DHB 1 mM NaOH in 50% ACN. Matrix-assisted laser desorption/ionization (MALDI)-time-of-flight (TOF)-MS was carried out using reflectron positive ion mode of an UltraFlextreme system (Bruker Daltonics) controlled by flexControl 3.4 Build 135 (Bruker Daltonics). The instrument was calibrated before measurement using a peptide calibration standard (Bruker Daltonics). Laser power was set as high as possible to still allow baseline separation of isotopic peaks. Sample spectra were acquired by summing 10000 laser shots in a random walking pattern, at a frequency of 1000 Hz, and using a window from m/z 1000 to 5000 with suppression up to m/z 950.
Antibody-dependent cell-mediated cytotoxicity assays
ADCC assays were performed as described previously.Citation27 In short, target cells were labeled with 3.7 MBq5Cr (PerkinElmer) per 1 × 10⁶ cells in PBS for 2 hours. Afterward, cells were washed three times to remove excess chromium. Blood for ADCC assays was obtained from healthy donors at the UMC Utrecht (Medical ethical approval protocol 07−125/O). For leukocyte isolation, blood was incubated in water for 30 seconds to lyse erythrocytes. Afterward, 10x PBS was added to reach physiological osmolality. Cells were washed and resuspended in medium corresponding to the original blood volume. For PMN and peripheral blood mononuclear cell (PBMC) isolation, blood was added on top of a Ficoll (GE Healthcare)/Histopaque 1119 (Sigma) layer and centrifuged for 20 minutes at 1500 RPM. Afterward, PBMCs and PMNs were collected from the interphase between serum and Ficoll or in the Histopaque layer, respectively. For ADCC using primary human B cells as targets, magnetic activated cell sorting was performed to isolate healthy B cells (B-cell isolation kit II, Miltenyi) or malignant B cells (B-CLL isolation kit, Miltenyi) from the PBMC fraction. Isolated malignant B cells were cryo-preserved and thawed immediately before use. The effector-to-target (E:T) ratios were 100:1 for PBMCs and 40:1 for PMNs, unless stated otherwise. Effector cells, antibodies and tumor cells were added to round-bottom microtiter plates (Corning Incorporated) and incubated for 4 hours at 37°C in a humidified incubator containing 5% CO2. For ADCC assays with healthy primary B cells as targets, autologous plasma was used for the incubation medium. Plates were centrifuged for 2 minutes at 1500 RPM and 50 µL of the supernatant was transferred to Lumaplates (PerkinElmer). Radioactive scintillation (in cpm) was quantified in a beta-gamma counter (PerkinElmer). Specific lysis was calculated using following the formula: ((experimental cpm – basal cpm)/(maximal cpm – basal cpm)) x 100, with maximal lysis determined by incubating labeled cells with 1.25% triton and minimal lysis in the absence of antibodies and effector cells.
B-cell depletion assays
For monitoring the level of B-cell depletion by CD20 antibodies in an autologous setting, whole blood leukocytes (WBLs) from blood of healthy donors were separated from the erythrocyte bulk by Ficoll/Histopaque block gradient centrifugation as described for the ADCC assay above. This was followed by an ammonium buffer (155 mM NH4 Cl, 10 mM KHCO3, 0.037 mg/mL Na2EDTA, pH 7.4) based erythrocyte lysis procedure. WBLs were then added to and mixed in 96-well V-bottom plates (0.2–0.4x10⁶ cells per well) containing the desired antibodies in a total volume of 50 µL medium per well in a triplicate setup and incubated for 3–4 hours at 37°C. After this, WBLs were washed and stained for CD19-APC (Biolegend, clone HIB19, # 302212), CD11b-PE (BD, clone D12, # 347557), CD3-PerCp (BD, clone UCHT1, # 560835), CD56-AF488 (BD, clone B159, # 561905), CD14-V500 (BD, cloneM5E2, #561391), CD24-BV421 (Biolegend, clone ML5, #311122) and quantitatively analyzed by flow cytometry by measuring a fixed volume of cell suspension for each well (FACScanto II HTS setup, BD biosciences). B cells were defined as CD3−/CD56−/CD14−/CD24+/CD19hi-lo cells.
CDC assays
105 lymphoma cells were added per well to 96-well microtiter plates and incubated for 30 minutes with antibodies at various concentrations at room temperature. Afterward, pooled human serum (from 8 different healthy donors), or C1q-depleted serum (Complement technologies) was added to a final concentration of 15% and incubated for 15 min, 1 h or 4 h. When indicated, C1q was supplemented to 60 µg/mL, pooled serum was treated with 10 mM EDTA (Sigma Aldrich), 10 mM EGTA and 2 mM MgCl2 (Sigma Aldrich), 40 µg/mL eculizumab or heat inactivated for 30 minutes at 56°C. Afterward, cells were washed and stained with 7-AAD (BD Pharmingen) for 15 minutes. 7-AAD uptake was quantified by flow cytometry (FACScanto II, BD biosciences).
Direct cell death induction assays
To analyze direct Fab-mediated cell death of lymphoma cells, 1 × 10⁵ target cells were incubated with CD20 antibodies (all at 10 μg/ml) at 37°C and 5% CO2. To quantify lysosomal cell death or apoptosis, target cells were incubated with CD20 antibodies at 10 µg/ml at 37°C and 5% CO2. After 5 hours of incubation, lysotracker red (Invitrogen) was added for 1 h at 50 nM to determine lysosomal cell death or cells were treated after 6 h with 10 nM of DiOC6 (Thermo Fisher), and TO-PRO-3 (Thermo Fisher), following the manufacturer’s instructions. Afterward, cells were washed and analyzed by flow-cytometry (BD LSRFortessa).
In vivo experiments
Mice were maintained in the animal facility of the University of Utrecht. Experiments were conducted using both male and female C57Bl/6JRj mice (Janvier). Mice were housed in groups under a 12:12 light–dark cycle, with food and water available ad libitum. Mice were acclimatized for at least 1 week prior to the start of experiment. Sample sizes were calculated with power analysis at the time of the design of experiments.
All experiments were performed in accordance with international guidelines and approved by the national Central Authority for Scientific Procedures on Animals (CCD) and the local experimental animal welfare body (AVD115002016410).
Short IP model
In vivo evaluation was performed using the EL4-CD20 low tumor-burden model as previously described.Citation29 C57BL/6 mice were purchased from Janvier (Le Genest-Saint-Isle, France) or bred in our facilities. 4–12 mice/group were IP injected with 5 × 10⁶ CellTraceViolet (1 µM, Invitrogen)-labeled EL4-CD20 cells. After 16 hours, mice were treated with 100 µg antibody or PBS (100 µL) injected IP. A peritoneal lavage with PBS containing 5 mmol/L EDTA was performed after 24 hours and the amount of remaining tumor cells was determined using TruCount tubes (BD). To compare the complete panel of antibodies, data were pooled from two separate in vivo experiments.
Adoptive transfer in vivo model
hCD20 transgenic mice have been described previously and were provided by the University of Southampton.Citation29 Mice were backcrossed with hCD89 Tg on a C57BL/6 background in our facilities. Mice were injected subcutaneously with 20 µg PEG-G-CSF. After 4 d, we sacrificed a CD20 Tg and Non-Tg C57BL/6 mouse and harvested splenocytes by mechanical dissociation of the spleen. Splenocytes were labeled with 0.5 or 5 µM of CellTrace Violet for 20 minutes, mixed in a 1:1 ratio and injected intravenously (i.v.) in CD89 Tg or CD89 NTg mice. After 24 hours, mice were i.v. injected with 250 µg of antibody. After 16 hours, mice were sacrificed and splenocytes were harvested and analyzed by flow cytometry. Injected B cells were identified based on CellTrace Violet+, B220+ (Biolegend, clone RA3-6B2, #103222) labeling.
CRISPR/Cas9 of IGMH
Knock-out (KO) of the BCR on Ramos cells was performed by CRISPR/Cas9 guided targeting of the Immunoglobulin Heavy Constant Mu gene (IGMH). In short, a single guide RNA (sgRNA, TCCGACGGGGAATTCTCAC) targeting IGMH was introduced in the lentiviral pSicoR-CRISPR-PuroR vector and target cells were subsequently transduced with lentiviral particles and selected using puromycin treatment (1 µg/ml).Citation30 Flow cytometric analysis after 14 d demonstrated loss of membranous IgM expression from the majority of cells. To obtain a population of pure BCR KO cells, cells that were left unstained by an anti-IgM monoclonal antibody (BD, Clone G20-127, #562618) were sorted by FACS (FACSAria II, BD).
Data processing and statistical analysis
Statistical analyses were performed in GraphPad prism 8.3 software (GraphPad). Data are represented as mean ± SD. For comparing mean values of two groups, unpaired two-tailed Student’s T-tests were performed. For multiple comparisons, two-tailed one-way ANOVA was performed with Tukey’s range test. Dose–response curves for ADCC experiments were calculated via non-linear regression. Asterisks were used to indicate statistical significance (p < .05).
Disclosure of Potential Conflicts of Interest
JHWL is co-founder of TigaTx.
Supplemental Material
Download Zip (6.3 MB)Acknowledgments
We would like to thank the group of Stephen Beers/Mark Cragg at the university of Southampton for providing huCD20 Tg mice.
Supplementary material
Supplemental data for this article can be accessed here
Additional information
Funding
References
- Marshall MJE, Stopforth RJ, Cragg MS. Therapeutic antibodies: what have we learnt from targeting CD20 and where are we going? Front Immunol. 2017;8:1245. doi:https://doi.org/10.3389/fimmu.2017.01245.
- Mossner E, Brünker P, Moser S, Püntener U, Schmidt C, Herter S, Grau R, Gerdes C, Nopora A, van Puijenbroek E, et al. Increasing the efficacy of CD20 antibody therapy through the engineering of a new type II anti-CD20 antibody with enhanced direct and immune effector cell–mediated B-cell cytotoxicity. Blood. 2010;115(22):4393–10. doi:https://doi.org/10.1182/blood-2009-06-225979.
- Cunningham D, Hawkes EA, Jack A, Qian W, Smith P, Mouncey P, Pocock C, Ardeshna KM, Radford JA, McMillan A, et al. Rituximab plus cyclophosphamide, doxorubicin, vincristine, and prednisolone in patients with newly diagnosed diffuse large B-cell non-Hodgkin lymphoma: a phase 3 comparison of dose intensification with 14-day versus 21-day cycles. Lancet. 2013;381(9880):1817–26. doi:https://doi.org/10.1016/S0140-6736(13)60313-X.
- Vitolo U, Trněný M, Belada D, Burke JM, Carella AM, Chua N, Abrisqueta P, Demeter J, Flinn I, Hong X, et al. Obinutuzumab or rituximab plus cyclophosphamide, doxorubicin, vincristine, and prednisone in previously untreated diffuse large B-Cell Lymphoma. J Clin Oncol. 2017;35(31):3529–37. doi:https://doi.org/10.1200/JCO.2017.73.3402.
- Wilson WH, Jung S-H, Porcu P, Hurd D, Johnson J, Martin SE, Czuczman M, Lai R, Said J, Chadburn A, et al. A cancer and leukemia group B multi-center study of DA-EPOCH-rituximab in untreated diffuse large B-cell lymphoma with analysis of outcome by molecular subtype. Haematologica. 2012;97(5):758–65. doi:https://doi.org/10.3324/haematol.2011.056531.
- Evers M, Jak M, Leusen JHW. The latest developments with anti-CD20 monoclonal antibodies in chronic lymphocytic leukemia. Expert Opin Biol Ther. 2018;18(9):973–82. doi:https://doi.org/10.1080/14712598.2018.1508444.
- Meyer S, Evers M, Jansen JHM, Buijs J, Broek B, Reitsma SE, Moerer P, Amini M, Kretschmer A, Ten Broeke T, et al. New insights in Type I and II CD20 antibody mechanisms-of-action with a panel of novel CD20 antibodies. Br J Haematol. 2018;180(6):808–20. doi:https://doi.org/10.1111/bjh.15132.
- Brandsma AM, Bondza S, Evers M, Koutstaal R, Nederend M, Jansen JHM, Rösner T, Valerius T, Leusen JHW, Ten Broeke T, et al. Potent Fc receptor signaling by IgA leads to superior killing of cancer cells by neutrophils compared to IgG. Front Immunol. 2019;10:704. doi:https://doi.org/10.3389/fimmu.2019.00704.
- Lohse S, Brunke C, Derer S, Peipp M, Boross P, Kellner C, Beyer T, Dechant M, van der Winkel JGJ, Leusen JHW, et al. Characterization of a mutated IgA2 antibody of the m(1) allotype against the epidermal growth factor receptor for the recruitment of monocytes and macrophages. J Biol Chem. 2012;287(30):25139–50. doi:https://doi.org/10.1074/jbc.M112.353060.
- Valgardsdottir R, Cattaneo I, Klein C, Introna M, Figliuzzi M, Golay J. Human neutrophils mediate trogocytosis rather than phagocytosis of CLL B cells opsonized with anti-CD20 antibodies. Blood. 2017;129(19):2636–44. doi:https://doi.org/10.1182/blood-2016-08-735605.
- Engelberts PJ, Voorhorst M, Schuurman J, van Meerten T, Bakker JM, Vink T, Mackus WJM, Breij ECW, Derer S, Valerius T, et al. Type I CD20 antibodies recruit the B cell receptor for complement-dependent lysis of malignant B cells. J Immunol. 2016;197(12):4829–37. doi:https://doi.org/10.4049/jimmunol.1600811.
- Evers M, Kruse E, Hamdan F, Lebbink R-J, Leusen JHW. Comment on “Type I CD20 antibodies recruit the B cell receptor for complement-dependent lysis of malignant B cells”. J Immunol. 2018;200(8):2515–16. doi:https://doi.org/10.4049/jimmunol.1800087.
- Meyer S, Nederend M, Jansen JHM, Reiding KR, Jacobino SR, Meeldijk J, Bovenschen N, Wuhrer M, Valerius T, Ubink R, et al. Improved in vivo anti-tumor effects of IgA-Her2 antibodies through half-life extension and serum exposure enhancement by FcRn targeting. MAbs. 2016;8(1):87–98. doi:https://doi.org/10.1080/19420862.2015.1106658.
- Lohse S, Meyer S, Meulenbroek LAPM, Jansen JHM, Nederend M, Kretschmer A, Klausz K, Möginger U, Derer S, Rösner T, et al. An anti-EGFR IgA that displays improved pharmacokinetics and myeloid effector cell engagement in vivo. Cancer Res. 2016;76(2):403–17. doi:https://doi.org/10.1158/0008-5472.CAN-15-1232.
- Jefferis R. Glycosylation as a strategy to improve antibody-based therapeutics. Nat Rev Drug Discov. 2009;8(3):226–34. doi:https://doi.org/10.1038/nrd2804.
- Beum PV, Peek EM, Lindorfer MA, Beurskens FJ, Engelberts PJ, Parren PWHI, van de Winkel JGJ, Taylor RP. Loss of CD20 and bound CD20 antibody from opsonized B cells occurs more rapidly because of trogocytosis mediated by Fc receptor-expressing effector cells than direct internalization by the B cells. J Immunol. 2011;187(6):3438–47. doi:https://doi.org/10.4049/jimmunol.1101189.
- Jones JD, Hamilton BJ, Rigby WF. Rituximab mediates loss of CD19 on B cells in the absence of cell death. Arthritis Rheum. 2012;64(10):3111–18. doi:https://doi.org/10.1002/art.34560.
- Rossi EA, Goldenberg DM, Michel R, Rossi DL, Wallace DJ, Chang C-H. Trogocytosis of multiple B-cell surface markers by CD22 targeting with epratuzumab. Blood. 2013;122(17):3020–29. doi:https://doi.org/10.1182/blood-2012-12-473744.
- Matlung HL, Babes L, Zhao XW, van Houdt M, Treffers LW, van Rees DJ, Franke K, Schornagel K, Verkuijlen P, Janssen H, et al. Neutrophils kill antibody-opsonized cancer cells by trogoptosis. Cell Rep. 2018;23(13):3946–59. e6. doi:https://doi.org/10.1016/j.celrep.2018.05.082.
- Velmurugan R, Challa DK, Ram S, Ober RJ, Ward ES. Macrophage-mediated trogocytosis leads to death of antibody-opsonized tumor cells. Mol Cancer Ther. 2016;15(8):1879–89. doi:https://doi.org/10.1158/1535-7163.MCT-15-0335.
- Treffers LW, Ten Broeke T, Rösner T, Jansen JHM, van Houdt M, Kahle S, Schornagel K, Verkuijlen PJJH, Prins JM, Franke K, et al. IgA-mediated killing of tumor cells by neutrophils is enhanced by CD47-sirpalpha checkpoint inhibition. Cancer Immunol Res. 2020;8(1):120–30. doi:https://doi.org/10.1158/2326-6066.CIR-19-0144.
- van Imhoff GW, McMillan A, Matasar MJ, Radford J, Ardeshna KM, Kuliczkowski K, Kim W, Hong X, Goerloev JS, Davies A, et al. Ofatumumab versus rituximab salvage chemoimmunotherapy in relapsed or refractory diffuse large B-cell lymphoma: the ORCHARRD study. J Clin Oncol. 2017;35(5):544–51. doi:https://doi.org/10.1200/JCO.2016.69.0198.
- Sandhu S, Mulligan SP. Ofatumumab and its role as immunotherapy in chronic lymphocytic leukemia. Haematologica. 2015;100(4):411–14. doi:https://doi.org/10.3324/haematol.2015.124107.
- Reiding KR, Lonardi E, Ederveen ALH, Wuhrer M. Ethyl esterification for MALDI-MS analysis of protein glycosylation. Methods Mol Biol. 2016;1394:151–62.
- Reiding KR, Blank D, Kuijper DM, Deelder AM, Wuhrer M. High-throughput profiling of protein N-glycosylation by MALDI-TOF-MS employing linkage-specific sialic acid esterification. Anal Chem. 2014;86(12):5784–93. doi:https://doi.org/10.1021/ac500335t.
- Selman MH, Hemayatkar M, Deelder AM, Wuhrer M. Cotton HILIC SPE microtips for microscale purification and enrichment of glycans and glycopeptides. Anal Chem. 2011;83(7):2492–99. doi:https://doi.org/10.1021/ac1027116.
- Brandsma AM, Ten Broeke T, Nederend M, Meulenbroek LAPM, van Tetering G, Meyer S, Jansen JHM, Beltran Buitrago MA, Nagelkerke SQ, Nemeth I, et al. Simultaneous targeting of FcgammaRs and FcalphaRI enhances tumor cell killing. Cancer Immunol Res. 2015;3(12):1316–24. doi:https://doi.org/10.1158/2326-6066.CIR-15-0099-T.
- Boross P, Jansen JHM, de Haij S, Beurskens FJ, van der Poel CE, Bevaart L, Nederend M, Golay J, van de Winkel JGJ, Parren PWHI, et al. The in vivo mechanism of action of CD20 monoclonal antibodies depends on local tumor burden. Haematologica. 2011;96(12):1822–30. doi:https://doi.org/10.3324/haematol.2011.047159.
- Ahuja A, Shupe J, Dunn R, Kashgarian M, Kehry MR, Shlomchik MJ. Depletion of B cells in murine lupus: efficacy and resistance. J Immunol. 2007;179(5):3351–61. doi:https://doi.org/10.4049/jimmunol.179.5.3351.
- van Diemen FR, Kruse EM, Hooykaas MJG, Bruggeling CE, Schürch AC, van Ham PM, Imhof SM, Nijhuis M, Wiertz EJHJ, Lebbink RJ, et al. CRISPR/Cas9-mediated genome editing of herpesviruses limits productive and latent infections. PLoS Pathog. 2016;12(6):e1005701. doi:https://doi.org/10.1371/journal.ppat.1005701.