
ABSTRACT
SERINC5 is a multi-pass transmembrane protein that is thought to play a role in serine incorporation during cellular membrane biosynthesis. This protein has also been identified as a human immunodeficiency virus Type 1 (HIV-1) restriction factor. The paucity of monoclonal antibodies (mAbs) against SERINC5 has posed a challenge for the study of the endogenous protein. Here we report the development of novel anti-SERINC5 mAbs that target three distinct loops on the protein. We demonstrate that these SERINC5 mAbs can be used to detect endogenously expressed SERINC5 protein in various cell lines using Western blot, whole-cell ELISA, flow cytometry, and immunocytochemistry. We further show that some of these antibodies can detect SERINC5 that is present in HIV-1 viral stocks. These antibodies will aid in the characterization of the functions and mechanisms of action of SERINC5 in different cell types.
Introduction
The serine incorporator (SERINC) protein family has five members (SERINC1 through SERINC5) that localize to cell membranes. The suggested function of SERINCs is to incorporate a polar amino acid (serine) into the hydrophobic environment of lipid bilayers.Citation1 In 1996, Krueger et al. reported the enrichment of TPO1 mRNA, now known as SERINC5, in immature oligodendrocytes isolated from rat brain, indicating a role in membrane biogenesis and myelinogenesis.Citation2 Jian et al. reported the expression patterns of SERINC5 mRNA in 16 human adult tissues, revealing that SERINC5 is highly expressed in the placenta, skeletal muscle, spleen, thymus, testes and peripheral leukocytes.Citation3
Krueger et al. predicted that SERINC5 has 11 transmembrane domains, N-terminal cysteine-rich zinc-finger-like motifs and a strongly hydrophobic character, indicating a close association with membrane structure.Citation1,Citation2 However, using cryo-EM, the structural organization of SERINC5 was recently shown to consist of 10 transmembrane helices that are organized into two subdomains (A and B) that are bisected by a long diagonal helix.Citation4 This complex structure potentially complicates the detection of SERINC5 at the cell surface.
In addition, SERINC3 and more potently, SERINC5, are now known to effectively restrict HIV-1 infection; the HIV-1 Nef regulatory protein counteracts this restrictionCitation5,Citation6 and redirects SERINC5 to endosomal compartments,Citation7 thereby reducing its presence at the plasma membrane.Citation8 Of the five alternatively spliced isoforms of SERINC5, isoform 1 (SERINC5.1) is the longest species and is predominately localized in the plasma membrane; this isoform has also been shown to play a significant role in HIV-1 restriction.Citation9 Additionally, it has been reported that SERINC5.1 is incorporated into HIV-1 particles, and the region containing ECL3-TM6-ICL3-TM7-ECL4 is specifically required for virion incorporation and restriction activity.Citation4,Citation10,Citation11 Moreover, producing HIV-1 in cells overexpressing SERINC5.1, or infecting cells with virus that lacks a functional nef gene, has been shown to potentially enhance the exposure of the HIV-1 envelope glycoprotein 41 (gp41) membrane proximal external region (MPER), and thus render the virus more sensitive to gp41 MPER-specific neutralizing antibodies.Citation12,Citation13 It was also observed that deleting the region now identified as ECL4 by Pye et al., which also contains an N-linked glycan residue, abrogates the enhanced neutralization by HIV-1 MPER antibodies.Citation4,Citation11 SERINC5 ECL4 was deduced to be a critical loop involved in HIV-1 restriction.Citation11 Furthermore, in a different study investigating counteraction of SERINC5 by the HIV-1 Nef protein, it was suggested that the SERINC5.1-Nef interaction is at ICL4, amino acidic residues 350 to 353.Citation14
Recently, Passos et al. used clustered regularly interspaced short palindromic repeats (CRISPR) and CRISPR-associated protein 9 (Cas9) (CRISPR/Cas9) to create SERINC5 knockout Jurkat T-cells into which they reintroduced SERINC5.1 that bears an extracellular hemagglutinin (HA)-tag to assess endogenous expression levels of SERINC5 at the plasma membrane.Citation15 They reported that type I interferon treatment induced post-translational modifications of intracellular SERINC5 and increased the level of HA-Tagged SERINC5.1 at the plasma membrane in the Jurkat-Tag lymphocyte cell line.Citation15
Most previous studiesCitation5-Citation7,Citation9-Citation12,Citation14-Citation19 that have evaluated SERINC5 function and activity have been confined to exogenously expressed SERINC5, often containing an HA or FLAG-tag. Production of monoclonal antibodies (mAbs) against membrane-associated proteins with multiple transmembrane domains is notoriously challenging, and while the need for mAbs to SERINC5 has been recognized, few mAbs have been available thus far. It has been noted that detection of endogenous SERINC proteins in cells has been precluded so far by the lack of suitable antibodies. Furthermore, due to lack of reagents for detection of endogenous SERINC proteins, it is still unclear whether SERINC3/5 are expressed to functionally relevant levels in primary targets for HIV infection and how expression of these restriction factors is regulated.Citation20 The only published mAb to SERINC5 that we have noted was recently produced by immunizing a single mouse with recombinant SERINC5 and used in cryo-electron microscopy studies to help delineate the human SERINC5 structure.Citation4
Using a DNA-prime/peptide boost immunization regimen in mice, we report here the production of novel anti-SERINC5 mAbs that target unique peptide sequences on three distinctive loop regions (ECL1, ECL4, and ICL4) of SERINC5. We obtained specific mAbs that detect SERINC5 in the culture fluids of HIV-1 infected cells, suggesting that these mAbs recognize virion-associated SERINC5. Some of these antibodies also detect SERINC5 in multiple cell lines that are used in HIV-1 research. These novel SERINC5 mAbs will provide tools to study several mechanisms of SERINC5 action, to include HIV-1 restriction, neuronal plasticity,Citation1,Citation2 and the role of SERINC5 in lipid rafts in cancer.Citation21 These antibodies could also potentially be engineered to serve as therapeutic tools.
Results
Animal immunizations and assessment of SERINC5 mouse serum reactivity
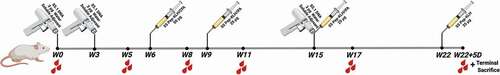
Three SERINC5 peptides were selected as target epitopes in two extracellular domains (ECL1 and ECL4) and one intracellular epitope (ICL4),Citation4,Citation11,Citation14 based on sequence, antigenicity, surface and hydrophilicity scores, as presented in . The ECL4 and ICL4 peptides required the addition of an N-terminal or C-terminal cysteine residue, respectively, for conjugation to keyhole limpet hemocyanin (KLH). BALB/c mice were immunized intradermally with codon-optimized SERINC5.1 DNA and then boosted with KLH-peptide during a 22-week immunization schedule (). Mouse sera were collected and tested using various assays two weeks post the third, fourth, and fifth immunizations at weeks (W) 8, 11, and 17.
Table 1. Characteristics of the three unique target sites on SERINC5, as predicted by OptimunAntigenTM. The human SERINC5 isoform 1 amino acid numbers and sequence is available at the GenPet NCBI reference sequence NP_001167543.
Figure 1. BALB/c mouse immunization scheme. At weeks 0, 3, 15 mice were immunized using a Gene gun with 3 ug codon-optimized S5.1 DNA in water-soluble adjuvant. At weeks 6, 9, 15 mice received 50 ug intraperitoneal injections of KLH-conjugated peptide in IFA or CFA. Peptide conjugated to KLH without adjuvant was given at 22 weeks plus 4–5 days, before the final sacrifice for splenic fusion. Blood draws (red droplets) were at baseline or two weeks post-immunizations, at week (w) 0, 5, 8, 11 and 17.
Mouse serum reactivity was measured against the specific SERINC5 immunizing peptides by peptide ELISA, as shown in . Serum reactivity was detected as early as W8 and was subsequently boosted by the fourth immunization measured at W11; the group mean reactivities plateaued or waned two weeks after the fifth immunization (W17) (). Based on preliminary data using sera from W11, we sacrificed mice 5624 and 5616, performed pilot spleenic fusions and assessed reactivities of the hybridoma cell supernatants by Western blot (WB) and whole cell ELISA (data not shown). To try to increase the magnitude of responses, an additional DNA peptide boost was given at W15 for all remaining mice.
Figure 2. Mouse serum IgG ELISA titers at 2 weeks after each SERINC5 peptide boost. Serum IgG binding titers to the respective immunizing SERINC5 peptides were evaluated for each animal two weeks after the 3rd (W8, red lines), 4th (W11, green lines), and 5th (W17, black lines) immunizations. The group means after each peptide immunization (with a standard error of the mean) are shown (a–c). Responses of individual mice for each group are shown for W11 (d–f) and W17 (g–i).
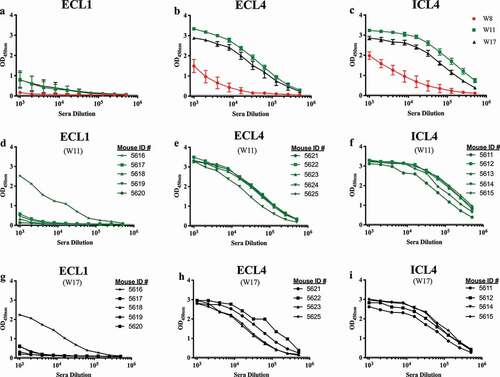
Analysis of sera from individual mice revealed that only one of the five mice immunized with the ECL1 peptide (mouse 5616) reacted after the fourth and fifth immunizations (). For mice that received ECL4 or ICL4 peptides, we observed consistently higher binding titers at W11 (), in accordance with their antigenicity scores (). The responses for these two groups then waned at W17 (). Despite this decrease in reactivity, we still detected IgG binding to SERINC5 peptides at the maximal tested serum dilution of 1:512,000 at W17 for most animals in these two groups.
In order to test the specificity of our mouse sera, and subsequently our mAbs, for detection of full-length SERINC5.1, we prepared an HEK293 cell line that was stably transduced with the SERINC5.1 gene containing C-terminal Myc- and DDK (FLAG) Tags, using the approaches described in detail in Methods. The SERINC5.1 transgene expression in the newly transduced cell line (HEK293_S5.1) was evaluated by WB with Licor imaging to detect the DDK-tagged protein. The presence or absence of SERINC5.1-Myc-DDK in the transduced HEK293_S5.1 or parental HEK293 cells was confirmed using a mouse mAb to DDK (anti-DDK) (Figure S1, lane 1 and 7, green channel) and a panel of rabbit anti-SERINC5 polyclonal antibodies (Figure S1, lanes 2–6 and 8–12, red channel). At a normalized concentration of total protein electrophoresed, detection by the rabbit serum was much higher in the transduced line than in parental HEK293 cells, and the protein species detected by the rabbit sera (red bands) co-migrated with the protein detected by the anti-DDK control (Figure S1, lane 1 vs. lanes 4–6), indicating successful overexpression of the tagged SERINC5.1 protein. The molecular weights reported for SERINC5 isoforms range from 40–55 kDa, while the virus incorporated form appears to be 55 kDa;Citation10 the proteins detected by the control antibodies in our transduced cell line represent species in this range.
The concentration of puromycin was further optimized to amplify SERINC5.1 transgene expression, as previously described by Prieto et al.Citation22 Culturing cells in media with increased levels of puromycin (1.4 μg/mL, 50 μg/mL, 100 μg/mL) demonstrated 50 μg/mL to be an optimal puromycin concentration for higher expression of SERINC5.1. Quantification of the band signals shown in (Figure S2a), lanes 2–7, showed an approximate 50% increase of SERINC5.1 detected by the anti-DDK mAb when 50 μg/mL of puromycin was used (Figure S2b). For subsequent applications, 50 μg/mL was used to culture the HEK293_S5.1 cell line, stably expressing SERINC5.1.
We then screened the mouse sera from all three groups at W8, W11, and W17 by HEK293_S5.1 whole-cell ELISA (WCE), and by WB (Figure S3). For WB testing of mouse sera for groups that received ECL1 and ICL4 peptides, we used commercially available SERINC5 recombinant fusion proteins (SER5-FP) that contained about 50 amino acids of the ECL1 or ICL4 regions of SERINC5, including our immunizing peptide sequences for ECL1 or ICL4. These fusion proteins demonstrated a molecular weight of 25 kDa (Figure S3d,f) (SER5-FP). The appropriate rabbit anti-SERINC5 polyclonal serum was used to detect the SER5-FPs as positive controls, as indicated by the red channel bands at the outer lanes of the blots shown in Figure S3d,f. However, for the ECL4 mice, in the absence of commercially available SER5-FP for the ECL4 epitope, we used HEK293_S5.1 whole-cell lysate (Figure S3e) for WB. The anti-DDK mAb was used as a positive control, as indicated by the diffuse green channel band seen in the far left lane in Figure S3e.
Furthermore, we incubated the mouse sera from W17 with each group’s respective immunizing peptide to evaluate nonspecific binding to HEK293_S5.1 proteins prior to use in WCE. As shown by the tan bars (compared to the black bars) in Figure S3a–c, the W17 reactivity was more than 50% reduced by the peptide competition for most reactive mouse sera, particularly for mice 5616, 5622, and 5615, and these three mice were selected for splenic fusion. While positive in several tests, the W17 serum reactivity from mouse 5623 appeared to be nonspecific and was not competed by the specific peptide; this mouse was thus not chosen for mAb production.
The mice demonstrated similar comparative immune response trends by peptide ELISA, WCE (Figure S3a–c) and WB (Figure S3d–f) analyses. The data from peptide ELISA (), aided by the WCE and WB data (Figure S2a–f), were used to down-select mice for spleen cell fusion. Given the magnitude of peptide ELISA titers observed at W11 for mice in the ECL4 and ICL4 peptide groups, we selected mouse 5624 and mouse 5613, respectively, from these groups to perform splenic cell fusion without a fifth immunization. Three additional mice were selected for splenic fusion after the W15 fifth immunization. We selected mouse 5616 from the ECL1 group, mouse 5621 from the ECL4 group, and mouse 5615 from the ICL4 group. Mouse 5621, however, died before the cell fusion and was replaced with mouse 5622 that had good titers with specificity, and the highest peptide ELISA binding at W17. Additionally, mouse 5625 in the ECL4 peptide group had strong reactivity in the WCE (Figure S3b), but we did not observe reactivity on the HEK293_S5.1 WB (Figure S3e) and did not perform splenic cell fusion for that mouse.
Hybridoma cell line fusion and sub-cloning
The selected mice received an additional unadjuvanted peptide boost four to five days before spleen removal and cell fusion.Citation23 After the cell fusion and single-cell limiting dilutions were performed, we screened hybridoma cell supernatants for reactivity to the relevant peptides by peptide ELISA, selected positive clones, and maintained the cells as previously described.Citation23 Twenty reactive clones from the ECL1 group, seven reactive clones from the ECL4 group, and 40 reactive clones from the ICL4 group were obtained, based on single-well peptide ELISA screening of over fifty 96-well plates (data not shown).
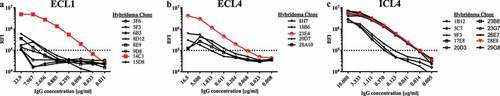
The total IgG concentration for each hybridoma cell line supernatant was then standardized by diluting the samples to the lowest IgG concentration in the respective mAb groups. Next, we evaluated the hybridoma supernatants by determining WCE endpoint dilutions using the HEK293_S5.1 cell line, as shown in . The hybridoma supernatants with the highest titers for each peptide group are indicated in red. Western blots were also performed using the SERINC5-FP recombinant proteins for ECL1 and ICL4, and using HEK293_S5.1 cell lysate for all three groups. We quantified and subsequently normalized the WB and WCE relative fluorescent intensity (RFI) data by calculating the area under the curve (AUC) values for the data for each hybridoma supernatant, which we then used to create a heat map. The AUC averages across the assay platforms (Figure S4a) were used as a guide for the down-selection of hybridoma cell lines for subcloning.
Figure 3. Hybridoma clone screening post fusion by whole cell ELISA (WCE) using the HEK293_S5.1 cell line. The input IgG concentrations for supernatants from each peptide group were normalized to the lowest sample IgG for comparisons of titer; the assay cutoff is indicated by the dotted lines.
The subclone supernatants were again evaluated according to our screening strategy using WCE and WB; the strongest positive subclones underwent an additional round of peptide ELISA screening, IgG concentration standardization, WCE, and WB screening. We also added an additional WCE screening step against the parental HEK293 cells to detect the basal expression of native SERINC5 in the parental cell line using the down-selected hybridoma subclones. Based on the averaged AUC resulting from these analyses, we selected four anti-SERINC5 hybridoma cell lines for mAb production: 14C1-1 (ECL1), 18B6-1 (ECL4), 23E4-1 (ECL4), and 28E8-2 (ICL4) (Figure S4b, clones indicated in red font). These hybridomas were scaled up, the IgG was purified from the culture fluids, and the isotypes were determined; the mAbs were then tested for several applications, as described in .
Table 2. Antibody performance in multiple applications using the four down-selected and purified SERINC5 monoclonal antibodies. The first + or – symbol indicates mAb performance using the HEK293_S5.1 cell line as an antigen source for SERINC5, and the second symbol (following the/) indicates the activity of the mAb on any of the other five cell lines tested. ND indicates not done, for the respective antibody and assay.
Anti-SERINC5 monoclonal antibody qualification
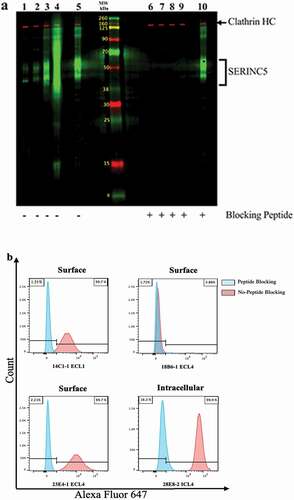
shows the WB analysis using HEK293_S5.1 cell lysates and the four anti-SERINC5 mAbs: 14C1-1 (lanes 1 and 6), 18B6-1 (lanes 2 and 7), 23E4-1 (lanes 3 and 8), and 28E8-2 (lanes 4 and 9). The anti-DDK positive control was applied for lanes 5 and 10, and all three SERINC5 peptides were pre-incubated with the anti-DDK for lane 10, to demonstrate the specificity of the SERINC mAbs (the SERINC5 peptides only compete for binding of the SERINC5 mAbs and do not compete with the anti-DDK mAb). The brackets to the right of the panel indicate the multiple SERINC5 species detected by the mAbs; these multiple bands may represent multimers, glycosylated forms and/or different isoforms of the SERINC5 proteins. We also blocked the mAbs by pre-incubating with their respective immunizing peptides to assess nonspecific binding, as indicated by the (-) or (+) peptide symbols below the panel (). All four mAbs detect the SERINC5 species recognized by the anti-DDK positive control, but with differing magnitudes, as can be seen in , lanes 1–4. A similar band pattern in HEK293_S5.1 cells is also observed in (as compared with the species detected in Figure S1), lanes 4 and 6, by the rabbit polyclonal anti-SERINC5 antibodies.
Figure 4. Detection of SERINC5 in HEK293 cells transduced to overexpress SERINC5 isoform 1 (HEK293_S5.1). (a) HEK293_S5.1 cell extract was applied to two preparative wells of a 12% polyacrylamide gel, with a center lane containing labeled molecular weight standards. The MPX blotting system was applied to the blot to screen for mAb reactivity with (lanes 6–10) or without (lanes 1–5) competition with the matched immunizing peptides at 10 μg/mL. The mAbs were added at 0.5 μg/mL to lanes in the MPX as follows: 14C1-1 (1 and 6); 18B6-1 (2 and 7); 23E4-1 (3 and 8); 28E8-2 (4 and 9); anti-DDK plus a mix of all three peptides (5 and 10). The mAbs were detected using goat anti-mouse IgG-IRDye 800CW (green bands). The rabbit anti-clathrin heavy chain (HC) was added to all lanes and detected with goat anti-rabbit IgG-IRDye 680RD (red bands), as a protein loading control. (b). MFI of flow cytometry surface staining of HEK293_S5.1 with AF647 conjugated mAbs, as indicated; intracellular detection was performed using 28E8-2 (ICL4). Histograms indicate staining of the cells with (blue peaks) or without (red peaks) mAb pre-incubation with the respective SERINC5 peptides.
In a separate laboratory under differing conditions of cell lysis and WB analysis (see Methods), the specificity of our mAbs for SERINC5, and not for SERINC2, was observed. As shown in the WB presented in Figure S5, when our mAbs were used to probe for SERINC2-FLAG and SERINC5-FLAG from transiently-transfected HEK293 cell lysates, the mAbs tested recognized only SERINC5 (bands indicated by red arrows between the 37 and 50 kDa molecular weight standards), and not SERINC2. The SERINC2 bands were detected only by the M2 anti- FLAG mAb control (green arrow).
The applicability of these mAbs for flow cytometry (FC) was also assessed using our HEK293_S5.1 cell line. Alexa Fluor 647 fluorochrome was conjugated to the mAbs, and HEK293_S5.1 were surface stained with 14C1-1(ECL1), 18B6-1 (ECL4), and 23E4-1 (ECL4), or intracellularly stained with 28E8-2 (ICL4), according to the proposed topological arrangements of these epitopes.Citation11 We also included a peptide blocking step to confirm the binding of the anti-SERINC5 mAbs to their respective epitopes. In , it can be seen that the 14C1-1 and 23E4-1 surface staining, as well as the 28E8-2 intracellular (IC) staining, are all blocked by the appropriate peptides. We observed no significant difference in the surface staining with 18B6-1 when compared to the matched isotype control and peptide blocked stain (); thus, that antibody was not further evaluated.
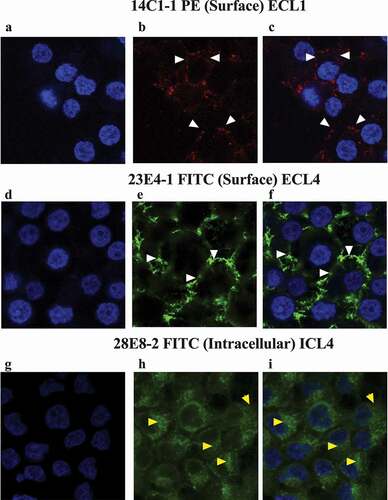
The utility of the anti-SERINC5 mAbs for immunocytochemistry (ICC) by confocal microscopy was assessed using mAbs with directly conjugated fluorochromes (as indicated in ) and staining of the HEK293_S5.1 cell line. DAPI staining of the nuclei is seen by the blue color visualized in . Plasma membrane association was observed (indicated by white arrows in , panels b, c, e and f) when cells were surface stained with 14C1-1-PE and 23E4-1-FITC mAbs. We observed more diffuse staining outside of the nuclei (yellow arrows in ) when permeabilized HEK293_S5.1 cells were stained internally using 28E8-2-FITC. No surface staining was observed for 28E8-2 (data not shown). These images indicate that organelle membranes may contain SERINC5, and/or staining of alternatively spliced SERINC5 isoforms and intermediates of SERINC5.1 may be observed in the cytoplasm.
Figure 5. Immunocytochemistry staining of HEK293_S5.1 cells using the indicated SERINC5 mAbs. Cells were surface stained using 14C1-1 and 23E4-1, but internally stained using 28E8-2 and counterstained using DAPI. For panels (a, d and g) only the DAPI staining of nuclei is visualized. Panel b: surface staining (indicated by white arrows) by 14C1-1-PE (ECL1); Panel e: surface staining with 23E4-1-FITC (ECL4); Panel h: Intracellular staining (indicated by yellow arrows) by 28E8-2-FITC (ICL4); Panels c, f and i show the merged images of DAPI and SERINC5 mAb staining.
The cell line panel was further expanded to include several cell lines used in HIV-1 research and neutralization assays (A3R5, Jurkat E6.1, H9, HEK293, HEK293_S5.1, and TZM-bl) and the reactivity of our anti-SERINC5 mAbs was evaluated by FC and WB. Interestingly, only 14C1-1 was able to detect endogenous levels of SERINC5 in all the cell lines by WB (Figure S6, lanes 1–6), which we confirmed by blocking with ECL1 immunizing peptide (Figure S6, lanes 7–12).
By FC, surface staining of the same panel of cell lines with SERINC5 mAbs resulted in a low mean fluorescence intensity (MFI), indicating a modest level of SERINC5.1 detectable at the plasma membrane (Figure S7a, dark blue bars). When we permeabilized the cells, more abundant internal endogenous SERINC5 was observed across the panel. With the internal staining represented by dark blue bars, (Figure S7b), all anti-SERINC5 mAbs had strong MFI signals that were one to two logs above the matched isotype control (gray bars). Surface staining with 14C1-1 and 23E4-1 was about a log higher in the HEK293_S5.1 cell line, as compared to the HEK293 parental line, and IC staining by 28E8-2 showed the same difference (Figure S7). Additionally, when we blocked the anti-SERINC5 mAbs with the respective immunizing peptides, the signals were reduced to background levels (Figure S7a,b, light blue bars).
To confirm that the SERINC5 mAbs are specific to their respective loops, and to assess potential virion binding, we performed a virus capture assay using filtered virus stock. For this assay, HEK293 or HEK293_S5.1 cells were used to produce the subtype B HIV-1 infectious molecular clone, WR27, and the virus input was normalized by equal amounts of HIV-1 gag p24 (). The capture of virus produced in the SERINC5 over-producing HEK293_S5.1 cell line indicates that the 14C1-1 and 23E4-1 bind to the abundant surface-exposed SERINC5, presumably in the viral envelope. However, the ICL4 mAb 28E8-2 does not capture virus, as the HIV-1 core p24 measured is at background levels; no capture was observed for WR27 virus produced in the parental HEK293 cells. A similar level of HIV-1 was captured by the 4E10 anti-HIV-1 gp41 MPER mAb when using virus from HEK293_S5.1 versus HEK293 cells (gray bar). The 4E10 was used as a positive control for HIV capture. These data suggest that the 14C1-1 and 23E4-1 mAbs recognize surface-exposed SERINC5 loops, and that the 28E8-2 mAb binds a more sequestered, internal loop on viral SERINC5.
Figure 6. SERINC5 mAbs to the extracellular loops capture subtype B HIV-1(WR27). An equal amount of HIV-1WR27 (normalized by p24 core protein) was added to 96-well capture plates pre-coated with te indicated mAbs, using anti-luciferase (anti-Luc) as a negative control. The amount of virus bound by each antibody is indicated by the amount of viral p24 core protein (pg/mL) eluted from the antibodies after capture.
The final summary of the utilities of these novel SERINC5 mAbs in various applications is presented in . The tabulation of the strengths of reactivities of the four mAbs in flow cytometry using the HEK293_S5.1 cells that are surface stained or permeabilized is indicated by the + or – symbols. The first + or – indicates activity on the HEK293_S5.1 cells, and the second symbol (after the/) indicates reactivity to any of the other five cell lines tested. Reactivities by WB and ICC are also represented in the same manner, indicating these mAbs to be useful in multiple applications.
Discussion
The main goal of this work was to obtain mAbs directed against both intracellular and extracellular loops of SERINC5, which we achieved through our prime-boost immunization strategy in mice. We used a full-length SERINC5.1 DNA prime and chose both intracellular and extracellular regions of SERINC5 to use for peptide boosting immunogens. Interestingly, we were able to induce a response to the SERINC5 ECL1 peptide in only one mouse, indicating this to be the least immunogenic region tested. Indeed, according to the recent model presented by Pye et al., our chosen ECL1 peptide may be only partially extracellular. The C-terminal 5 amino acids of our peptide appear to be at the beginning of TM2 in the first part of that transmembrane helix and are probably buried in the membrane.Citation4 The one mouse that exhibited the strongest response, produced antibodies most likely to the CKGIKAG sequence of ECL1, which must reside quite close to the membrane. Of note, this 14C1-1 ECL1 antibody does detect some degree of surface staining in most of the cell lines tested, which is surprising (Figure S7). The antigenicity, surface exposure and hydrophilicity scores accurately predicted the observed binding and magnitudes of responses for the three peptide immunogens. In agreement with the predictions, we observed stronger immune responses in mice in the ECL4 and ICL4 peptide groups; these regions have higher antigenicity scores than the ECL1 region.Citation24 The ECL4 and ICL4 also contain sites for the biological processes of N-linked glycosylation, ubiquitination and interaction with Nef.Citation6,Citation7,Citation10 Moreover, ICL4 is the longest intracellular loop,Citation4,Citation11 and the amino acid sequences used for the ICL4 peptide immunizations had the highest predicted hydrophilicity of our three epitope targets (), which may explain why the ICL4 peptide-boosted mice mounted the highest immune responses in several tests. Finally, the peptide chosen for ECL4 contains a proline residue that is highly conserved through ten orthologs of SERINC, including all five human variants, yeast and drosophila SERINC.Citation4 This proline may improve immunogenicity of the peptide and might facilitate the presentation of this epitope for detection of SERINC5.
When testing the specificity of the SERINC5 mAbs by WB using the HEK293_S5.1 cell lysate, we could detect SERINC5.1 protein species with molecular weights between 38 kDa and 55 kDa. The mAbs recognized multiple bands and aggregates, with some species recognized by the anti-DDK mAb control. These multiple forms have been previously described in cells transfected with SERINC5.1, and the band patterns were attributed to aggregation, ubiquitination and/or glycosylation of SERINC5.Citation5,Citation9,Citation11 When we blocked the anti-SERINC5 mAbs with the corresponding immunizing peptides for the WB against the HEK293_S5.1 lysate, all bands and aggregates were no longer specifically observed (, S6), indicating that the forms detected are indeed SERINC5 species.
The mAbs also stained for SERINC5.1 in the HEK293_S5.1 cell line using FC. All anti-SERINC5 mAbs except 18B6-1 (ECL4 epitope, no surface staining observed) stained the HEK293_S5.1 cell line strongly according to the topology of the boosting peptides.Citation4,Citation11,Citation14 While intracellular staining in permeabilized HEK293_S5.1 cells was strong for all mAbs, surface staining was positive, but of low magnitude in the lymphocyte cells. These data suggest that the orientation of the protein may be different in the normally adherent HEK293_S5.1 cells, where high levels of SERINC5.1 produced may not reflect the native physiologic state of the protein. In addition, the SERINC5.1 ECL1 and ECL4 epitopes may be poorly exposed in the lymphocyte cell lines. Ongoing work with primary cells will shed more light on the exposure of these SERINC5 epitopes in vivo.
These mAbs also performed well using ICC to detect SERINC5.1 in the HEK293_S5.1 cell line. Plasma membrane localization was verified using surface staining with mAbs to the extracellular loops, and permeabilized cells showed staining of the region outside of the nuclei and internally using the 28E8-2 (ICL4) mAb (). These data indicate an association of SERINC5 isoforms with other organelle membranes inside the cell, as suggested by others.Citation25
Previously it was shown that part of ECL4 is required for SERINC5.1 incorporation into the HIV-1 virion.Citation11 The virus capture data indicate that the 14C1-1 and 23E4-1 mAbs (both against EC loops) bind surface exposed SERINC5 on HIV-1 (and/or vesicles containing both SERINC5 and p24 gag proteins) produced in the HEK293_S5.1 cell line where SERINC5.1 is abundantly expressed. Although similar amounts of HIV-1 particles (normalized by p24 gag protein and captured equally by 4E10) were used for capture, the amount of SERINC5 present in the parental HEK293 cell-derived virions was not sufficient for capture by the SERINC5 mAbs, as no p24 was measured (). The ability to capture viral particles should be a useful property of these antibodies applicable for different studies of the virion and of the HIV-1 Env-SERINC5 interaction and potential Env remodeling by SERINC5.Citation4,Citation13,Citation19 Understanding the amount and orientation of SERINC5 in HIV-1 virions prepared in various producer cells may also aid in studies of the impact of SERINC5 on envelope conformation, humoral responses (especially to the MPER region) and assessment of important immune responses such as antibody-dependent cell-mediated cytotoxicity and neutralizing antibodies.Citation12,Citation13,Citation26,Citation27
SERINC5 protein levels have previously been inferred from SERINC5 mRNA expression levels in cell lines or PBMC.Citation6 However, mRNA level may not always correlate with the actual protein expression level.Citation28 In addition, Zutz et al. recently demonstrated an increase in SERINC5 mRNA during myeloid cell differentiation, and suggested that SERINC5 is endogenously expressed to antivirally active levels in macrophages.Citation20 It will be interesting to see if the level and/or localization of SERINC5 protein is concomitantly altered during this process. The availability of these novel SERINC5 mAbs to assess endogenous levels of the native protein in various cell lineages should aid in studies of the role of SERINC5 in vivo in a variety of physiologic conditions, and especially in HIV-1 infection.
Materials and methods
Immunogen design
The SERINC5 transcript variant 1 (GenBank accession number NM_001174072.3) was codon-optimized with the GeneSmartR codon optimization tool (GenScript, Piscataway, NJ) and the gene was cloned in CMVR-3c-His using XbaI and BamHI restriction sites.Citation29 We used the OptimunAntigenTM tool (GenScript, Piscataway, NJ)Citation30 to design maximally immunogenic peptides and ensure that the three peptides regions did not overlap and had the best immunogenicity surface exposure and hydrophilicity scores possible (). The immunizing peptides correspond to amino acid positions 73–84 (ECL1), 281–294 (ECL4), and 370–383 (ICL4) of SERINC5. Additionally, cysteine residues were added to the N- or C-terminus to SERINC5 peptides for ECL4 and ICL4, as indicated (), to allow for conjugation to KLH to improve immunogenicity.Citation31
Immunization regimen
Fifteen BALB/c mice were immunized intradermally by gene gun with 3 μg of the above codon-optimized SERINC5.1 DNA in a water-soluble adjuvant at W0 and W3. Five mice per group for SERINC5 loops (ECL1, ECL4, and ICL4) were immunized by intraperitoneal injection with 50 μg of peptide in complete Freund’s adjuvant (CFA) at W6, and in incomplete Freund’s adjuvant (IFA) at W9 and W15. A 3 μg SERINC5.1 DNA boost was also co-administered at W15. Serum samples were collected at baseline and two weeks post each immunization at W5, W8, W11, and W17 and stored at −80°C. The best responding mice were selected to receive an additional unadjuvanted 25 μg peptide boost four to five days before final sacrifice and cell fusion, for additional B cell stimulation. Mouse spleens from the selected reactive mice were fused with myeloma cells as previously described.Citation23
Immunogen peptide ELISA
We measured binding antibody responses by indirect sandwich ELISA to SERINC5 immunizing peptides for each group. Briefly, 96-well microtiter plates were coated with 100 μL immunizing peptides diluted to 1 μg/mL final concentration overnight at 4°C. Microtiter plates were washed once with PBST (phosphate-buffered saline (PBS) + 0.05% Tween20), then blocked for 1 hour at 37°C with a PBST 1% bovine serum albumin (BSA) buffer. Plates were washed once with PBST, then the titered mouse sera or single point hybridoma cell line supernatant was added and incubated for 1 hour at 37°C. Plates were washed four times with PBST, and then a horse radish peroxidase-conjugated anti-mouse secondary antibody (GenScript Cat# A00160) was added and incubated for 30 minutes at 37°C. Plates were washed four times with PBST, and TMB reagent was added. After a 15-minute incubation at room temperature (RT), stop reagent was added, and the absorbance was measured at 450 nm on a VersaMax plate reader (Molecular Devices) and the data was acquired and analyzed with SoftMax Pro (7.01 Molecular Devices) according to the manufacture’s recommendations.
Hybridoma supernatant IgG quantification and normalization
We measured the IgG concentrations for each hybridoma cell line supernatant with a mouse IgG ELISA kit (Abcam #151276) according to the manufacturer’s instructions. Next, we normalized the hybridoma IgG concentrations for each group by diluting all samples to equal the lowest IgG concentration in that group for analytical comparisons.
Cell culture and cell line
The following cell lines were obtained from the NIH AIDS Reagents Program and cultured under standard aseptic cell culture techniques accordingly to the instructions on the accompanying data sheets: Jurkat (E6-1), catalog # 177; H9, catalog # 87; TZM-bl, catalog # 8129; A3R5.7, catalog # 12386 and HEK293, catalog# 103.
HEK293_S5.1 cell line production
HEK293 cells and transduced HEK293_S5.1 cells were cultured in Dulbecco’s modified Eagle’s medium (DMEM), containing 10% heat-inactivated fetal bovine serum (FBS), Pen-Strep and 25 mM HEPES and incubated at 37°C, 5% CO2 and 95% relative humidity (RH) unless otherwise stated. A puromycin (Fisher Scientific) toxicity curve was established for the HEK293 cells by plating 5 × 10⁴ cells per well in a 24-well plate with a range of puromycin concentrations from 0 to 10 μg/mL. After incubating for 72 hours, we checked for cell death by microscopic inspection. Based on these observations, we found that 1.4 μg/mL puromycin is sufficient to kill untransduced cells; hence, this concentration of puromycin was used in the culture medium to initially select for transduced cells.
Lentiviral particles were generated by transfecting HEK293 cells with SERINC5 transcript variant 1 (SERINC5.1) (GenBank accession: NM_001174072.3) expression plasmid, with Myc-DDK-tag and a puromycin selective marker (Origene, #RC230125L3), according to the manufacturer’s recommendations. Lentiviral particle p24 was quantified by HIV-1 p24 antigen capture kit (ABL, Rockville, MD, #5421) to establish the multiplicity of infection (MOI) to be used to transduce HEK293 cells.
The protein expression of the SERINC5-Myc-DDK-tag transgene in the transduced HEK293 cells was confirmed by WB using the Multiplex Blotting System (MPX, Licor). The anti-DDK(FLAG) clone OTI4C5 mouse mAb (OriGene #50011) and a panel of rabbit anti-SERINC5 polyclonal antibodies (ABCAM #204400; Sigma # HPA037898; Novus Biological NBP1-7168) were used to detect the SERINC5.1 (see Figure S1). We further amplified the expression of the SERINC5.1 transgene as previously described by Prieto et al.Citation22 by culturing the cells in media with increased levels of puromycin (1.4 μg/mL, 50 μg/mL, 100 μg/mL); 50 μg/mL of puromycin was used in HEK293_S5.1 culture media for downstream applications.
Protein extraction and Western blot analysis
Cellular proteins were extracted by lysis either directly in Cytobuster Protein Extraction Buffer (EMD Millipore Novagen, #71009) or with Mammalian Protein Extraction Reagent (M-PER Thermo Scientific #78501) containing protease inhibitors cOmplete (Roche, #11836153001) and Phenylmethylsulfonyl fluoride (PMSF #93482) at 4°C with shaking. The extracts were centrifuged at 14,000 G at 4°C for 15 minutes, followed by transferring the supernatants to clean tubes.
Protein concentration was determined for all lysates using Pierce bicinchoninic acid (BCA) protein assay (Thermo Fisher Scientific # 23225) according to manufacturer’s instructions. Cell extracts were normalized for total protein concentration and prepared for SDS-PAGE by adding 50 mM Tris (2carboxyethyl) phosphine hydrochloride (TCEP; 0.5 M stock, pH 7.0 Sigma #644547-1M), and 4X Protein Sample Loading Buffer (Licor #928-4004) followed by a 30-minute incubation at RT. The dual-color pre-stained protein ladder (Li-Cor #928-60000) and protein extracts were electrophoresed in 4–20% or 12% SDS-PAGE gels (BIORAD Mini-PROTEA TGX #4561096 or #4561046) at 150 V. Proteins were transferred onto nitrocellulose (NC) membranes (Li-Cor #926-31090) with the Trans-Blot Turbo module (BIORAD #1704150) at 25 V 1.5Amp for 7 minutes. The membranes were blocked with Li-Cor Odyssey Blocking Buffer (OBB; Li-Cor cat#927-4003) at 4°C overnight with rocking. Blots were incubated with mouse sera, rabbit sera, or mAbs (prepared in OBB diluted with PBS 1:2 with 0.1% Tween20) for 2.5 hours at RT with rocking followed by five washes (5 minutes) with wash buffer (0.2% Tween-20 with 0.1% Triton-X100 in PBS). Membranes were then incubated at RT for 45 minutes with goat anti-rabbit IRDye 680RD (red channel; Li-Cor #926-68071) and/or with goat anti-mouse IRDye 800CW (green channel; Li-Cor #926-32210), each prepared to a final dilution of 1:2,000 in the same buffer as the primary antibody. The membranes were washed five times and then scanned on the Odyssey infrared imager system (LI-COR Bioscience Lincoln, NE) at intensities between 3.5 to 5 integrated intensity settings. The resulting images were analyzed for arbitrary fluorescence units (AFU) with ImageStudio version 2.0.38, following instructions in Li-Cor tech document 984-15157 and Li-Cor tech document 979-14865.
For the specificity experiments (performed at the University of Essen) to assess mAb reactivity to SERINC5 vs. SERINC2, 1 × 10⁶ HEK293T cells expressing SERINC2 or SERINC5 (or mock-transfected cells) were harvested, washed in 1xPBS, and disrupted by freezing at −20°C. Cell pellets were thawed at room temperature and lysed for 1 hour on ice in 500 μl of DM lysis buffer (0.5% (w/v) n-Decyl-ß-D-maltopyranoside (Anatrace) in 20 mM Tris-Cl, pH 7.5, 10% (v/v) glycerol + protease inhibitors and Benzonase). Insoluble material was removed by centrifugation for 1 hour at 14,000 rpm at 4°C, and the supernatant mixed with SDS-PAGE sample buffer and incubated at 37°C for 15 minutes before SDS-PAGE analysis. The electrophoresed proteins were transferred to NC membranes by semi-dry transfer methods, and blots were processed as above.
Infrared whole-cell ELISA (WCE)
HEK293_S5.1 cells were seeded in 96-well flat-bottom optical plates coated with poly-lysine D (Nunc #152037) at 2 × 10⁴ cells per well and cultured for 48 hours under standard conditions. After 48 hours of incubation, we removed the cell culture media and fixed the cells with 3.7% formaldehyde at RT for 20 minutes. Next, we permeabilized the cells by washing five times with PBS with 0.1% Triton X-100 (five minutes) with shaking. After the permeabilization, cells were blocked with OBB for 1.5 hours at RT with shaking. Next, we added the test samples, pre-diluted in OBB with 0.2% Tween 20 in 50 μl, to respective wells. The mouse mAb anti-DDK(FLAG) clone OTI4C5 (Origene #TA50011-100) and rabbit polyclonal anti-SERINC5 (Human Protein Atlas #HPA037898) were used as positive controls, and for the negative control and to establish WCE cutoff, we used the pre-immune mouse sera or a negative hybridoma supernatant. Plates were incubated overnight at 4°C with shaking. The next day, plates were washed five times (five minutes), with 200 μL PBST (PBS with 0.2% Tween-20), with shaking. We then added the IRDye 800CW secondary goat anti-mouse antibody (Licor #926-3221) prepared at 1:800 in OBB with 0.2% Tween20. The CellTag stain (Licor #926-41090) used for well-to-well signal normalization was added to the plates and incubated for one hour at RT with shaking in the dark. Background wells contained only IRDye 800CW-secondary goat anti-mouse antibody. Wells were then washed with PBST. The plates were scanned on the flatbed Odyssey infrared imager system (LI-COR Bioscience Lincoln, NE) with a 3.5 mm offset, 84 μm resolution, and 3.0 to 5.0 integrated intensity setting for both the 700 nm and 800 nm channels. Post scanning image analysis was done with ImageStudio version 2.0.38, following Li-Cor technical document #984-15157 and #988-13623. We established the cutoff for WCE as previously described.Citation32 cutoff values were calculated using the wells containing negative samples, baseline mouse sera, or negative hybridoma supernatant, by averaging the integrated normalized signal intensity units and adding three times the standard deviation.
Flow cytometry analyses
The mAbs were conjugated with Alexa Flour 647 (Thermo Fisher #A20186) according to the manufacturer’s instructions. We detached adherent cells from the flasks with Accutase cell detachment media (Thermo Fisher Scientific #00-4555-56) and washed cells with PBS. Approximately 2.5 × 10⁵ cells per well were plated and then stained with 50 μL violet fixable live/dead dye (1:1000 dilution) (Thermo Fisher #L34964) following the manufacturer’s recommendations. Next, the cells were washed twice with PBS with 0.5% BSA (Sigma-Aldrich #A9576) and blocked for 30 minutes at RT with PBS with 0.5% BSA containing 0.1% normal mouse sera (ThermoFisher #10400C). Cells were either stained extracellularly with fluorochrome-conjugated antibodies or fixed and permeabilized using Fix&Perm kit (ThermoFisher #GAS001S-5 and #GAS002S-5) according to the manufacturer’s protocol. Subsequently, the cells were washed three times in 200 μL stain buffer, fixed for 20 minutes at RT in 50 μL of 2% formaldehyde (Tousimis Research #1008B), resuspended in 200 μL stain buffer and then analyzed on the Becton Dickinson LSRII flow cytometer. Post-acquisition analysis was performed with FlowJo 10.6.1. We used matched fluorochrome-conjugated, matched isotype mouse IgG to establish background fluorescence.
Monoclonal antibody production and purification
Selected hybridoma subclones were cultured with shaking at 120 rpm (Eppendorf New Brunswick S41i) at 37°C with 6% CO2 and 90% RH, in 600 mL CD Hybridoma Medium (Thermo Fisher Scientific #11279-023) supplemented with 2 mM/mL L-alanyl-L-glutamine dipeptide (Thermo Fisher Scientific #35050061), without FBS until the total cell number and IgG concentration plateaued, as measured by cell count and mouse IgG ELISA. Cell line supernatants were clarified by centrifugation, filtered and concentrated using Vivaflow crossflow cassette 50 kDa (Fisher Scientific #VF05P3) according to the manufacturer’s instructions. The resulting supernatant slurry was mixed at a 1:1 ratio with IgG Binding buffer (Thermo Fisher #21019) for a total of 40 mL, mixed with 2.5 mL prewashed protein G resin (GenScript #L00209) and incubated with end-over-end mixing overnight at 4°C. The concentrate-resin mixture was gravity-flowed through an Econ-Pac Chromatography column (Bio-Rad #732-1010) and washed twice with 50 mL IgG binding buffer. The antibody was eluted into two fractions using 10 column volumes of IgG Elution Buffer (Thermo Fisher #21004). Eluates were instantly neutralized with Tris-HCl (Sigma Aldrich #T3038-1L) pH 8.0 at a 1:10 dilution. The resulting mAbs were concentrated, and buffer exchanged using PBS and Spin-X concentrators of 50 kDa cutoff (Fisher Scientific #07-201-340). These mAbs are in commercialization; aliquots of protein are available upon request.
Immunocytochemistry and immunofluorescence imaging
Adherent HEK293_S5.1 cells were cultured for 48 hours in 8-well cell culture chamber slides (Nest #230108) pre-treated with 100 μL/well Poly-D-lysine hydrobromide (Sigma-Aldrich #p7405). Once the cells were approximately 50% confluent, they were washed with PBS containing Ca2+ and Mg+ and blocked with PBS containing 0.5% BSA and 10% normal mouse sera (ThermoFisher #10400C). Following manufacturer’s instructions, anti-SERINC5 mAb 14C1-1 was conjugated to R-PE (Expedeon # 703-0010), and mAbs 23E4-1 and 28E8-2 were conjugated to FITC (Expedeon # 707-0010). Cells were then surface stained for two hours with 100 μL 14C1-1 (R-PE) or 23E4-1 (FITC) diluted in PBS with 0.5% BSA. Cells were washed again as above and then fixed with 2% formaledehyde (Tousimis Research #1008B) for 10 minutes at RT. For the internal staining, cells were fixed then washed three times with 300 μL permeabilization buffer (PBS with Ca2+ and Mg+ and 0.1% Triton X-100), stained internally with 100 μL 28E8-2 (FITC) diluted in stain buffer (PBS with 0.5% BSA, 0.4%Tween 20) and incubated overnight at 4°C in the dark. The next day, the cells were washed five times, as described above. Coverslips were mounted with ProLong mounting reagent containing a blue nuclear counterstain (Thermo Fisher Scientific #P36983) and imaged on an Olympus FluoView FV1200 confocal microscope.
Virus capture assay
The subtype B HIV-1WR27 infectious molecular clone was transfected in either HEK293 or HEK293_S5.1 cells, as previously described.Citation33 The virus stocks were harvested and filtered, and the HIV-1 core p24 protein was quantified using an HIV-1 p24 antigen capture kit (ABL, Rockville, MD, #5421), according to the manufacturer’s protocol. The virus capture assay (VCA) was performed as previously described to Cavacini et al., with modifications.Citation34 The anti-SERINC5 and control mAbs were bound to Protein A/G plates (Pierce #15138) per the manufacturer’s instructions. After removing excess mAb, plates were blocked with SuperBlock (Thermo Fisher Scientific #37535) and then washed with PBST. The virus stocks were diluted to an input of 60 ng/mL p24 and added to the mAb-coated wells. The supernatant was removed after a 1-hour incubation, and the unbound virus was washed away with DMEMT (DMEM with 0.01% Tween20). The captured virus was lysed and quantified using the p24 antigen capture kit (ABL, Inc.).
Statistical analyses
A standard score or Z-score for each assay, by the standard definition of value distance from the group-mean divided by individual assay datapoint and 3.4 positive and negative standard deviation under the normal curve, was calculated.Citation35 For each Z-score, we extracted the area AUC for the normal distribution from a z-score table, which was further ranked from minimum to maximum in Excel (version 16.30); a heatmap was then generated using GraphPad Prism (v8.2.0). For all statistical analyses and graphs presented, GraphPad Prism (v8.2.0) was used, unless otherwise noted.
Author contributions
SM, LW, GJ and VRP designed the research; SM, MZ, BS, EM, SG, and LT performed experiments; NLM, HS and RAG provided research oversight; SM and VRP analyzed the data and wrote the manuscript.
Disclosure of potential conflicts of interest
No potential conflicts of interest were disclosed.
Abbreviations
| AFU | = | Arbitrary Fluorescence Units |
| AUC | = | Area Under the Curve |
| BCA | = | Bicinchoninic Acid |
| BSA | = | Bovine Serum Albumin |
| CFA | = | Complete Freund’s Adjuvant |
| CRISPR | = | Clustered Regularly Interspaced Short Palindromic Repeats |
| DMEM | = | Dulbecco’s Modified Eagle Medium |
| DNA | = | Deoxyribonucleic acid |
| ECL | = | Extracellular Loop |
| ELISA | = | Enzyme-Linked Immunosorbent Assay |
| FBS | = | Fetal Bovine Serum |
| FC | = | Flow cytometry |
| HA | = | Hemagglutinin |
| HAT | = | Hypoxanthine-aminopterin-thymidine medium |
| HIV-1 | = | Human Immunodeficiency Virus 1 |
| IC | = | Intracellular |
| ICC | = | Immunocytochemistry |
| ICL | = | Intracellular Loop |
| IFA | = | Incomplete Freund’s Adjuvant |
| IgG | = | Immunoglobulin G |
| KLH | = | Keyhole Limpet hemocyanin |
| Luc | = | Luciferase |
| mAb | = | Monoclonal Antibody |
| MFI | = | Mean Fluorescent Intensity |
| mL | = | Milliliter |
| μL | = | Microliter |
| MOI | = | Multiplicity of Infection |
| MPER | = | Membrane Proximal External Region |
| MPX | = | Multiplex Blotting System |
| NC | = | Nitrocellulose |
| Nef | = | Negative factor |
| OBB | = | Odyssey Blocking Buffer |
| PBMC | = | Peripheral Blood Mononuclear Cells |
| PBS | = | Phosphate-Buffered Saline |
| RFI | = | Relative Fluorescence Intensity |
| RH | = | Relative Humidity |
| RNA | = | Ribonucleic Acid |
| RT | = | Room Temperature |
| SER5-FP | = | SERINC5 Fusion Protein |
| SERINC | = | SERine INCorporator |
| TM | = | Transmembrane domain |
| VCA | = | Virus Capture Assay |
| W | = | Week |
| WB | = | Western Blot |
| WCE | = | Whole-cell ELISA |
Supplemental Material
Download Zip (24.8 MB)Acknowledgments
We thank Brittani Barrows and Margaret Costanzo for flow cytometry consultation, and Chris Jewell and Jesse Schoen for technical assistance. We are grateful to Lynn Chen, and Molly Jia from GenScript, Piscataway, NJ, for their excellent assistance with the animal procedures and hybridoma production. Also, we would like to thank the NIH AIDS Regent Repository and for the contributors of the following cell lines: Jurkat (E6-1), catalog# 177 from ATCC Dr. Arthur Weiss; H9, catalog# 87 from Dr. Robert Gallo; TZM-bl, catalog# 8129 from Dr. John C. Kappes and Dr. Xiaoyun Wu; A3R5.7, catalog# 12386 from Dr. Robert McLinden; and HEK293, catalog#103 from Dr. Andrew Rice.
Supplemental material
Supplemental data for this article can be accessed on the publisher’s website.
Additional information
Funding
References
- Inuzuka M, Hayakawa M, Ingi T. Serinc, an activity-regulated protein family, incorporates serine into membrane lipid synthesis. J Biol Chem. 2005;280:35776–12. doi:https://doi.org/10.1074/jbc.M505712200.
- Krueger WHH, Gonye GE, Madison DL, Murray KE, Kumar M, Spoerel N, Pfeiffer SE. TPO1, a member of a novel protein family, is developmentally regulated in cultured oligodendrocytes. J Neurochem. 1997;69:1343–55. doi:https://doi.org/10.1046/j.1471-4159.1997.69041343.x.
- Xu J, Ji C, Wang L, Cao Y, Dai J, Ye X, Zeng L, Dai J, Wu Q, Xie Y, et al. Cloning and expression of a novel human C5orf12 gene*, a member of the TMS_TDE family. Mol Biol Rep. 2003;30:47–52. doi:https://doi.org/10.1023/A:1022250428015.
- Pye VE, Rosa A, Bertelli C, Struwe WB, Maslen SL, Corey R, Liko I, Hassall M, Mattiuzzo G, Ballandras-Colas A, et al. A bipartite structural organization defines the SERINC family of HIV-1 restriction factors. Nat Struct Mol Biol. 2020;27:78–83. doi:https://doi.org/10.1038/s41594-019-0357-0.
- Rosa A, Chande A, Ziglio S, De Sanctis V, Bertorelli R, Goh SL, McCauley SM, Nowosielska A, Antonarakis SE, Luban J, et al. HIV-1 Nef promotes infection by excluding SERINC5 from virion incorporation. Nature. 2015;526:212–17. doi:https://doi.org/10.1038/nature15399.
- Usami Y, Wu Y, Gottlinger HG. SERINC3 and SERINC5 restrict HIV-1 infectivity and are counteracted by Nef. Nature. 2015;526:218–23. doi:https://doi.org/10.1038/nature15400.
- Shi J, Xiong R, Zhou T, Su P, Zhang X, Qiu X, Li H, Li S, Yu C, Wang B, et al. HIV-1 Nef Antagonizes SERINC5 restriction by downregulation of SERINC5 via the endosome/lysosome system. J Virol. 2018;92:e00196–18. doi:https://doi.org/10.1128/JVI.00196-18.
- Sudderuddin H, Kinloch NN, Jin SW, Miller RL, Jones BR, Brumme CJ, Joy JB, Brockman MA, Brumme ZL. Longitudinal within-host evolution of HIV Nef-mediated CD4, HLA and SERINC5 downregulation activity: a case study. Retrovirology. 2020;17:3. doi:https://doi.org/10.1186/s12977-019-0510-1.
- Zhang X, Zhou T, Yang J, Lin Y, Shi J, Zhang X, Frabutt DA, Zeng X, Li S, Venta PJ, et al. Identification of SERINC5-001 as the predominant spliced isoform for HIV-1 restriction. J Virol. 2017;91:e00137–17. doi:https://doi.org/10.1128/JVI.00137-17.
- Sharma S, Lewinski MK, Guatelli J. An N-Glycosylated form of SERINC5 is specifically incorporated into HIV-1 virions. J Virol. 2018;92:e00753–18. doi:https://doi.org/10.1128/JVI.00753-18.
- Schulte B, Selyutina A, Opp S, Herschhorn A, Sodroski JG, Pizzato M, Diaz-Griffero F. Localization to detergent-resistant membranes and HIV-1 core entry inhibition correlate with HIV-1 restriction by SERINC5. Virology. 2018;515:52–65. doi:https://doi.org/10.1016/j.virol.2017.12.005.
- Sood C, Marin M, Chande A, Pizzato M, Melikyan GB. SERINC5 protein inhibits HIV-1 fusion pore formation by promoting functional inactivation of envelope glycoproteins. J Biol Chem. 2017;292:6014–26. doi:https://doi.org/10.1074/jbc.M117.777714.
- Beitari S, Ding S, Pan Q, Finzi A, Liang C. Effect of HIV-1 Env on SERINC5 antagonism. J Virol. 2017;91:e02214–16. doi:https://doi.org/10.1128/JVI.02214-16.
- Dai W, Usami Y, Wu Y, Gottlinger H. A long cytoplasmic loop governs the sensitivity of the anti-viral host protein SERINC5 to HIV-1 Nef. Cell Rep. 2018;22:869–75. doi:https://doi.org/10.1016/j.celrep.2017.12.082.
- Passos V, Zillinger T, Casartelli N, Wachs AS, Xu S, Malassa A, Steppich K, Schilling H, Franz S, Todt D, et al. Characterization of endogenous SERINC5 protein as anti-HIV-1 factor. J Virol. 2019;93:e01221–19. doi:https://doi.org/10.1128/JVI.01221-19.
- Chande A, Cuccurullo EC, Rosa A, Ziglio S, Carpenter S, Pizzato M. S2 from equine infectious anemia virus is an infectivity factor which counteracts the retroviral inhibitors SERINC5 and SERINC3. Proc Natl Acad Sci U S A. 2016;113:13197–202. doi:https://doi.org/10.1073/pnas.1612044113.
- Trautz B, Wiedemann H, Luchtenborg C, Pierini V, Kranich J, Glass B, Kräusslich H-G, Brocker T, Pizzato M, Ruggieri A, et al. The host-cell restriction factor SERINC5 restricts HIV-1 infectivity without altering the lipid composition and organization of viral particles. J Biol Chem. 2017;292:13702–13. doi:https://doi.org/10.1074/jbc.M117.797332.
- Jin SW, Alsahafi N, Kuang XT, Swann SA, Toyoda M, Göttlinger H, Walker BD, Ueno T, Finzi A, Brumme ZL, et al. Natural HIV-1 Nef polymorphisms impair SERINC5 downregulation activity. Cell Rep. 2019;29:1449–57.e5. doi:https://doi.org/10.1016/j.celrep.2019.10.007.
- Zhang X, Shi J, Qiu X, Chai Q, Frabutt DA, Schwartz RC, Zheng Y-H. CD4 expression and env conformation are critical for HIV-1 restriction by SERINC5. J Virol. 2019;93:e00544–19. doi:https://doi.org/10.1128/JVI.00544-19.
- Zutz A, Schölz C, Schneider S, Pierini V, Münchhoff M, Sutter K, Wittmann G, Dittmer U, Draenert R, Bogner J, et al. SERINC5 is an unconventional HIV restriction factor that is upregulated during myeloid cell differentiation. J Innate Immun. 2020:1–11. doi:https://doi.org/10.1159/000504888.
- Murai T. The role of lipid rafts in cancer cell adhesion and migration. Int J Cell Biol. 2012;2012:763283. doi:https://doi.org/10.1155/2012/763283.
- Prieto C, Fontana D, Etcheverrigaray M, Kratje R. A strategy to obtain recombinant cell lines with high expression levels. Lentiviral vector-mediated transgenesis. BMC Proc. 2011;5(Suppl 8):P7. doi:https://doi.org/10.1186/1753-6561-5-S8-P7.
- Kohler G, Milstein C. Continuous cultures of fused cells secreting antibody of predefined specificity. Nature. 1975;256:495–97. doi:https://doi.org/10.1038/256495a0.
- Kyte J, Doolittle RF. A simple method for displaying the hydropathic character of a protein. J Mol Biol. 1982;157:105–32. doi:https://doi.org/10.1016/0022-2836(82)90515-0.
- Thul PJ, Åkesson L, Wiking M, Mahdessian D, Geladaki A, Ait Blal H, Alm T, Asplund A, Björk L, Breckels LM, et al. A subcellular map of the human proteome. Science (New York, NY). 2017;356:eaal3321. doi:https://doi.org/10.1126/science.aal3321.
- Alsahafi N, Ding S, Richard J, Markle T, Brassard N, Walker B, Lewis GK, Kaufmann DE, Brockman MA, Finzi A, et al. Nef proteins from HIV-1 elite controllers are inefficient at preventing antibody-dependent cellular cytotoxicity. J Virol. 2016;90(6):2993–3002. doi:https://doi.org/10.1128/JVI.02973-15.
- Lai RP, Yan J, Heeney J, McClure MO, Gottlinger H, Luban J, Pizzato M. Nef decreases HIV-1 sensitivity to neutralizing antibodies that target the membrane-proximal external region of TMgp41. PLoS Pathog. 2011;7:e1002442. doi:https://doi.org/10.1371/journal.ppat.1002442.
- Payne SH. The utility of protein and mRNA correlation. Trends Biochem Sci. 2015;40:1–3. doi:https://doi.org/10.1016/j.tibs.2014.10.010.
- Curson ARJ, Williams BT, Pinchbeck BJ, Sims LP, Martinez AB, Rivera PPL, Kumaresan D, Mercadé E, Spurgin LG, Carrión O, et al. DSYB catalyses the key step of dimethylsulfoniopropionate biosynthesis in many phytoplankton. Nat Microbiol. 2018;3:430–39. doi:https://doi.org/10.1038/s41564-018-0119-5.
- Szafranski P. Evolutionarily recent, insertional fission of mitochondrial cox2 into complementary genes in bilaterian Metazoa. BMC Genomics. 2017;18:269. doi:https://doi.org/10.1186/s12864-017-3626-5.
- Deshaies JE, Shkreta L, Moszczynski AJ, Sidibe H, Semmler S, Fouillen A, Bennett ER, Bekenstein U, Destroismaisons L, Toutant J, et al. TDP-43 regulates the alternative splicing of hnRNP A1 to yield an aggregation-prone variant in amyotrophic lateral sclerosis. Brain. 2018;141:1320–33. doi:https://doi.org/10.1093/brain/awy062.
- Grunow R, D’Apuzzo M, Wyss-Coray T, Frutig K, Pichler WJ. Cell surface ELISA for the screening of monoclonal antibodies. J Immunol Methods. 1994;171:93–102. doi:https://doi.org/10.1016/0022-1759(94)90232-1.
- Salminen MO, Ehrenberg PK, Mascola JR, Dayhoff DE, Merling R, Blake B, Louder M, Hegerich S, Polonis VR, Birx DL, et al. Construction and biological characterization of infectious molecular clones of HIV-1 subtypes B and E (CRF01_AE) generated by the polymerase chain reaction. Virology. 2000;278:103–10. doi:https://doi.org/10.1006/viro.2000.0640.
- Cavacini LA, Peterson JE, Nappi E, Duval M, Goldstein R, Mayer K, Posner MR. Minimal incidence of serum antibodies reactive with intact primary isolate virions in human immunodeficiency virus type 1-infected individuals. J Virol. 1999;73:9638–41. doi:https://doi.org/10.1128/JVI.73.11.9638-9641.1999.
- Pagano M, Gauvreau K. Principles of biostatistics. New York: Chapman and Hall/CRC; 2000. https://doi.org/10.1201/9780429489624.