
 ?Mathematical formulae have been encoded as MathML and are displayed in this HTML version using MathJax in order to improve their display. Uncheck the box to turn MathJax off. This feature requires Javascript. Click on a formula to zoom.
ABSTRACT
Preferential interactions of excipients with the antibody surface govern their effect on the stability of antibodies in solution. We probed the preferential interactions of proline, arginine.HCl (Arg.HCl), and NaCl with three therapeutically relevant IgG1 antibodies via experiment and simulation. With simulations, we examined how excipients interacted with different types of surface patches in the variable region (Fv). For example, proline interacted most strongly with aromatic surfaces, Arg.HCl was included near negative residues, and NaCl was excluded from negative residues and certain hydrophobic regions. The differences in interaction of different excipients with the same surface patch on an antibody may be responsible for variations in the antibody's aggregation, viscosity, and self-association behaviors in each excipient. Proline reduced self-association for all three antibodies and reduced aggregation for the antibody with an association-limited aggregation mechanism. The effects of Arg.HCl and NaCl on aggregation and viscosity were highly dependent on the surface charge distribution and the extent of exclusion from highly hydrophobic patches. At pH 5.5, both tended to increase the aggregation of an antibody with a strongly positive charge on the Fv, while only NaCl reduced the aggregation of the antibody with a large negative charge patch on the Fv. Arg.HCl reduced the viscosities of antibodies with either a hydrophobicity-driven mechanism or a charge-driven mechanism. Analysis of this data presents a framework for understanding how amino acid and ionic excipients interact with different protein surfaces, and how these interactions translate to the observed stability behavior.
Introduction
Formulating monoclonal antibodies (mAbs) at high concentrations may allow delivery via subcutaneous injection, but at high concentrations these formulations may exhibit reduced stability and increased viscosity.Citation1 Irreversible aggregation of proteins can provoke an immune response.Citation2 Subcutaneous injection typically requires viscosities below 15–20 cP.Citation1 Antibody viscosity might be due to electrostatic interactions, with oppositely charged regions interacting and leading to electrostatic association, or due to short-range hydrophobic interactions that promote self-association, or both.Citation3
Excipients can be added to mAb formulations to influence the aggregation and viscosity of the solution.Citation4 Common excipient classes include amino acids and electrolytes because charges on the antibody surface are thought to influence protein-protein interactions, and thus aggregation and viscosity.Citation5 In some cases, the addition of salts can lead to charge screening, which reduces attractive protein-protein interactions.Citation6 Charged amino acids, such as arginine hydrochloride (Arg.HCl), have been found to interact with charged residues as well as with hydrophobic residues via cation-π interactions.Citation7
Molecular dynamics (MD) simulations can be used to model antibody-excipient interactions, but they require accurate force field parameters. Numerous force fields exist for simulating proteins, including the widely-used CHARMMCitation8 and AmberCitation9 force fields. Extensive work is put into developing force field parameters, which are typically based on a combination of quantum calculations and experimental data.Citation10 One type of experimental data that can be used to validate force field parameters involving protein-excipient-water mixtures is the preferential interaction coefficient (.Citation11
Timasheff and others have studied the preferential interactions of certain sugars and polyols with small proteins using preferential interaction theory.Citation12–14 It is hypothesized that the exclusion of these osmolytes from the protein surface favors the native, folded state to minimize the exposed surface area. This may lead to a reduction in aggregation, depending on the aggregation mechanisms. The preferential interaction coefficient of antibody-excipient mixtures can be measured experimentally via vapor pressure osmometry,Citation15 and is also accessible via simulation.Citation11
Numerous experimentalCitation16-Citation19 and simulationCitation6,Citation7,Citation20–23 studies have been performed on the effects of amino acid and ionic excipients on proteins. However, many of the studies that have been performed focus on how excipients interact with only one or two proteins. Even when comparing excipient effects across multiple proteins, they infrequently investigate the reasons for differences in behavior. For example, Wang et al. studied the viscosity behavior of two antibodies.Citation6 They noted that the salt-form excipients reduced the viscosity of one antibody much more than the other and speculated that this was due to the protein-protein interaction mechanisms, but did not elaborate or investigate the antibody surface properties that might have accounted for this difference. Other studies have specifically focused on how the antibody sequence and structure affect aggregation and viscosity, but these studies do not also discuss excipient behavior.Citation3,Citation24–Citation26
This study aims to examine the connection between antibody surface properties and excipient interactions. While trends in the impact of certain ionic and amino acid excipients on mAbs have been studied experimentally,Citation16,Citation17,Citation18,Citation19 and trends in the impact of antibody sequences and structures have been studied,Citation3,Citation25,Citation27 the molecular mechanisms behind the impact of excipients on mAb behavior are not well understood. Here, we use simulations and experiments to investigate the mechanisms by which three common amino acid and ionic excipients (proline, Arg.HCl, and NaCl) affect the aggregation and viscosity of three antibodies studied previously.Citation11,Citation15,Citation28 By examining multiple antibodies, we can assess how the excipients interact with different antibody surfaces to identify molecular mechanisms underlying the behavior.
Results
Antibody characteristics
Three IgG1 antibodies (mAbs A, B and C) were considered in this study. These antibodies differed in sequence only in the antigen-binding fragment (Fab) domains. mAbs A and B have κ-type light chains, while mAbC has λ-type light chains. Due to the sequence similarity of these antibodies outside of the variable (Fv) domain, this work focused on differences between the variable domains of these antibodies. All formulations considered were compared to the buffer conditions, 25 mM sodium acetate (NaOAc), pH 5.5. Characteristics of the antibody structures, including net charges, pI, spatial aggregation propensity (SAP)Citation25 scores, and spatial charge map (SCM)Citation3 scores, are summarized in . Visualizations of the antibody Fv domains, viewed side-on to ensure that all complementarity-determining regions (CDRs) are included in the view, are shown in , colored by the atomic SAP and SCM scores.
Table 1. mAb characteristics, calculated from the structures of the entire antibodies. pI data from Sudrik et al.Citation28.
Figure 1. Views of the Fv domains, side-on, as indicated by the eyeball in the inset, so that the figures include all complementarity-determining regions. The figures are colored by the atomic SAP and atomic SCM scores. Each antibody has some hydrophobic regions on the Fv, indicated by red coloring in the SAP figures, although mAbC has the most exposed hydrophobicity. The SCM coloring indicates mostly positive charge (blue) on mAbA, both positive and negative charges on mAbB, and mostly negative charge on mAbC.
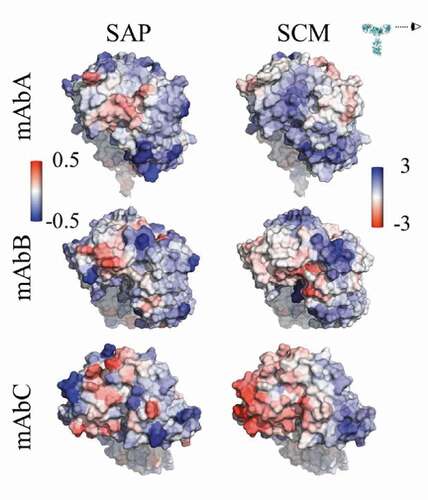
While all three antibodies have some exposed hydrophobic and hydrophilic regions on the Fv domains, mAbC has the most exposed hydrophobic area, indicated by the red coloring in the SAP figures in . Despite the similar net charges (+7 and +6) of the Fv domains of mAbs A and B, indicates that primarily positive charge is exposed in the Fv domain of mAbA, shown by blue SCM coloring. mAbB has some exposed positive and negative charge, while mAbC has a significant amount of exposed negative charge.
Parameter set development and preferential interactions
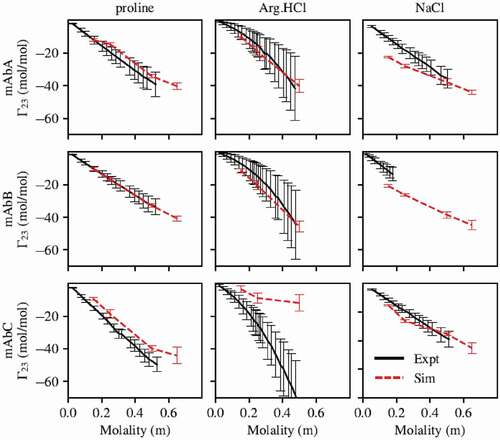
Experimental results indicated that proline and Arg.HCl were preferentially excluded from all three antibodies, as shown in . However, simulations performed using the parameters for Arg.HCl and proline from the CHARMM36m force field unexpectedly indicated preferential interaction coefficients that were much higher than experimentally determined values, and in some cases indicated preferential inclusion (Figure S1). We found that proline-protein interactions needed to be reduced and proline-water interactions strengthened, because proline was too included. We found that arginine-protein interactions needed to be reduced and arginine-arginine self-interactions increased, because Arg.HCl was too included and did not display a quadratic dependence on Arg.HCl concentration. These changes were achieved by modifying the Lennard-Jones parameters for the excipient atoms, as these affect nonbonded interactions. Changes to the partial charges of the atoms were also considered, but the preferential interaction coefficient was relatively insensitive to modifications to the partial charges. Note that for both proline and Arg.HCl, the parameter set developed was used for the excipient molecules, while the original CHARMM36m force field was used for all amino acids in the antibody molecule.
Figure 2. Preferential interaction coefficients of mAbs A, B, and C with proline, arginine, and NaCl. Simulations with proline and arginine were performed using the force field parameters previously described. Parameters for all other atoms are from the CHARMM36m force field. With the exception of mAbC in Arg.HCl, there is generally good agreement between simulation and experiment. Experimental measurement of of mAbB in NaCl was only carried out below about 0.2 m NaCl due to phase separation at higher NaCl concentrations.
For proline, the ε values for all atoms were scaled by 0.6 compared to those of the CHARMM36m force field. Additionally, the σ values for the N, H, and O atoms of the C- and N-termini were set as specified in . σ values for all other atoms, including alkyl hydrogens, were the same as in the CHARMM36m force field. Note that specifies different σ values for non-water, “general”, and water interactions. Effectively, this means that the σ values in the topology file was updated to the “general” value, and NBFIX terms were specified for interactions of these atoms with water atoms, using the σ value from the “water” column and the appropriate mixing rule. This approach was necessary to achieve the proper balance of proline-protein and proline-water interactions. More than 350 possible parameter sets for proline were tested, each involving different combinations of modifications to the partial charges, σ, and ε, with the parameter set given in most accurately reproducing the results.
For Arg.HCl, most σ values were scaled by 1.05. The exceptions were the σ values for the following atoms involved in Arg.HCl-Arg.HCl interactions: N (N-terminal), H (N-terminal), O (C-terminal), and Cl. Additionally, several modifications were made to the ε values of these atoms, as summarized in . More than 600 possible parameter sets for Arg.HCl were tested, each involving different combinations of modifications to the partial charges, σ, and ε, with the parameter set given in most accurately reproducing the results.
Table 2. σ (nm) values for proline.
Table 3. Force field parameters for Arg.HCl. Note that the σ values for all Arg atoms (except for N, H, O, and Cl interactions with other Arg.HCl molecules or water) were scaled by 1.05.
The performance of these parameter sets, as well as of the CHARMM36m parameter set for NaCl, in modeling the preferential interactions of mAbs A, B, and C with proline, Arg.HCl, and NaCl is shown in . The experimental results for with Arg.HCl and NaCl are taken from our previous study.Citation15 With the exception of mAbC in Arg.HCl, there is generally good agreement between simulation and experiment, indicating that the simulations are capturing the appropriate level of excipient exclusion.
No parameter set considered accurately modeled the behavior of Arg.HCl with mAbs A, B, and C. Figure S1 shows the
behavior with the CHARMM36m parameters, the fitted parameter set described in , and a third parameter set labeled set 1. This third parameter set is shown to demonstrate how parameter sets that better captured Arg.HCl exclusion from mAbC perform less well on mAbs A and B. This particular parameter set failed at lower concentrations, where it indicated a local maximum near an excipient concentration of 0.25 m, which disagreed with the experimental
curve. Additionally, this parameter set was significantly more different from the CHARMM36m parameter set, as it involved modifications to σ values as well as scaling all ε values by 0.7. Because mAbC is known to be a poorly behaved molecule and known to self-associate,Citation11,Citation29 we considered it possible that there are important protein-protein interactions occurring that are not captured in our simulations, and thus we selected the parameter set that best captured the exclusion of Arg.HCl from mAbs A and B. However, we did examine the local interactions of Arg.HCl with the Fv domain using both the fitted parameter set and parameter set 1, as shown in Figure S2. We have the most confidence in the local interactions that appear similar for mAbC with both these parameter sets.
Proline-antibody interactions
Local  with Fv residues
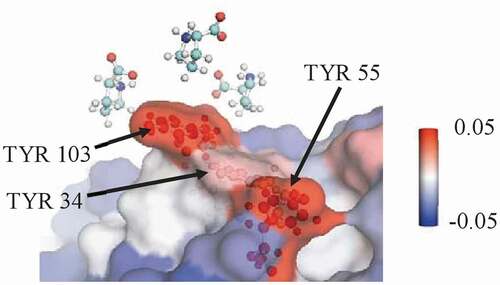
The summed local values for proline’s interactions with various types of residues in the Fv domains of mAbs A, B, and C are given in , calculated from simulations of the entire antibody molecule in 0.15 m excipient. Proline is net excluded from the Fv domain of these antibodies. Additionally, proline is net excluded from all residue types considered within the Fv domain: hydrophobic residues, aromatic residues, polar uncharged residues, and charged residues. However, the extent of exclusion varies, with less exclusion of proline observed near hydrophobic residues, and especially aromatic residues. A representative snapshot of proline interacting with aromatic residues in the CDR is shown in . mAbB has several aromatic residues in the CDR that are highly exposed, which may contribute to proline’s stronger interactions with these residues. The net local
value of proline with the three labeled TYR residues is 0.13 ± 0.01, indicating that proline is included near these residues. This is significantly higher than the interaction that would be expected if proline interacted an average amount with all residues on the antibody Fv surface, which would lead to a local
value of −0.07 ± 0.01 with this same region. This value was calculated by averaging the local
values with all exposed residues in the Fv domain and then summing that value over the three TYR residues being considered.
Figure 3. Sums of the local values for different types of residues in the Fv domains. Values taken from simulations with the excipients at 0.15 m bulk concentration. For all three antibodies, proline is net excluded from all types of residues in the Fv. Interestingly, for all three antibodies, Arg.HCl and NaCl show opposite net inclusion/exclusion behaviors with negative residues.
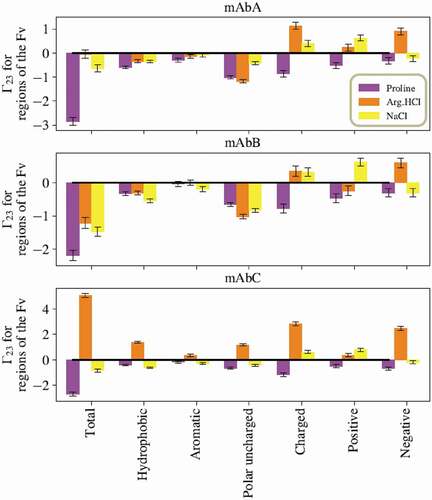
Figure 4. A representative snapshot from a simulation of mAbB in 0.5 m proline showing a view of part of the Fv domain. It shows several proline excipient molecules interacting with exposed TYR residues. The local value with the three labeled TYR residues is 0.13 ± 0.01, which is significantly higher than the expected interaction if proline interacted only an average amount (−0.07 ± 0.01). Antibody residues are colored by the local Γ23 value.
Aggregation
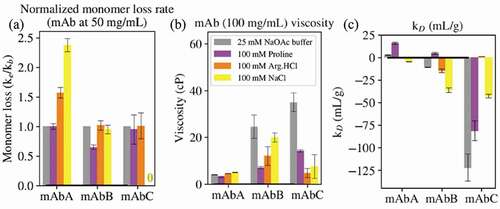
The impact of 100 mM proline on antibody aggregation is shown in ). Proline has no effect on the monomer loss rate of mAbA, reduces the monomer loss rate of mAbB, and has no effect on that of mAbC. The ability of proline to reduce the aggregation of mAbB is likely related to the mAbB aggregation mechanism. As shown in Figure S3, mAbB has an association-limited aggregation rate, demonstrated by the increase in aggregation rate with increasing antibody concentration. Proline colloidally stabilizes all three antibodies, but only reduces the aggregation rate of mAbB because mAbB is the only antibody with an association-limited aggregation rate. Additionally, the simulation results indicated that proline is slightly included near certain aromatic residues in the mAbB Fv domain, as shown in . These interactions might contribute to the reduction in aggregation of mAbB observed in the presence of proline. Note that the aggregation rate of mAbC was measured at 42.5°C, while that of mAbs A and B was measured at 52.5°C, due to the significantly higher aggregation rate of mAbC.Citation15 Therefore, while the direction of the effects of each excipient on the behavior of each mAb can be compared, the magnitude of the effects will be different for mAbC due to the lower incubation temperature.
Figure 5. (a) The ratio of monomer loss rates in the presence of 100 mM excipient (ke) and in buffer alone (kb, 25 mM sodium acetate, pH 5.5) was determined at 52.5°C for mAbs A and B and 42.5°C for mAbC. (b) The viscosity of the antibodies at 100 mg/mL in buffer alone or in 100 mM excipient. (c) The diffusion interaction parameter kD. For mAbs, values below −8.9 mL/g indicate attractive self-interactions.
Viscosity
The impact of 100 mM proline on antibody viscosity is shown in ). Proline had little effect on the viscosity of mAbA, but reduced the viscosities of mAbs B and C. Due to the low (5 cP or less) viscosity of mAbA in the 25 mM NaOAc buffer, pH 5.5, as well as in the presence of all three excipients, the very slight effects of the excipients on the viscosity of mAbA were not further considered. The reduction in viscosity of mAbB is likely related to the interactions of proline with the exposed hydrophobic residues shown in .
shows the SCM of the Fv domain of mAbC, indicating a large negatively charged region on the left-hand side. Figure 6(b) shows where proline interacts with mAbC, with the regions of strongest inclusion toward the top of the figure shown in red. In simulations with a bulk excipient concentration of 0.15 m, the net Γ23 value for proline’s interactions with the negatively charged patch is . The mechanism by which proline reduces the viscosity of mAbC may be through the interactions of the zwitterionic proline molecule with this charged patch, as these interactions may disrupt charge-charge interactions that led to elevated viscosity.
Reversible self-association
The impact of 100 mM proline on antibody reversible self-association (RSA), as quantified by measuring kD, is shown in ). Proline increased the kD value of all three antibodies, which is supportive of reduced RSA tendency for all three antibodies. As mentioned above, this increase in kD suggests an improvement in colloidal stability in all three antibodies.
Arg.HCl-antibody interactions
Local with Fv residues
The summed local values for Arg.HCl’s interactions with various types of residues in the Fv domains of mAbs A, B, and C are given in , calculated from simulations of the entire antibody molecule in 0.15 m excipient. Arg.HCl has a net
value of about zero for the entire Fv domain of mAbA, is net excluded from the Fv domain of mAbB, and is net included near the Fv domain of mAbC. For mAbA, Arg.HCl is very slightly net excluded from hydrophobic residues, has a near zero
with aromatic residues, and is more strongly excluded from polar uncharged residues. Arg.HCl is net included near both positively and negatively charged residues of mAbA. Many of these trends hold for mAbB, with the exception of positively charged residues. With mAbB, Arg.HCl is excluded from positively charged residues. For mAbC, Arg.HCl is included near all residue types considered, although the lowest
values are observed with aromatic and positively charged residues.
Aggregation
The impact of 100 mM Arg.HCl on antibody aggregation is shown in ). Arg.HCl increases the aggregation rate of mAbA, but has no effect on the aggregation rates of mAbs B and C. mAbA has the highest positive charge in the variable region of the three antibodies, with a net charge of +7 in the Fv domain, and shows that mAbA has primarily positively charged patches in the Fv, shown by the blue coloring of the SCM. All three antibodies have net charges of +12 in the Fc domain at pH 5.5. Therefore, Arg.HCl likely leads to charge screening of the positive charged domains of mAbA, reducing electrostatic repulsion between antibody molecules compared to behavior in the absence of Arg.HCl. This is supported by the net inclusion of Arg.HCl near charged residues in mAbA as shown in .
The observation that Arg.HCl does not affect the aggregation behavior of mAbB suggests that electrostatics may not be a primary contributor to mAbB aggregation. It is interesting to note that Arg.HCl does not reduce the aggregation rate of mAbC, as that molecule is known to have strongly negatively charged patches on the Fv domain, and because NaCl does reduce its aggregation rate. This may be related to the interactions of Arg.HCl with hydrophobic residues on the antibody. As shown in , Arg.HCl is net included near the hydrophobic and aromatic residues in the Fv domain of mAbC. To examine this further, we examined these interactions in the context of local SAP scores. ) shows the SAP scores mapped onto the Fv domain of mAbC, with the highest-SAP region circled. We projected the local of Arg.HCl onto the Fv domain of mAbC, as shown in ). These values are taken from simulations of the whole antibody in the presence of 0.15 m Arg.HCl. Arg.HCl is slightly included with this circled high-SAP patch, with a net
value of 0.07 ± 0.03. Inclusion of excipient can lead to conformational destabilization.Citation15 Arg.HCl has no effect on the aggregation of mAbC, though, likely due to this conformational destabilization being balanced by electrostatic interactions elsewhere. In contrast, NaCl, which does reduce the aggregation of mAbC, is excluded from this patch.
Viscosity
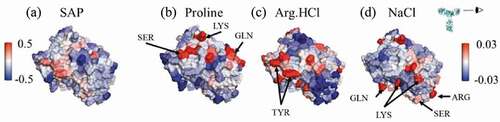
The impact of 100 mM Arg.HCl on antibody viscosity is shown in ). Arg.HCl has negligible impact on the viscosity of mAbA and reduces the viscosity of mAbs B and C. Interestingly, Arg.HCl reduces the viscosity of mAbB by about 50%, less of a reduction than in proline (70% reduction). This suggests that the viscosity of mAbB is not primarily due to electrostatic effects. It is also interesting to note that NaCl reduces the viscosity of mAbB by only about 20%, suggesting that the ability of Arg.HCl to reduce the viscosity of mAbB is not only due to its ionic nature, but also due to its other interactions. (a) shows the variable region of mAbB colored by the SAP score. As shown in Figure 8, Arg.HCl interacts more strongly with the high-SAP residues than NaCl. As shown in , Arg.HCl interacts with hydrophobic and aromatic residues of mAbB to a similar extent as proline. These interactions may contribute to the observed reduction in viscosity of mAbB.
Arg.HCl very effectively reduces the viscosity of mAbC, reducing it by about 85% compared to the viscosity in the 25 mM NaOAc buffer. The molecular dynamics simulations indicated where Arg.HCl interacts with mAbC. Specifically focusing on the Fv domain, ) shows the Fv domain of mAbC colored by the local values in the presence of 0.15 m Arg.HCl. Comparison with ), which shows the mAbC Fv domain colored by the SCM scores, indicates that Arg.HCl interacts strongly with the negatively charged patch shown in red, with a net
value of 1.4 ± 0.1. This suggests that the ability of Arg.HCl to reduce the viscosity of mAbC may be related to its ability to interact electrostatically.Citation29
Figure 6. Views of the variable region of mAbC. (a) Coloring indicates SCM values, with red coloring indicating exposed negative charge. (b)-(d) Coloring indicates local Γ23 values for proline, Arg.HCl, and NaCl, respectively, with bulk excipient concentrations of 0.15 m. Red indicates preferential inclusion. All three excipients show some positive interactions with at least part of the negatively charged patch shown in (A). Views are of the Fv domain, side-on, as indicated by the eyeball in the inset, so that the figures include all complementarity-determining regions.
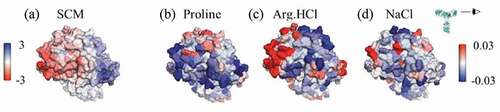
Figure 7. Views of a portion of the mAbC Fv. (a) is colored by the SAP score, with red indicating exposed hydrophobicity. (b) and (c) are colored by the local values with Arg.HCl and NaCl, respectively, with red indicating inclusion. Values are taken from simulations with bulk excipient concentrations of 0.15 m. Arg.HCl is net included in the circled high-SAP patch (
), while NaCl is net excluded from this patch (
). Views are of the Fv domain, side-on, so that the figures include all complementarity-determining regions, albeit from a slightly higher angle than in so as to view the whole high-SAP region, circled.
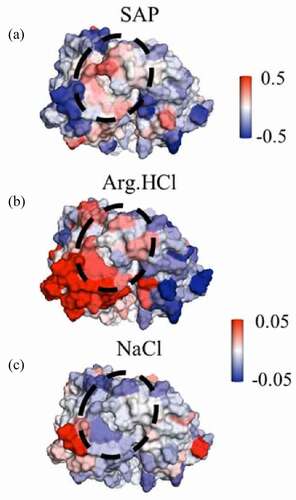
Figure 8. Views of the variable region of mAbB. (a) Coloring indicates SAP values, with red coloring indicating exposed hydrophobic regions. (b)-(d) Coloring indicates local Γ23 values for proline, Arg.HCl, and NaCl, respectively, with bulk excipient concentrations of 0.15 m. Red indicates preferential inclusion. Views are of the Fv domain, side-on, as indicated by the eyeball in the inset, so that the figures include all complementarity-determining regions.
Reversible self-association
The impact of 100 mM Arg.HCl on the reversible self-association of the antibodies is shown in ). Compared to behavior in the buffer alone, the addition of Arg.HCl slightly reduces the kD value of mAbA to approximately zero, has little effect on that of mAbB, and greatly increases the kD value of mAbC to approximately zero. This corresponds to a slight increase in antibody-antibody interactions in the presence of Arg.HCl for mAbA, no effect for mAbB, and a large reduction in antibody-antibody interactions for mAbC.
The slight increase in mAbA antibody-antibody interactions in the presence of Arg.HCl agrees with the proposed mechanism by which Arg.HCl increases the aggregation of mAbA described in the aggregation section. This mechanism suggested that the addition of Arg.HCl might lead to charge shielding, decreasing electrostatic repulsion between antibodies. While reversible self-association events do not necessarily lead to the formation of irreversible aggregates, aggregate formation does require antibody-antibody interactions.
The lack of an effect of Arg.HCl on the kD value of mAbB agrees with the above proposed association-limited aggregation mechanism for mAbB, indicated in Figure S3. Because Arg.HCl does not reduce the self-association rate of mAbB, it also should not reduce the aggregation rate of mAbB.
The large impact of Arg.HCl on the self-association behavior of mAbC is interesting, especially in light of the lack of impact of Arg.HCl on the aggregation rate of mAbC. Arg.HCl is net included near the surface patch identified by Arora et al. as being involved in RSA, with a net local value of 0.4 ± 0.1 near this patch, based on a simulation of mAbC in 0.15 m Arg.HCl. This strong inclusion of Arg.HCl near the region involved in RSA likely leads to the large increase in kD. However, as shown in Figure S3, the aggregation rate of mAbC is not dependent on the concentration of mAbC. This suggests that mAbC has an unfolding-limited aggregation mechanism. Thus, despite the decreased antibody-antibody interactions in the presence of Arg.HCl, there is no impact on the aggregation rate.
NaCl-antibody interactions
Local with Fv residues
The summed local values for NaCl’s interactions with various types of residues in the Fv domains of mAbs A, B, and C are given in , calculated from simulations of the entire antibody molecule in 0.15 m excipient. NaCl exhibits the same trends in behaviors for all three antibodies, although the magnitudes of net inclusion and exclusion vary. The summed
value for NaCl with all residues in the Fv domain is negative for all three antibodies, indicating net exclusion. Additionally, NaCl is net excluded from hydrophobic, aromatic, and polar uncharged residues. NaCl is net included near charged residues as a whole and near positive residues, but is slightly excluded from negatively charged residues.
Aggregation
The impact of 100 mM NaCl on antibody aggregation is shown in ). The presence of NaCl increases the aggregation rate of mAbA, has no effect on that of mAbB, and virtually eliminates the aggregation of mAbC. As described in the section on the effects of Arg.HCl on aggregation, mAbA has net positive charges in the Fv domain and the Fc domain, leading to electrostatic repulsion between molecules in the absence of excipient. NaCl can act to screen some of that charge, thus reducing electrostatic repulsion between antibody molecules and contributing to the elevated viscosity observed in the presence of NaCl.
The lack of an effect of NaCl on the aggregation of mAbB suggests that charge effects are not primary contributors to the aggregation of mAbB. Conversely, for mAbC, the effective elimination of aggregation observed in the presence of NaCl suggests that charge effects do significantly contribute to the aggregation of mAbC.
Viscosity
The impact of 100 mM NaCl on antibody viscosity is shown in ). NaCl has little impact on the viscosity of mAbA, slightly reduces the viscosity of mAbB, and greatly reduces the viscosity of mAbC. As described above, mAbA had viscosities of 5 cP or less in 25 mM NaOAc buffer alone or in the presence of any of the excipients, and thus its viscosity behavior will not be further discussed.
NaCl reduced the viscosity of mAbB by about 20%. This, combined with the results with proline (70% reduction), suggests that charge effects are not primarily responsible for the viscosity behavior of mAbB. However, the ability of NaCl to slightly affect the viscosity of mAbB indicates that charge effects might be a secondary contributor to the viscosity behavior of mAbB.
NaCl reduced the viscosity of mAbC by about 80%, similar to the reduction in viscosity observed in the presence of Arg.HCl (85%). These results suggest that the viscosity of mAbC is primarily due to charge effects. The simulation results indicate that NaCl interacts strongly with a portion of the negatively charged patch on the mAbC Fv domain, as shown in ). The net local value with the entire negatively charged patch is 0.1 ± 0.1. While this is close to zero, this is significantly more inclusion than the “average” interaction with mAbC, as NaCl is net excluded from the entire Fv domain and from the entire mAb molecule. Thus, these interactions with the negatively charged patch on mAbC may contribute to the reduction in the viscosity of mAbC through charge shielding.
Reversible self-association
The impact of 100 mM NaCl on the kD values of the antibodies are shown in ). Compared to the behaviors of the antibodies in the 25 mM NaOAc buffer alone, NaCl decreases the kD values of mAbs A and B, but increases that of mAbC. This corresponds to an increase in antibody-antibody interactions for mAbs A and B, but a decrease in antibody-antibody interactions for mAbC. The observed increase in antibody-antibody interactions for mAbA agrees with the observed increase in aggregation for mAbA in the presence of NaCl. Although the aggregation rate of mAbA is not association-limited, as demonstrated in Figure S3, the presence of NaCl may lead to charge shielding, contributing to the association of the partially-unfolded forms of mAbA and thus leading to irreversible aggregation.
It is interesting that the increase in mAbB self-association observed in the presence of NaCl does not lead to an increase in mAbB aggregation. Figure S3 indicates that the aggregation of mAbB is association-limited, which would suggest that increased self-association might lead to increased aggregation. It is possible that the presence of NaCl interferes with other interactions that contribute to aggregation.
The reduction in self-association of mAbC in the presence of NaCl agrees with a previous study that found that the self-association of mAbC was primarily driven by charge effects.Citation29 ) indicates that NaCl is slightly included near a portion of the strongly negatively charged patch on the Fv.
Discussion
Parameter set development and preferential interactions
Parameter set development is a multivariable optimization problem, with a single set of parameters attempting to lead to a model that will match all experimental properties. However, because the force fields are inherently simplifications of the real quantum interactions, they cannot necessarily match all experimental behavior. One potential reason that the CHARMM36m force field did not accurately capture the values for mAbs A, B, and C with proline and Arg.HCl is that the force field was developed primarily to model peptides and whole proteins rather than free residues.Citation8 MacKerell et al. found that they needed to include properties of crystal structures in parameter development. Later, they also tweaked parameters based on MD studies of proteins.Citation30 Thus, the CHARMM36m parameters may not be well-suited to modeling free zwitterionic amino acids in dilute solution, which may be why they overpredicted antibody-excipient interactions. Others have performed molecular dynamics simulations of zwitterionic amino acids in solution and found that doing so accurately required adjusting force field parameters.Citation31,Citation32
It is possible that parameter sets other than those described here for free proline and free Arg.HCl will accurately reproduce the experimental behavior for these excipients with the antibodies. This is the reason that the parameter sets developed for proline and Arg.HCl were kept as close as possible to the CHARMM36m parameters while still improving the accuracy in modeling the overall
values. However, testing the parameter set on multiple antibodies helps to support the validity of the force field, as each antibody has different exposed residues, particularly in the Fv domain.
This result also demonstrates an important limitation in existing force field parameters. As discussed above, existing force fields such as CHARMM focus on accurately modeling proteins in water, but do not consider the presence of cosolute molecules.Citation10,Citation33 Here, we have demonstrated that protein-cosolute preferential interaction coefficients can be used as an additional experimental property in the development and optimization of force field parameters.
Antibody-excipient interactions
This study found that the impact of an excipient on an antibody was highly dependent on the antibody. That is, the same excipient can have very different impacts on different antibodies. For example, NaCl increased the aggregation rate of mAbA but virtually eliminated the aggregation of mAbC. This variability in the impact of an excipient is what leads to the use of high-throughput screening for antibody formulations and other techniques to experimentally measure antibody behavior in the presence of different excipients.Citation34,Citation35
The experimental stability properties of the antibodies depend on a balance of antibody-antibody, antibody-excipient, and antibody-water interactions. The mechanisms leading to changes in these properties are not necessarily the same between antibodies. In addition, we observed no particular relationship between aggregation and viscosity behavior. For example, as indicated in , the impact of an excipient on the viscosity of an antibody could not be predicted solely from the aggregation behavior, and vice versa. This is indicative that different mechanisms may govern aggregation and viscosity behavior.
Our results suggest that there are definite trends in local protein-excipient interactions, such as the net inclusion of Arg.HCl and NaCl near charged residues, as indicated in . However, the impact of these interactions depends on how these interactions affect the underlying mechanisms of protein-protein interaction. For example, the net inclusion of NaCl near charged residues leads to charge screening. However, for mAbA, charge screening increases aggregation, as it reduces the electrostatic repulsion between molecules, while for mAbC, charge screening decreases aggregation. The surface charge distribution differs between mAbs A and C, so while the local interaction near charged residues of NaCl (inclusion) is the same for both, the resulting stability behavior is different. Therefore, in evaluating an antibody formulation, it is important to consider that antibody’s particular surface properties, including SAP and SCM, to determine the expected experimental stability properties.
Proline was the only excipient found to increase kD for all three antibodies. Because protein-protein interactions are generally influenced by a balance of long-ranged and local electrostatic and hydrophobic interactions, proline’s zwitterionic nature may allow it to influence electrostatic interactions. The combination of the zwitterionic molecule with a ring structure that can interact with hydrophobic residues may be responsible for proline’s ability to reduce protein-protein interactions for all three antibodies.Citation36–38
Interestingly, a previous study on a different mAb found that proline effectively increased colloidal stability at pH 6, but not at pH 5, which was further from the mAb pI.Citation17 The pI of the mAb in that study was 9.3. The pIs of mAbs A, B, and C are 9.1, 9.0, and 7.2, respectively.Citation11 Another study indicated that proline is a desirable excipient under stressful conditions, such as low pH, because it reduces aggregation.Citation39 Thus, proline’s impact on conformational and colloidal stability might be dependent on formulation pH and mAb pI.
Since Arg.HCl and NaCl are both ionic excipients with the same anion, it is interesting that they have different interactions with protein residues, especially with positively charged residues, as shown in . Notably, Arg.HCl has lower local values near positively charged residues for all three mAbs. As the interactions with positively charged residues are likely primarily due to Cl− interactions, this result indicates that the presence of Arg+ molecules influences the distribution of Cl− anions. The larger size of Arg+ molecules compared to Na+ ions may be partially responsible. Additionally, the clustering behavior of Arg+ moleculesCitation7,Citation40 in solution may also contribute to this result. Clusters of arginine molecules may affect the distribution of Cl− ions in solution more so than free Na+ ions, leading to fewer Cl–positive residue interactions in Arg.HCl compared to NaCl. Additionally, as indicated in , Arg.HCl is included near negatively charged residues, while NaCl is excluded. This may also be related to the clustering of arginine molecules. As described by Shukla et al., arginine molecules in solution may form clusters due to charge-charge interactions, as the C-terminus is negatively charged and both the R group and N-terminus are positively charged.Citation7 Thus, a single arginine molecule might interact with a negatively charged residue of the antibody, and meanwhile the free end of the arginine molecule may be involved in clustering.
While NaCl interacts with antibodies through charge-charge interactions, Arg.HCl interacts via charge-charge interactions and via other arginine-protein interactions, such as cation-π interactions. Previous studiesCitation41,Citation42 have shown that arginine can interact with aromatic residues through cation-π interactions. These interactions will impact antibody conformational stability and potentially the available hydrophobic surface of the antibody, thus affecting hydrophobic-hydrophobic interactions leading to aggregation. Thus, the choice of ionic formulation excipient should consider whether the excipient should interact primarily through charge-charge interactions, or whether it should also interact with certain uncharged residues.
In conclusion, we have used both simulation and experiment to examine how certain amino acid and ionic excipients interact with the surfaces of three different antibodies and examined how those interactions lead to observed aggregation and viscosity behavior. Broadly, proline colloidally stabilized all three antibodies, thus reducing the aggregation of mAbB, which has an association-limited aggregation mechanism. The impact of Arg.HCl and NaCl on aggregation primarily depended on the charge distribution in the Fv. All three excipients tended to reduce viscosity, but the effectiveness depended on whether the viscosity was due to hydrophobic effects or charge effects. The impact of Arg.HCl and NaCl on the colloidal stability of the antibodies was also strongly dependent on exposed hydrophobicity and charge in the Fv. In this way, the surface characteristics of an antibody are shown to be important in understanding potential protein-protein interaction mechanisms, and could inform formulation development studies in selecting appropriate excipients to potentially disrupt particular interactions that may negatively impact overall protein stability.
Materials and methods
Materials
MAbs A, B and C are IgG1 antibodies that differ in sequence only in the Fab domains. MAbs A and B have κ-type light chains; mAbC has λ-type light chains. Aliquots of mAbs A, B, and C were provided as purified stocks by AstraZeneca. High purity proline and glacial acetic acid (A6283) were purchased from Sigma. Buffers were prepared in 18.2 MΩ deionized water, with pH adjusted using either 5 N sodium hydroxide or hydrochloric acid. Antibodies were dialyzed in 25 mM sodium acetate buffer with the pH adjusted to 5.5 using 20 kDa molecular weight cutoff (MWCO) mini dialysis devices (88405, Thermo Scientific). The antibodies were then concentrated using 50 kDa MWCO spin concentrators (UFC505024, Amicon/Millipore). L-proline, L-Arg.HCl, and NaCl solutions were prepared in 25 mM sodium acetate buffer, pH 5.5.
Vapor pressure osmometry
The protocol for quantifying preferential interactions of the antibodies with proline is the same as that used in previous studies.Citation28 Briefly, serial dilutions of proline in buffer and solutions of antibody and proline in buffer were prepared, up to excipient concentrations of about 0.5 m. The final antibody concentration was about 50 mg/mL. The osmolality of these solutions was measured using a vapor pressure osmometer (Wescor VAPRO 5600). The resulting data were analyzed using the method of Hong et al.Citation43
Accelerated aggregation kinetics
The protocol for measuring accelerated aggregation kinetics was the same as that used previously.Citation28 Briefly, antibodies were incubated in a PCR thermal cycler at a concentration of 50 mg/mL mAb, with and without the addition of 100 mM proline to the buffer solution. The incubation temperatures (52.5°C for mAbs A and B, 42.5°C for mAbC) were chosen such that 5–10% monomer loss was observed over 10–12 days in buffer alone. These temperatures are below the Tm1 onset temperature as identified via differential scanning calorimetry. Samples were diluted to 1 mg/mL in 100 mM sodium phosphate, 200 mM L-arginine.HCl (pH 6.5) buffer and run on a TSKgel SuperSW mAb HTP column (Tosoh) with an inline MALS detector (miniDAWN TREOS, Wyatt Technology) to measure remaining monomer content.
Dynamic light scattering
The diffusion interaction parameter, kD, was estimated from the apparent diffusivity of the antibody molecule, as described previously,Citation28,Citation44 using a DynaPro Nanostar (Wyatt Technology). Diffusivity was recorded for samples with a percent polydispersity below 20 to avoid artifacts. mAbs A and B were measured at concentrations of 5–25 mg/mL. mAbC, which exhibits significant self-association, was measured at mAb concentrations only up to 5 mg/mL. At least three mAb concentrations were used to estimate kD for each formulation.
Viscosity measurements
The dynamic viscosities of the antibody formulations were measured using a DHR-3 (TA instruments) cone and plate rheometer with a 1-degree cone with 20 mm diameter. Viscosities were measured for antibody concentrations of about 130, 120, 100, and 90 mg/mL (concentrations determined with UV-Vis spectroscopy). Samples were measured with a plate temperature of 20°C and using shear rates within the 800–2000 s−1 range. Viscosities of three independent samples were measured for each data point to account for instrumental and loading errors.
Molecular simulations
Antibody structures were generated from primary sequences provided by AstraZeneca, as described previously.Citation15 Simulations were set up as described in Cloutier et al.Citation11 All-atom whole antibody structures were generated using the methods of Brandt et al.Citation45 from either the Fab structures (mAbA protein data bank (PDB) code: 4ypg, mAbC PDB code: 5anm) or from a homology model of the Fv domain generated using the RosettaAntibody protocol.Citation46 The Fab or Fv structures were attached to an IgG1 antibodyCitation47 template using text editing software. Simulations were performed using Gromacs 5.0.5Citation48 using the CHARMM36mCitation33 parameter set for antibody atoms and NaCl and the TIP3PCitation49 water model. Parameters used for the excipients Arg.HCl and proline were developed based on the CHARMM36m parameter set. Simulations were performed in the NpT ensemble at 1 atm and 298 K. The pH was set to 5.5 by adjusting the protonation states of ionizable residues using the PROPKACitation50 framework. All simulation boxes were made charge-neutral by the addition of Cl− counterions. All simulations were energy minimized and equilibrated for 15 ns prior to the beginning of production simulations.
Preferential interaction coefficient calculation from simulation
The preferential interaction coefficient, Γ23, of an antibody with an excipient can be calculated according to Equationequation 1(1)
(1) , as described by Baynes and TroutCitation51 and Shukla et al.Citation52
The subscript 1 refers to water, 2 to protein, and 3 to excipient. is the number of molecules of type i within a distance r or the protein van der Waals surface.
converges to a constant value past some cutoff distance R, usually around 8 Å, as shown in Figure S4. For this study, all
results are reported at
Å. This converged value can be compared to the experimental result obtained with vapor pressure osmometry.
For ionic excipients, the values were calculated separately for each molecule and then combined using Equationequation 2
(2)
(2) .
In this equation, and
refer to the preferential interaction coefficients for the cation and anion, respectively, calculated according to Equationequation 1
(1)
(1) .
is the net charge of the protein.
Local preferential interaction coefficients for each residue were determined by assigning each water molecule, based on center of mass, and each excipient atom, based on the center of each atom, to the closest antibody residue. Then, the total number of excipient atoms assigned to each antibody residue was totaled and divided by the number of atoms per excipient molecule, allowing for fractions of excipient molecules to be assigned to antibody residues. This approach allowed for a single excipient molecule to contribute to interactions with multiple antibody residues, depending on the proximity of individual atoms. Finally, the local values were calculated using Equationequations 1
(1)
(1) and Equation2
(2)
(2) .
Antibody surface analysis
The spatial aggregation propensity (SAP), which is a measure of the surface-exposed hydrophobicity, was calculated using the methods of Chennamsetty et al.Citation25 with a radius of 5 Å, the distance found by Chennamsetty et al. to best correlate with experimental aggregation behavior. The equation to calculate the SAP score of each atom is:
The spatial charge map (SCM), which measures charge distribution while accounting for surface exposure, was calculated using the methods of Agrawal et al.Citation3 using a radius of 10 Å, the distance found by Agrawal et al. to best correlate with experimental viscosity. The equation used to calculate SCM for each atom is:
Abbreviations
| Arg.HCl | = | arginine.HCl |
| CDR | = | complementarity-determining region |
| Fab | = | fragment antigen binding |
| Fv | = | fragment variable |
| mAb | = | monoclonal antibody |
| MD | = | molecular dynamics |
| MWCO | = | molecular weight cutoff |
| PDB | = | Protein Data Bank |
| RSA | = | reversible self-association |
| SAP | = | spatial aggregation propensity |
| SCM | = | spatial charge map |
Supplemental Material
Download PDF (219.9 KB)Acknowledgments
This work was funded by AstraZeneca.
Supplementary material
Supplemental data for this article can be accessed on the publisher’s website.
References
- Shire SJ, Shahrokh Z, Liu J. Challenges in the development of high protein concentration formulations. J Pharm Sci. 2004;93:1390–12. doi:https://doi.org/10.1002/jps.20079.
- Daugherty AL, Mrsny RJ. Formulation and delivery issues for monoclonal antibody therapeutics. Adv Drug Deliv Rev. 2006;58:686–706. doi:https://doi.org/10.1016/j.addr.2006.03.011.
- Agrawal NJ, Helk B, Kumar S, Mody N, Sathish HA, Samra HS, Buck PM, Li L, Trout BL. Computational tool for the early screening of monoclonal antibodies for their viscosities. MAbs. 2016;8:43–48. doi:https://doi.org/10.1080/19420862.2015.1099773.
- Kamerzell TJ, Esfandiary R, Joshi SB, Middaugh CR, Volkin DB. Protein-excipient interactions: mechanisms and biophysical characterization applied to protein formulation development. Adv Drug Deliv Rev. 2011;63:1118–59. doi:https://doi.org/10.1016/j.addr.2011.07.006.
- Yadav S, Laue TM, Kalonia DS, Singh SN, Shire SJ. The influence of charge distribution on self-association and viscosity behavior of monoclonal antibody solutions. Mol Pharm. 2012;9:791–802. doi:https://doi.org/10.1021/mp200566k.
- Wang S, Zhang N, Hu T, Dai W, Feng X, Zhang X, Qian F. Viscosity-lowering effect of amino acids and salts on highly concentrated solutions of two IgG1 monoclonal antibodies. Mol. Pharm. 2015;12:4478–87. doi:https://doi.org/10.1021/acs.molpharmaceut.5b00643.
- Shukla D, Trout BL. Interaction of arginine with proteins and the mechanism by which it inhibits aggregation. J Phys Chem B. 2010;114:13426–38. doi:https://doi.org/10.1021/jp108399g.
- MacKerell AD, Bashford D, Bellott M, Dunbrack RL, Evanseck JD, Field MJ, Fischer S, Gao J, Guo H, Ha S, et al. All-atom empirical potential for molecular modeling and dynamics studies of proteins†. J Phys Chem B. 1998;102:3586–616. doi:https://doi.org/10.1021/jp973084f.
- Ponder JW, Case DA. Force fields for protein simulations. Adv Protein Chem. 2003;66:27–85.
- Yin D, Mackerell AD. Combined Ab initio/empirical approach for optimization of Lennard-Jones parameters. J Comput Chem. 1998;19:334–48. doi:https://doi.org/10.1002/(SICI)1096-987X(199802)19:3<334::AID-JCC7>3.0.CO;2-U.
- Cloutier T, Sudrik C, Mody N, Sathish HA, Trout BL. Molecular computations of preferential interaction coefficients of IgG1 monoclonal antibodies with sorbitol, sucrose, and trehalose and the impact of these excipients on aggregation and viscosity. Mol Pharma. 2019;16:3657–64. doi:https://doi.org/10.1021/acs.molpharmaceut.9b00545.
- Lee JC, Timasheff SN. The stabilization of proteins by sucrose. J Biol Chem. 1981;256:7193–201.
- Xie G, Timasheff SN. Mechanism of the stabilization of ribonuclease A by Sorbitol: preferential hydration is greater for the denatured than for the native protein. Protein Sci. 1997;6:211–21. doi:https://doi.org/10.1002/pro.5560060123.
- Xie G, Timasheff SN. The thermodynamic mechanism of protein stabilization by trehalose. Biophys Chem. 1997;64:25–43. doi:https://doi.org/10.1016/S0301-4622(96)02222-3.
- Sudrik C, Cloutier T, Pham P, Samra HS, Trout BL. Preferential interactions of trehalose, L-arginine.HCl and sodium chloride with therapeutically relevant IgG1 monoclonal antibodies. MAbs. 2017;9:1155–68. doi:https://doi.org/10.1080/19420862.2017.1358328.
- Dear BJ, Hung JJ, Truskett TM, Johnston KP. Contrasting the influence of cationic amino acids on the viscosity and stability of a highly concentrated monoclonal antibody. Pharm Res. 2017;34:193–207. doi:https://doi.org/10.1007/s11095-016-2055-5.
- Hung JJ, Dear BJ, Dinin AK, Borwankar AU, Mehta SK, Truskett TT, Johnston KP. Improving viscosity and stability of a highly concentrated monoclonal antibody solution with concentrated proline. Pharm. Res. 2018;35:133. doi:https://doi.org/10.1007/s11095-018-2398-1.
- Binabaji E, Ma J, Zydney AL. Intermolecular interactions and the viscosity of highly concentrated monoclonal antibody solutions. Pharm Res. 2015;32:3102–09. doi:https://doi.org/10.1007/s11095-015-1690-6.
- Inoue N, Takai E, Arakawa T, Shiraki K. Specific decrease in solution viscosity of antibodies by arginine for therapeutic formulations. Mol Pharma. 2014;11:1889–96. doi:https://doi.org/10.1021/mp5000218.
- Shukla D, Trout BL. Preferential interaction coefficients of proteins in aqueous arginine solutions and their molecular origins. J Phys Chem B. 2011;115:1243–53. doi:https://doi.org/10.1021/jp108586b.
- Reza M, How HB. Can a Free Amino Acid Stabilize a Protein? Insights from Molecular Dynamics Simulation. J Soln Chem. 2015;44:45–53. doi:https://doi.org/10.1007/s10953-015-0291-7.
- Banks DD, Latypov RF, Ketchem RR, Woodard J, Scavezze JL, Siska CC, Razinkov VI. Native-state solubility and transfer free energy as predictive tools for selecting excipients to include in protein formulation development studies. J. Pharm. Sci. 2012;101:2720–32. doi:https://doi.org/10.1002/jps.23219.
- Li J, Garg M, Shah D, Rajagopalan R. Solubilization of aromatic and hydrophobic moieties by arginine in aqueous solutions. J. Chem. Phys. 2010;133:054902. doi:https://doi.org/10.1063/1.3469790.
- Li L, Kumar S, Buck PM, Burns C, Lavoie J, Singh SK, Warne NW, Nichols P, Luksha N, Boardman D, et al. Concentration dependent viscosity of monoclonal antibody solutions: explaining experimental behavior in terms of molecular properties. Pharm. Res. 2014;31:3161–78. doi:https://doi.org/10.1007/s11095-014-1409-0.
- Chennamsetty N, Voynov V, Kayser V, Helk B, Trout BL. Design of therapeutic proteins with enhanced stability. PNAS. 2009;106:11937–42. doi:https://doi.org/10.1073/pnas.0904191106.
- Tomar DS, Kumar S, Singh SK, Goswami S, Li L. Molecular basis of high viscosity in concentrated antibody solutions: strategies for high concentration drug product development. MAbs. 2016;8:216–28. doi:https://doi.org/10.1080/19420862.2015.1128606.
- Sharma VK, Patapoff TW, Kabakoff B, Pai S, Hilario E, Zhang B, Li C, Borisov O, Kelley RF, Chorny I, et al. In silico selection of therapeutic antibodies for development: viscosity, clearance, and chemical stability. PNAS. 2014;111:18601–06. doi:https://doi.org/10.1073/pnas.1421779112.
- Sudrik C, Cloutier T, Mody N, Sathish HA, Trout BL. Preferential exclusion of sugars and polyols from native state IgG1 and its effect on monoclonal antibody aggregation and reversible self-association. Pharm Res. 2019;36:109.
- Arora J, Hu Y, Esfandiary R, Sathish HA, Bishop SM, Joshi SB, Middaugh CR, Volkin DB, Weis DD. Charge-mediated Fab-Fc interactions in an IgG1 antibody induce reversible self-association, cluster formation, and elevated viscosity. MAbs. 2016;8:1561–74. doi:https://doi.org/10.1080/19420862.2016.1222342.
- Mackerell AD, Feig M, Brooks CL. Extending the treatment of backbone energetics in protein force fields: limitations of gas-phase quantum mechanics in reproducing protein conformational distributions in molecular dynamics simulation. J Comput Chem. 2004;25:1400–15. doi:https://doi.org/10.1002/jcc.20065.
- Horn AHC. A consistent force field parameter set for zwitterionic amino acid residues. J Mol Model. 2014;20:2478. doi:https://doi.org/10.1007/s00894-014-2478-z.
- Campo MG. Molecular dynamics simulation of glycine zwitterion in aqueous solution. J Chem Phys. 2006;125:114511. doi:https://doi.org/10.1063/1.2352756.
- Best RB, Zhu X, Shim J, Lopes PEM, Mittal J, Feig M, MacKerell AD. Optimization of the additive CHARMM all-atom protein force field targeting improved sampling of the backbone ϕ, ψ and side-chain χ1 and χ2 dihedral angles. J. Chem. Theory Comput. 2012;8:3257–73. doi:https://doi.org/10.1021/ct300400x.
- Goldberg DS, Lewus RA, Esfandiary R, Farkas DC, Mody N, Day KJ, Mallik P, Tracka MB, Sealey SK, Samra HS, et al. Utility of high throughput screening techniques to predict stability of monoclonal antibody formulations during early stage development. J. Pharm. Sci. 2017;106:1971–77. doi:https://doi.org/10.1016/j.xphs.2017.04.039.
- Bhambhani A, Kissmann JM, Joshi SB, Volkin DB, Kashi RS, Middaugh CR. Formulation design and high-throughput excipient selection based on structural integrity and conformational stability of dilute and highly concentrated IgG1 monoclonal antibody solutions. Journal of Pharmaceutical Sciences. 2012;101:1120–35 3 doi:https://doi.org/10.1002/jps.23008
- Bhattacharyya R, Chakrabarti P. Stereospecific interactions of proline residues in protein structures and complexes. J Mol Biol. 2003;331:925–40. doi:https://doi.org/10.1016/S0022-2836(03)00759-9.
- Wu W, Raleigh DP. Local control of peptide conformation: stabilization of cis proline peptide bonds by aromatic proline interactions. Biopolymers. 1998;45:381–94. doi:https://doi.org/10.1002/(SICI)1097-0282(19980415)45:5<381::AID-BIP6>3.0.CO;2-H.
- Zondlo NJ. Aromatic-proline interactions: electronically tunable CH/π interactions. Acc Chem Res. 2013;46:1039–49.
- Alekseychyk L, Su C, Becker GW, Treuheit MJ, Razinkov VI. High-throughput screening and stability optimization of anti-streptavidin IgG1 and IgG2 formulations. J Biomol Screen. 2014;19:1290–301. doi:https://doi.org/10.1177/1087057114542431.
- Vagenende V, Han AX, Mueller M, Trout BL. Protein-associated cation clusters in aqueous arginine solutions and their effects on protein stability and size. ACS Chem Biol. 2013;8:416–22. doi:https://doi.org/10.1021/cb300440x.
- Březina K, Duboué-Dijon E, Palivec V, Jiráček J, Křížek T, Viola CM, Ganderton TR, Brzozowski AM, Jungwirth P. Can arginine inhibit insulin aggregation? A combined protein crystallography, capillary electrophoresis, and molecular simulation study. J Phys Chem B. 2018;122:10069–76. doi:https://doi.org/10.1021/acs.jpcb.8b06557.
- Crowley PB, Golovin A. Cation-π interactions in protein-protein interfaces. Proteins Struct Funct Genet. 2005;59:231–39. doi:https://doi.org/10.1002/prot.20417.
- Hong J, Capp MW, Anderson CF, Saecker RM, Felitsky DJ, Anderson MW, Record MT. Preferential interactions of glycine betaine and of urea with DNA: implications for DNA hydration and for effects of these solutes on DNA stability†. Biochemistry. 2004;43:14744–58. doi:https://doi.org/10.1021/bi049096q.
- He F, Woods CE, Becker GW, Narhi LO, Razinkov VI. High-throughput assessment of thermal and colloidal stability parameters for monoclonal antibody formulations. J Pharm Sci. 2011;100:5126–41. doi:https://doi.org/10.1002/jps.22712.
- Brandt JP, Patapoff TW, Aragon SR. Construction, MD simulation, and hydrodynamic validation of an all-atom model of a monoclonal IgG antibody. Biophys J. 2010;99:905–13.
- Sircar A, Kim ET, Gray JJ. RosettaAntibody: antibody variable region homology modeling server. Nucleic Acids Res. 2009;37:474–79. doi:https://doi.org/10.1093/nar/gkp387.
- Padlan EA. Anatomy of the antibody molecule. Mol Immunol. 1994;31:169–217. doi:https://doi.org/10.1016/0161-5890(94)90001-9.
- Abraham MJ, Murtola T, Schulz R, Páll S, Smith JC, Hess B, Lindahl E. GROMACS: high performance molecular simulations through multi-level parallelism from laptops to supercomputers. SoftwareX. 2015;1–2:19–25. doi:https://doi.org/10.1016/j.softx.2015.06.001.
- Jorgensen WL, Chandrasekhar J, Madura JD, Impey RW, Klein ML. Comparison of simple potential functions for simulating liquid water. J Chem Phys. 1983;79:926–35. doi:https://doi.org/10.1063/1.445869.
- Dolinsky TJ, Czodrowski P, Li H, Nielsen JE, Jensen JH, Klebe G, Baker NA. PDB2PQR: expanding and upgrading automated preparation of biomolecular structures for molecular simulations. Nucleic Acids Res. 2007;35:W522–W525
- Baynes BM, Trout BL. Proteins in mixed solvents: a molecular-level perspective. J Phys Chem B. 2003;107:14058–67. doi:https://doi.org/10.1021/jp0363996.
- Shukla D, Shinde C, Trout BL. Molecular computations of preferential interaction coefficients of proteins. J Phys Chem B. 2009;113:12546–54. doi:https://doi.org/10.1021/jp810949t.