
ABSTRACT
The early phase of protein drug development has traditionally focused on target binding properties leading to a desired mode of therapeutic action. As more protein therapeutics pass through the development pipeline; however, it is clear that non-optimal biophysical properties can emerge, particularly as proteins are formulated at high concentrations, causing aggregation or polyreactivity. Such late-stage “developability” problems can lead to delay or failure in traversing the development process. Aggregation propensity is also correlated with increased immunogenicity, resulting in expensive, late-stage clinical failures. Using nucleases-directed integration, we have constructed large mammalian display libraries where each cell contains a single antibody gene/cell inserted at a single locus, thereby achieving transcriptional normalization. We show a strong correlation between poor biophysical properties and display level achieved in mammalian cells, which is not replicated by yeast display. Using two well-documented examples of antibodies with poor biophysical characteristics (MEDI-1912 and bococizumab), a library of variants was created based on surface hydrophobic and positive charge patches. Mammalian display was used to select for antibodies that retained target binding and permitted increased display level. The resultant variants exhibited reduced polyreactivity and reduced aggregation propensity. Furthermore, we show in the case of bococizumab that biophysically improved variants are less immunogenic than the parental molecule. Thus, mammalian display helps to address multiple developability issues during the earliest stages of lead discovery, thereby significantly de-risking the future development of protein drugs.
Introduction
Recombinant antibody technology has revolutionized antibody discovery by enabling the generation of human antibodies to any target. This in turn has led to the approval of 85 antibody drugs and hundreds more progressing through clinical trials.Citation1 Historically the affinity, specificity and functional properties of antibodies have been the principal factors in the selection of antibodies to progress into pre-clinical development. Thus, the early phase of drug discovery focuses on identifying molecules having desired binding characteristics and appropriate mode of therapeutic action.
As more antibodies passed through the development pipeline, it became clear that the biophysical properties of the antibody are also important in determining whether a lead molecule will be successfully developed into an efficacious drug. Candidate antibodies with biophysical liabilities such as deamidation or isomerization can be easily identified from linear protein sequences, and mutations may be introduced to address these. Incubation with proteases or use of elevated temperaturesCitation2,Citation3 or acid exposureCitation4 during phage selection have also been used to enrich for increased stability during selection. Aggregation propensity, however, is less obvious and may only become evident at the higher concentrations required for drug formulation (e.g. concentrations in excess of 50 mg/ml are required for subcutaneous administration).
Assessment for aggregation propensity and polyreactivity has historically been deferred until a lead molecule, or limited panel of molecules have been selected for preclinical development. The negative impact of biophysical liabilities, however, may only emerge during pre-clinical development when antibodies are prepared at high concentrations. In some cases, buried by formulation “successes”, problems only emerge during clinical trials, leading to expensive late-stage product failure. For example, Jain et al.Citation5 have assessed the biophysical properties of 137 clinical-stage antibodies from Phase 2, Phase 3 and post-approval and have identified products with liabilities in all stages. The frequency of problematic antibodies was lower in later stages, suggesting ongoing attrition due to biophysical liabilities even within the clinical-stage pipeline.
Comparing a number of factors, Tessier et al.Citation6 determined that aggregation propensity and polyreactivity in particular are most highly correlated with product failure. Assessment of aggregation propensity is usually carried out in biochemical assays on a clone-by-clone basis once a small panel of candidates have been identified. The ability to detect such problems early in the drug development cycle, ideally at the point of antibody discovery, would have a huge benefit in helping to successfully traverse the drug development process.
We have recently described the use of nuclease-directed integration in the construction of large libraries of binders displayed on the surface of mammalian cells.Citation7 The efficiency of nuclease-directed integration creates the opportunity to introduce diverse repertoires of millions of complete antibody genes into the same genomic locus within a population of cells, combining accurate integration into a pre-defined site with an efficiency that allows construction of large libraries. Targeting individual antibody genes to a single locus within the population has the additional advantage of effecting transcriptional normalization across the population. We now demonstrate that this system is capable of distinguishing between antibody variants with differing biophysical properties based only on the display level achieved on the mammalian cell surface. Using this capability, variant libraries have been constructed and derivatives with improved biophysical properties have been selected. We also show that mammalian display can differentiate between antibodies with different polyreactivity profiles using the probes heparin sulfate and the heat shock protein (Hsp) chaperones Hsp70 and Hsp90.
Another consideration apart from developability is immunogenicity of protein drugs. A relationship has been observed between the propensity of protein-based therapeutic molecules to aggregate with increased immunogenicity,Citation8–10 suggesting that changes that improve solubility could, in some cases, also reduce immunogenicity. The anti-proprotein convertase subtilisin/kexin type 9 (PCSK9) antibody bococizumab was found to have poor biophysical propertiesCitation5 and generated anti-drug antibodies in 50% of patients, which contributed to its withdrawal during a Phase 3 clinical trial.Citation11 Here we demonstrate using an in vitro T cell assayCitation12 that mammalian display derived variants of bococizumab with improved solubility are less immunogenic than the parental molecule. Thus, mammalian display is an important addition to the drug discovery armory allowing selection for variants with reduced aggregation, polyreactivity and immunogenicity.
Results
Display level of antibodies on the surface of mammalian cells is related to their biophysical properties
Nuclease-mediated integration of antibody genes into a single genomic locus has previously been used to generate libraries displaying IgG-formatted antibodies in mammalian cells.Citation7 This was used for both de novo antibody discovery from naive libraries and for affinity maturation of antibodies. In addition to generating novel binders, we now demonstrate that mammalian display can be used to select variants with improved biophysical properties based on an inherent ability of mammalian display to differentiate between antibodies with different biophysical properties.
A number of studies have reported antibodies exhibiting biophysical liabilities that have been improved by the introduction of a small number of amino-acid substitutions. We have used three pairs of closely related antibodies with differing biophysical properties to provide a useful resource to study antibody developability. The panel included a monoclonal antibody recognizing Angiopoietin 2 (Ang2mAb), which exhibited both poor expression and aggregation, and a variant engineered for better expression (Ang2mAb C49T),Citation13 as well as MEDI-1912, which is an anti-nerve growth factor (NGF) antibodyCitation14 that showed precipitation and aggregation in solution and a poor pharmacokinetic profile. A triple mutant (MEDI-1912-STT) was identified with non-paratopic mutations (W30S, F31T and L56T) that interrupted the self-interaction interface whilst retaining potency and affinity for NGF. The panel also included CNTO607, an anti-interleukin (IL)-13 antibody that is poorly soluble at neutral pH, precipitates in phosphate-buffered saline (PBS) buffer at high concentrations and displays self-interaction. A variable heavy (VH) complementarity-determining region 3 (CDR3) mutation W100A improved both antibody solubility and polyreactivity profile.Citation15,Citation16
VH and variable light (VL) chain genes for all six antibodies (Supplementary Table 1) were synthesized, expressed in IgG format and purified by affinity chromatography. The differences between the parental and improved daughter clones were not obvious upon comparison of the expression yields between the 3 pairs of antibodies, which showed only a modest improvement in expression of the improved daughter variants compared with the parental antibody (). Analysis of melting and aggregation temperatures of this antibody also failed to detect significant differences in the pairs despite the disparities in biophysical properties (). This is in line with previous reports from Dobson et al. reporting equivalent expression for the MEDI-1912 pair.Citation14
Table 1. Biophysical properties of antibodies. Table shows the melting temperature (Tm) and temperature of the onset of aggregation (Tagg). The expression yield represents the yield from transient transfection after protein A purification. C-max is the highest concentration achieved by ultra-filtration (>x indicates that the upper concentration limit of precipitation and blocking of the filter was not achieved). Dynamic light scattering measurements include the cumulant z-average size (Z-Av) and polydispersity index (PDI)
Differences within the MEDI-1912 pair, however, became apparent during preparative size exclusion chromatography (SEC) where MEDI-1912 displayed an earlier elution profile compared with MEDI-1912-STT (Supplementary Figure 1), indicating that it exists as a higher molecular weight species and suggesting a propensity for self-interaction. The remaining antibodies eluted with the expected profile (similar to control antibody nivolumab, not shown). Differences in all 3 pairs became apparent upon concentration of the size purified antibody preparations by ultra-filtration. The antibody concentration achieved for each antibody pair is shown in . This revealed that it was not possible to concentrate the parental antibodies MEDI-1912 and CNTO607 beyond 1.4 mg/ml and 1.8 mg/ml, respectively, before antibody precipitation occurred. In contrast, it was possible to concentrate the solubility-enhanced daughter molecules MEDI-1912-STT and CNTO607_W100A to 29 and 30 mg/ml, respectively, with no evidence of precipitation. No precipitation was observed for the concentrated Ang2mAb pair.
Dynamic light scattering (DLS)Citation17 detected higher order aggregated species caused by self-aggregation for the parental antibodies MEDI-1912 and CNTO607, but not for the daughter molecules MEDI-1912-STT and CNTO607-W100A, as judged from the calculated polydispersity index (PDI) (). Similarly, the average particle size of the parental MEDI-1912 was 22 nm, whereas the average particle size for the daughter molecule MEDI-1912-STT was 13 nm, indicating a lower order aggregation state. Thus, significant self-interaction is occurring for both the MEDI-1912 and CNTO607 parental antibodies, resulting in detectable self-interaction at lower concentrations and precipitation at higher concentrations.
Genes encoding the three antibody pairs described aboveCitation13–15 were cloned into the mammalian display vector pINT17-BSD.Citation7 Stable HEK293 populations displaying each of the IgG-formatted antibodies were created by nuclease-directed gene integration and blasticidin selection as described previously.Citation7 At 15 days, post-transfection (dpt) cells were stained with phycoerythrin-labeled (PE) anti-human Fc and the presentation level determined by flow cytometry. In all cases a significantly higher level of antibody display was achieved from the improved daughter antibody when compared to the original problematic parental antibody, with the difference in mean fluorescence intensity approaching 2 orders of magnitude (, b and Supplementary Figure 2a–c). Quantitation of cell surface copy number was achieved by reference to calibration beads. This showed that densities of 310,000–570,000 molecules per cell were achieved for the optimized molecules studied, with 700,000 copies per cell presented for ustekinumab (Supplementary Figure 3). We confirmed that differential presentation was also achieved in the Chinese hamster ovary (CHO) cell lines using the MEDI-1912 pair as an example (Supplementary Figure 2d).
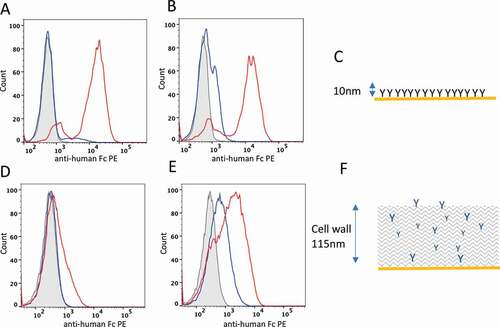
Figure 1. Distinguishing developable antibody by mammalian cell display. Flow cytometry plots of HEK293 (A and B) and yeast cells (D and E) displaying the Ang2 pair (A and D, respectively) or MEDI-1912 pair (B and E, respectively) on the cell surface. Histogram plots represent the cell count (x-axis) plotted against fluorescence intensity of anti-Fc-PE stain) for non-transfected cells (gray, filled), parental antibody (blue) and improved antibody (red). C and F show a scale representations of antibody presentation by mammalian cell display and yeast display, respectively
Comparison of yeast and mammalian display in the surface display of antibodies with different developability properties
Yeast display has become a popular method for selection and engineering of binding molecules, including antibodies and other scaffolds. We investigated whether a similar correlation between biophysical properties and display level was found on yeast cells. In contrast to mammalian cells, where antibodies are integrated into the cell membrane, yeast cells are surrounded by a cell wall and yeast display systems require covalent linkage of the antibody to the cell wall through a disulfide bond between a fused Aga2 protein and the cell wall Aga1 protein.Citation19 For the display of IgG on the surface of yeast, a bi-cistronic yeast display vector pYD1-GALCitation20 was used where two inducible GAL1 promoters drive the expression of the antibody light and heavy chain genes. The plasmid contains an auxotrophic TRP1 gene (phosphoribosyl-anthranilate isomerase required for tryptophan biosynthesis) and growth in minimal media and a yeast origin of replication to enable plasmid episomal replication in yeast cells. The antibody heavy chain is expressed with an N-terminal Aga2 protein to enable yeast display (i.e., Aga2p-GS linker-VH-CH1-3) and the light chain as a soluble protein. Antibody genes encoding the heavy and light chain genes of MEDI-1912, MEDI-1912-STT, Ang2mAb and Ang2mAb-C49T were cloned into pYD1-GAL and antibody expression induced by the addition of galactose at 30°C, as described in Materials and Methods. Yeast cells were stained with anti-Fc-PE in parallel on the same day with the same protocol as used for HEK293 cells. In contrast to mammalian display (), yeast display showed an over-lapping staining profile for cells displaying Ang2mAb or Ang2mAb-C49TCitation13 (). Yeast cell lines expressing MEDI-1912 or MED-1912-STTCitation14 also resulted in an over-lapping staining profile, albeit to a lesser extent (). Thus, mammalian display was superior in differentiating between the tested pairs compared with yeast display.
Enriching clones with optimal biophysical properties using mammalian display
We next investigated if antibodies with improved biophysical properties could be enriched based on display levels. To test this, a model experiment was constructed where plasmids encoding MEDI-1912 and MEDI-1912-STT were mixed in equal proportion and introduced into HEK293 cells as described previously. Following staining with anti-Fc PE, two distinct populations of cells were observed and gated into a “low” and “high” display level populations (gates 1 and 2, ). Genomic PCR was performed on the two populations to recover the integrated VH genes. Approximately 1 million sequence reads were generated and analyzed, revealing that the population sorted for high antibody presentation level (gate 2) was enriched (96%) for the optimized MEDI-1922_STT clone. The population sorted for low antibody presentation (gate 1) was enriched (85%) for the problematic parental MEDI-1912 antibody clone.
Figure 2. FACS separation of the MEDI-1912 variants based on antibody presentation level. A. Histogram plot of HEK293 population targeted by nuclease-directed integration with an equal mix of MEDI-1912 parent and MEDI-1912 STT variants. Gates 1 and 2 represent the sorting gates used to sort the 2 populations. B. MEDI-1912 mammalian display library was constructed based on mutagenesis of amino-acid position 30, 31 and 56. Cells were stained with anti-Fc-PE (x axis) and NGF-biotin/streptavidin-APC (y axis). The gate chosen for sorting is represented as a box on the dot-plot
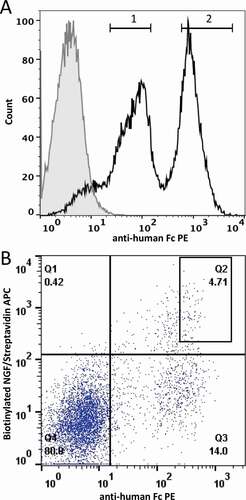
We wished to determine if variants with improved biophysical properties could be selected from a more complex library of variants. Dobson et al.Citation14 found that residues W30, F31 and L56 on the VH of MEDI1912 have potential to form a hydrophobic patch on the surface of this antibody. A variant VH library was constructed where these 3 residues were randomized and the resultant library displayed on HEK293 cells. At 15 dpt, cells were stained with anti-Fc PE. Flow cytometry analysis of the displayed MEDI-1912-library demonstrated the presence of clones in the population expressing MEDI1912 variants with equivalent or superior display levels to MEDI-1912_STT. The library population was sorted by fluorescence-activated cell sorting (FACS) according to antibody presentation level () and the antibody genes were recovered by genomic PCR.
Selected MEDI-1912 variant VH genes were cloned into a soluble IgG1 expression vector harboring the original MEDI-1912 VL. These were expressed and were concentrated by ultra-filtration prior to analysis by DLS. In contrast to MEDI-1912, which precipitated above 1.8 mg/ml, all the selected variants could be concentrated to between 32 and 52 mg/ml (), with no evidence of precipitation at these concentrations, indicating that the selected antibodies had higher solubility than the parental antibody. DLS also showed that the 5/6 of the selected antibodies had lower average particle size (Z-Ave) and less polydispersity (PDI) than the parental antibody MEDI-1912 (), with 2 clones (P5_C06 and P5_F01) showing superior properties compared to MEDI-1912_STT.
Table 2. Biophysical properties of selected MEDI-1912 variants. Table shows the highest antibody concentration achieved by ultra-filtration (C-max). Dynamic light scattering measurements include the cumulant z-average size (Z-Av) and polydispersity index (PDI)
This example demonstrates that it is possible to use mammalian display to select antibodies with improved biophysical properties from diverse libraries based on selection for high presentation levels.
Improving biophysical properties of a clinical candidate anti-PCSK9-humanized antibody by mammalian display
Bococizumab is an anti-PCSK9 antibody developed by Pfizer.Citation21 Bococizumab is derived from a humanized antibody (5A10i) that was affinity matured by phage displayCitation18 (Supplementary Figure 4a). It has been reported that the biophysical properties of bococizumab are not optimal, and it displays both self-aggregation and polyreactivity in a variety of assays.Citation5 Furthermore, it was found that 50% of patients developed anti-drug antibodies within a year of administration,Citation11 contributing to termination of its development during a Phase 3 clinical trial.Citation22 The crystal structure of bococizumab’s antigen-binding fragment complexed with PCSK9 has been determined,Citation18 and this has shown the antibody binds to the catalytic domain of PCSK9 through both light and heavy chains, with the main contribution through VH CDR3.
The parental antibody 5A10i had superior biophysical properties compared to bococizumab (). Comparing the mammalian display levels of bococizumab with the parental humanized 5A10i, we observed reduced cell surface presentation of bococizumab (Supplementary Figure 4b), suggesting that it could be possible to restore the optimal biophysical properties of the parental molecule by creating a library of variants and selecting for high presentation levels on the mammalian cell surface while retaining target antigen binding. It is known that clusters of hydrophobic amino-acid residues within a polypeptide sequence can give rise to poor expression levelsCitation23 and poor biophysical properties.Citation14,Citation15 Similarly, positive charge patches on the antibody surface from neighboring lysine or arginine residues can also give rise to cross-interaction by nonspecific binding to cell-expressed negatively charged molecules such as heparin sulfate.Citation24 Based on the crystal structure of bococizumab,Citation18 a number of candidate paratopic and non-paratopic amino acids contributing to hydrophobic or positive charge patches were identified (). In particular, 2 residues in VH CDR2 (F54 and R57) that contributed to neighboring hydrophobic and positive charge patches, respectively, were identified. In addition, a sequence alignment of bococizumab VH with the parental 5A10i VH (Supplementary Figure 4a) revealed that bococizumab VH CDR2 residues S52 and F54 were introduced during the process of affinity maturation. A bococizumab VH library was created by randomizing S52, F54 and R57 in VH CDR2 with an oligonucleotide containing three NNS codons to create a library with a 32,768 and 8,000 DNA or protein variants, respectively.
Table 3. Biophysical properties of bococizumab VH CDR2 variant antibodies. The top 12 enriched bococizumab VH CDR2 variant antibodies were expressed and purified and tested in an AC-SINS assay, HPLC-SEC and a specificity ELISA. Antibody variants are named according to the amino acid identity at positions 52, 54 and 57. Values shown are relative enrichment of clones in high mammalian display population, the AC-SINS wavelength shift (nm), the HPLC-SEC column retention volume (Vr (ml) in 2xPBS and an ELISA signal for binding to bovine serum albumin-blocked polystyrene microtiter plate wells
Figure 3. Engineering bococizumab by random mutagenesis of selected paratope residues. A. Structure of bococizumab bound to PCSK9 (PDB: 3SQO).Citation18 Upper panel depicts PCSK9 as a yellow ribbon structure and bococizumab as a molecular surface with its hydrophobic, positive, and negative patches shaded green, blue and red, respectively. The lower panel depicts a zoomed in image of the VH region that was mutated. The left panels show wild-type bococizumab and the right panels show a model of the bococizumab VH variant S52N, F54S R57S. Dot plot of HEK293 cells displaying either B. the mutagenized VH library of bococizumab, or C. the mutagenized VH and VL bococizumab library stained with biotinylated PCSK9 (y-axis) and anti-human Fc PE (x-axis)
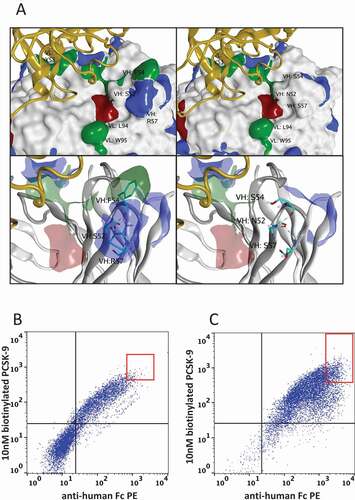
Candidate problematic residues were also found within the VL (Y53, L94 and W95. , upper panel). From the co-crystal structure of bococizumab with PCSK9, these residues either directly interact with the target antigen or indirectly contribute to binding through allosteric interactions (for example, VL CDR3 residue W95 appears to pack against VH CDR3 residues and may maintain the VH CDR3 conformation for optimal binding to PCSK9). Mammalian display allows a search for binder variants with improved biophysical properties to extend even into variants involving paratopic residues by the construction of random libraries in these positions and simultaneous flow sorting for improved presentation and retained antigen binding. For these paratopic residues, a mutant library was created by randomizing VL positions 53, 94 and 95 by NNS oligonucleotide directed mutagenesis to enable selection for both presentation and retained antigen binding. It is interesting to compare the flow cytometry profiles of the library focussed on the non-paratopic VHCDR2 () with the library where paratopic residues have been mutated () since it is apparent that there are clones within the latter library with reduced binding to PCSK9, as would be expected in a library that is randomizing paratopic residues.
Mammalian display selection combined with next-generation sequencing analysis to identify bococizumab variants with high cell display levels
The present study focusses on variants arising from the VH CDR2 mutant library presented in but as an example of VL CDR3 mutagenesis, the light chain variant library was subjected to fluorescent-activated cell sorting () to identify those with retained PCSK9 binding and high display level. The clone 884_01_G01 with VL CDR3 sequence QQRYSDTRT (compared to QQRYSLWRT in bococizumab) was identified (in conjunction with a VH CDR2 sequence as found in germline IGHV1-46*01 (sequence is INPSGGST and is referred to as “NSS” variant based on the amino acids sequence found in the underlined positions). Supplementary Figure 6 shows that antigen binding is retained in clone 884_01_G01 and the selected VL can confer additional biophysical benefits on optimized VHs (not shown).
To identify bococizumab VH variants with improved cellular display levels, clones falling within the top 5% of IgG presentation level, with retained PCSK9 binding, were collected by FACS () and VH genes were retrieved by genomic PCR. Following next-generation sequencing (NGS), 180,000 reads were generated from the input library and 245,960 reads from the output. The frequency of occurrence of the 20 different amino acids was calculated for each of the randomized positions (positions 52, 54 and 57) of bococizumab VH for both the input and output sequences. Supplementary Figure 5 compares the frequency of occurrence of each amino acid before and after enrichment by mammalian display. In all 3 mutated positions the original amino acid was depleted within the output population relative to the input population (S52, F54 and R57). Across all positions, there was a deselection for hydrophobic amino acids F, W, Y, as well as the positively charged amino acid R. At position 54 and 57, there was a preference for D and E, while there was a preference for E, Q, N and I at position 52.
An analysis was carried out to identify enrichment of specific parings of amino acids at the target positions. With the “NNS mutagenesis strategy” used, some amino acids are encoded by 2 codons (P, T, A, G) or 3 codons (L, R, S), and, as expected, these are over-represented both individually and particularly in pairwise combinations within the input population. This bias is removed in the output population. An enrichment factor was calculated by comparing the frequency of individual pairs in the input and output populations. From this, it is possible to identify 27 pairs of amino acids (Supplementary Table 2) that have been enriched by at least 10-fold in the output population compared with the input population. Examples of the most enriched sequences (>20-fold enrichment factors) include NEX, IDX, and QEX (named according to single amino-acid code for the mutant residues found at positions 52, 54 and 57). Of the 27 most enriched variants, 26 (Supplementary Table 2) contained at least one negatively charged amino acid (E or D), and this was predominantly found at position 54 as a F54E or F54D mutant. None of the enriched panel contained a positively charged amino acid at positions 54 or 57.
The mutagenic strategy used targets 3 residues (“triplets”), replacing them with all 20 amino acids, potentially creating 8000 amino-acid sequence variants. Setting a threshold of 0.02% (representing 40 or more reads) for any individual sequence captures 97.8% of the total sequences, and this is represented by only 420 different sequences. Thus, a selection of the top 5% of clones by mammalian display based on surface presentation has enriched 5.3% of the possible sequence variants. It is worthy of note that, whereas the parental VH CDR2 sequence (ISPFGGRT) is found 295/180,000 times (0.16%) in the input sequences, it is found only once in the 247,000 output sequences. Variants of this sequence SFX and XFR were not found at all in the output sequences.
Mammalian display enables the identification of bococizumab variants with improved biophysical properties
Examination of the output sequences shows that there has been a significant enrichment for certain triplet sequences within the elite-selected population. The top 12 most enriched sequences along with controls (bococizumab, 5A10i and the clinically approved anti-PCSK9 antibody alirocumab) were expressed and purified. Clones are named according to the single letter amino-acid code found at the 3 mutated positions in VH CDR2. Hence, bococizumab is SFR (representing S, F and R at positions 52, 54 and 57, respectively).
Bococizumab VH residues chosen for random mutagenesis and selection are non-paratopic according to the complex structure (PDB:3SQO)Citation18 ). To test this, a panel of bococizumab VH variant antibodies were analyzed for binding to PCSK9 in an affinity capture enzyme-linked immunosorbent assay (ELISA) with limiting amounts of antigen alongside wild-type bococizumab and alirocumab. As shown in Supplementary Figure 6, all the variants tested resulted in equivalent affinity capture signal compared with bococizumab and alirocumab, indicating that the variants described here do not prevent target antigen binding, as predicted from the crystal structure. A more quantitative examination of affinity was carried out by surface plasmon resonance (SPR). In agreement with previous reports (US patent: US 8399646 B2), an affinity of 590 pM was determined for the original humanized 5a10i (Supplementary figure 11). The experiment revealed a reduction in the apparent affinity of the biophysically improved variant (NEE KD = 409 pM) when compared with the parental bococizumab (KD = 30 pM). This is surprising since, based on the crystal structure, all mutated residues were present in non-paratopic region of the antibody (see Discussion section).
A number of methods can be used to assess the nonspecific binding characteristics of the antibodies, including both high-performance liquid chromatography (HPLC)-SEC and binding to control proteins or surfaces. Polyspecificity ELISA showed significant binding of bococizumab to uncoated ELISA plates, whereas the selected clones did not (). HPLC-SEC showed that the selected antibodies behaved well, giving equivalent HPLC-SEC retention volumes as alirocumab and 5A10i (). Bococizumab was retarded by HPLC-SEC (), resulting in a delayed elution profile, due to nonspecific interaction with the column matrix. In summary, selection by mammalian display on the basis of presentation levels allows selection of variants with improved biophysical characteristics.
Figure 4. HPLC-SEC analysis of bococizumab variants. Purified antibodies were loaded on a Superdex 200 column integrated in an Agilent 1100 HPLC instrument. Absorbance at 215 nm is plotted against elution volume for each antibody. In each plot samples are compared against the problematic bococizumab (labeled SFR) and the NDD variant, which is a well-behaved positive control. Samples are named according to amino acid substitution at positions 52, 54 and 57 within the VH CDR2. A. NFR, B. SFD, C. SDR, D. NFD E. NDR, F. SDD
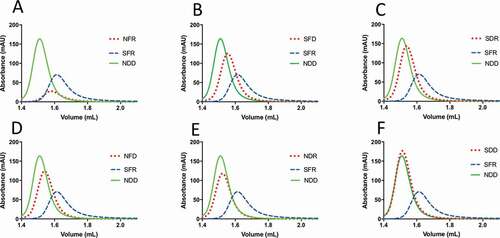
To directly study the effect of amino-acid substitutions of single, double and triple amino-acid variants of bococizumab, a series of sequence variants were prepared and tested. , and Supplementary Table 3 allow a number of single amino-acid substitutions to be compared, and the results show that the presence of individual amino acids can have a detrimental effect. All variants with F54 have a poor affinity-capture self-interaction Nanoparticle Spectroscopy (AC-SINS) score and/or show retardation on the HPLC-SEC column (, ). For example, variants showing HPLC-SEC retardation include NFR, SFD and NFD (Supplementary Table 3). This can be partly compensated by single amino-acid substitutions. For example, SFR (bococizumab) shows more pronounced gel retardation compared with the SFD and NFD variants (). The identity of individual amino-acid replacements can also have differential benefit and the beneficial effects of individual amino-acid replacements can be combined to greater effect (e.g., F54D and R57D, , ).
Table 4. Elution profiles of point mutations on HPLC-SEC. Retention volume for point mutations was calculated and compared to the elution volume of the well-behaved “NDD” clone. The difference in elution volume compared to “NDD” was calculated and the volume for bococizumab was designated as 100%. The relative percentage change in elution volume of the variants compared to bococizumab is shown
AC-SINS provides a convenient assay for assessing self-interaction. Test antibodies are presented on a bead surface and their potential for avid self-interactions with antibodies presented on other beads is assessed.Citation25 The reduction in inter-particle distance ensuing from interaction can be detected as an increase in plasmon wavelength of gold colloidal solutions. Therefore, AC-SINS provides a convenient technique for assessing self-interaction. Mammalian display-selected antibodies gave good AC-SINS scores that were equivalent to scores achieved with alirocumab and 5A10i (). In contrast, bococizumab displayed a high AC-SINS wavelength shift, indicating a propensity of this antibody to self-interact.
To further analyze the effect of higher concentrations on the propensity to self-react, bococizumab variants were expressed and purified at a larger scale. This set included the top 3 enriched clones identified from the NGS analysis (NEI, EEH and NEE) (). The soluble expression yields of the mammalian display-selected clones NEI, EEH and NEE were all superior to bococizumab, and mutants that retained F54 displayed reduced expression yields (). The mammalian-display selected clones NEI, EEH and NEE were also well behaved up to the highest concentration (40 mg/ml in PBS) as judged by DLS in PBS with average particle sizes equivalent to alirocumab. In contrast, bococizumab displayed a propensity to self-aggregate, with a higher average particle size observed even at the lowest concentration of 1 mg/ml. Bococizumab variants that retained F54 displayed higher average particle sizes (). Interestingly, the NFR variant was less prone to self-interact at 30 mg/ml compared to bococizumab. This may be because the crystal structure of bococizumab shows that S52 is involved in hydrogen binding with backbone residues to maintain the F54 exterior projection ().
Table 5. Post-purification yields and DLS scores of bococizumab VH CDR2 variant antibodies at different concentrations. The yields of selected antibodies is expressed as the yield of antibody (mg) per liter of expression culture volume (yield calculated following expression, Protein A affinity chromatography and dialysis . Antibodies were concentrated by ultra-filtration and the particle size measured by DLS using a Malvern Zetasizer Nano S. The Z average (the intensity weighted mean hydrodynamic size of the ensemble collection of particles) (Zav) was measured at 1, 10 or 40 mg/ml antibody concentrations (*with the exception of the NFR variant, which was measured at 30 mg/ml)
Biophysically improved bococizumab variants generated by mammalian display exhibit lower immunogenicity
A correlation has been shown between aggregation propensity and immunogenicity for a number of proteins, and so the immunogenicity of bococizumab variants with improved solubility was determined. The top two most enriched variants emerging from mammalian display selection (NEI and EEH) with 69- and 65-fold enrichment factors, respectively (), were chosen for immunogenicity assessment. Both NEI and EEH were well-behaved biophysically, compared with bococizumab, showing a low propensity to self-interact as judged by AC-SINS () and DLS (), and low polyreactivity by HPLC-SEC () and specificity ELISA (). SFD was chosen as an example of a variant with partly improved biophysical properties ( and ; ) and NSS (S52N, F54S, R57S) was chosen as an example of a clone where problematic residues were reverted to IGHV1-46*01 germ-line residues. The variant with VH CDR2 NSS and the original VL had superior biophysical properties compared with bococizumab. Combining VH NSS with an improved VL selected by mammalian display (884_01_G01) displayed slightly faster HPLC-SEC elution time (Supplementary Table 3) and a lower non-specific ELISA score compared with the original VL sequence, indicating a lower level of polyspecificity (not shown). In addition, positive controls keyhole lymphocyte hemocyanin (KLH) and alemtuzumab and negative controls trastuzumab, bevacizumab and alirocumab were also included. Using the Limulus Amebocyte Lysate (LAL) endotoxin assay, all antibodies were found to have low endotoxin levels (<1.0 EU/ml) acceptable for immunogenicity cell-based assays.
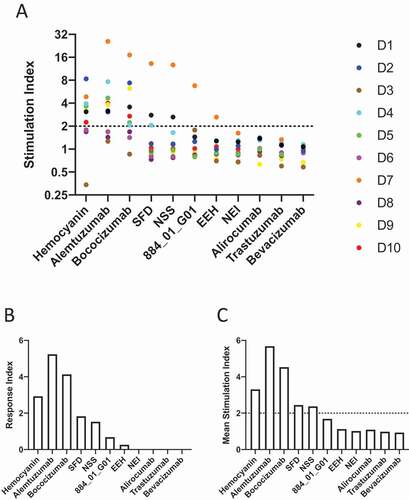
Immunogenicity was assessed using whole peripheral blood mononuclear cells (PBMCs), which contain both antigen-expressing cells (APCs), such as dendritic cells and CD4 + T cells. The APCs are able to phagocytize and process antigens and present peptide:MHC class II complexes to CD4 + T cells which, once activated, can be assayed for increased proliferation or activation marker up-regulation (e.g., CD69). This method has been previously applied to rank immunogenicity of antibodies.Citation12,Citation26–28 PBMCs from 10 haplotyped human donors (Supplementary Table 4) were used in this assay. shows the stimulation index (SI; a measure of Th cell proliferation plus antibody or antigen compared with a media only control (see Materials and Methods) for each individual donor as a dot plot. The majority of donor PBMCs responded, resulting in Th proliferation, when stimulated by KLH, alemtuzumab and bococizumab, as expected. In contrast, the mammalian display-selected bococizumab variants displayed a lower level of immunogenic response as judged by Th cell proliferation. To obtain an overview of the response across all 10 donors, a response index (RI) was calculated for each antibody and KLH where SI values were averaged across all donors and this was multiplied by the frequency of donors responding (). The RI ranking is more comprehensive than examination of the individual donor SIs as it considers both the magnitude and the frequency of donor responses. NEI, the most enriched bococizumab variant by mammalian display, had a zero-RI, equivalent to trastuzumab, bevacizumab and alirocumab. Interestingly, the immunogenicity RI of the bococizumab variants mirrored their biophysical properties: Bococizumab > SFD > NSS > 884_01_G01 > EEH ~ NEI. Bococizumab variants with an increased propensity to self-interact or with polyreactivity tended to be more immunogenic in the Th proliferation assay. For comparison, the mean SI for all 10 donor samples is shown for each of the antibodies and KLH ().
Figure 5. Induction of proliferation of CD4 + T cells by bococizumab and bococizumab variants selected by mammalian display. A. PBMCs from 10 individual haplotyped human donors (labeled D1 to D10) were labeled with CFDA-SE. After 8 days the cells were analyzed with an iQue screener flow cytometer (Intellicyt) where the viable singlet CD3+ CD4+ gated cells (see Supplementary Figure 7 for gating strategy) were analyzed for CFSE mean fluorescence intensity (MFI). The dot plot (A) shows the stimulation index (SI) for each donor. The SI was calculated by the average percentage of divided cells (% of parent) plus antibody or KLH divided by the average percentage of divided cells in the media only control samples. B. The average response index (RI) is calculated by averaging SI values across donors and multiplying by the percentage frequency of donors responding (p < .05 SI≥2). RI could not be calculated for Trastuzumab, Bevacizumab, Alirocumab and NEI due to a lack of samples meeting positive hit cut off criteria. C. Mean SI for all 10 donors for each antibody or antigen used for stimulation
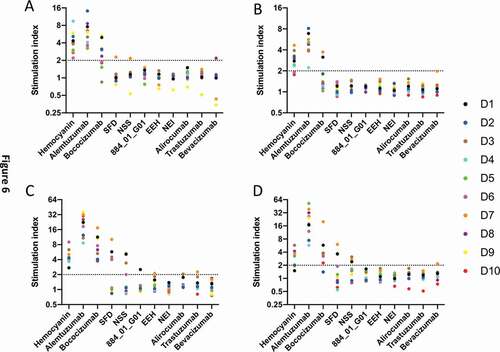
The ability of the different antibodies to activate Th cells was also tested by measuring their ability to up-regulate various activation markers, including CD69, CD25, CD71 and CD40-L (). Bococizumab was shown to up-regulate CD69, CD71 and CD40-L for the majority of donors and CD25 for a sub-set of donors. In contrast, the most enriched by mammalian display selection displayed no up-regulation of the 4 activation markers tested. The bococizumab variant with partly improved biophysical properties, SFD, showed up-regulation of both CD71 and CD40-L. The bococizumab NSS variant also showed up-regulation of CD71 and CD40-L, and this was reduced when combined with a light chain variant with the Y53H, L94D, W95T mutation (clone 884_01_G01).
Figure 6. Up-regulation activation markers on CD3+ CD4 + T lymphocytes by bococizumab and bococizumab variants selected by mammalian display. PBMCs from 10 individual haplotyped human donors (labeled D1 to D10) were incubated with different antibodies or KLH. After 8 days, the cells were stained with anti-CD3, anti-CD4, TO-PRO™ −3 and either A. anti-CD69, B. anti-CD25, C. anti-CD71 or D. anti-CD40L and analyzed by flow cytometry. SI was calculated by the percentage of marker positive cells plus antibody or KLH divided by the percentage of marker positive cells in the media only control sample
In silico bococizumab CD4 T cell epitope mapping
We have shown that the mammalian display-selected bococizumab variants with improved biophysical properties also have lower immunogenicity compared to bococizumab as judged by human Th cell proliferation and activation marker assays. We were interested in investigating if the amino acid changes introduced within the bococizumab VH and VL chains also affected HLA class II restricted T cell epitopes that may be involved in the production of anti-drug antibodies.Citation29 The in silico human HLA-DR MHC class II T cell epitopes with the bococizumab VH and VL chains were mapped using the Immune Epitope Database (IEDB) resourceCitation30 recommended method, which predicts CD4 T cell immunogenicity at the population level using 7 HLA class II alleles.Citation31,Citation32 The top 2 VH CD4 T cell epitopes, based on the IEDB CD4 T cell immunogenicity scores (http://tools.iedb.org/CD4episcore/),Citation31are located at the CDR2/FW3 and FW3/CDR3 boundaries (Supplementary Figure 8A). These epitopes are located outside of the bococizumab VH residues targeted by mutagenesis here (S52, F54 and R57). The top IEDB predicted non-germ-line bococizumab VL CD4 T cell epitopes were shown to be located in the regions aa41-65 and aa81-95 covering VL CDR2 and CDR3 (Supplementary Figure 8B). Thus, although all variants tested had a predicted immunological epitope in the light chain, changes in the partner heavy chain, which reduced overall aggregation, resulted in reduced immunogenicity. This suggests that the mammalian display-selected bococizumab variants, such as NEI, with a wild-type VL, may derive their low immunogenicity not by mutation of their T cell epitopes, but by a reduction in their inherent propensity to aggregate.Citation8,Citation9
Screening for polyreactivity by mammalian display
Two anti-IL12 antibodies with differing polyreactivity profiles were identified in the study by Jain et al.Citation5 Ustekinumab (which was approved to treat psoriasis and Crohn’s disease) was considered to be well-behaved regarding its biophysical properties, whereas briakinumab (which did not progress beyond Phase 3 clinical trials) was shown to be polyreactive in several assays, including a baculovirus viral particle (BVP) ELISA, a polyspecificity reagent assay, a multi-antigen binding ELISA, and had a longer retention time by cross-interaction chromatography.Citation24 In addition, briakinumab showed a propensity for self-interaction by AC-SINS. In Phase 1 clinical trials, the median half-lives of ustekinumab and briakinumab were 21 and 8 days, respectively,Citation33 indicating a faster clearance in vivo of briakinumab. Schoch et al.Citation34 also demonstrated that briakinumab possessed a positive charge patch within its variable domain, and this enhanced its binding to FcRn at neutral pH.
Polyreactivity screening of antibodies has previously been performed with yeast display using polyspecificity reagent probes, including soluble membrane or cytoplasmic extracts from mammalian (HEK293) or insect (Sf9) cellsCitation35,Citation36 or with chaperones.Citation37 To investigate whether mammalian display could differentiate between antibodies with different polyreactivity profiles, briakinumab and ustekinumab were investigated in the mammalian display system. There was a modest difference in presentation level between the antibodies. We found, however, that cells expressing ustekinumab could be distinguished from cells expressing briakinumab based on the extent of heparin sulfate binding (). This nonspecific binding likely occurs through positively charged patches in the CDRs of briakinumab.Citation34,Citation38 Chaperone proteins represent further polyreactivity probes, which may be used as non-target molecules for de-selecting polyspecific binders. Chaperones are functionally related and assist in protein folding. In particular, heat shock proteins are overexpressed in stressful conditions such as high temperature. Most chaperones are also abundantly expressed in normal cells where they recognize and bind non-native proteins thus preventing aggregation. HEK293 cells displaying briakinumab or ustekinumab were tested for binding to Hsp70 and Hsp90. and c show overlays of ustekinumab and briakinumab double-stained with anti-human Fc PE and heat shock proteins (Hsp70 and 90, respectively) conjugated with DyLight 633. This demonstrates the potential to combine separation based on presentation level with binding to “polyreactivity probes” such as heparin sulfate and heat shock proteins.
Figure 7. Screening for polyreactivity by mammalian display. Dual staining with (a) Heparin-FITC, (b) Hsp70 or (c) Hsp90 (x-axis) and anti-human Fc APC (y-axis). Dot plots showing overlay of ustekinumab (gray) and briakinumab (black). Gate within the overlay plots indicates the cells to be high expressers and non-binders to heparin or Hsp proteins
Discussion
Mammalian display has previously been used for discovery and affinity maturation of proteins based on their binding properties. Here, we demonstrate that mammalian display can also be used to select for proteins with superior biophysical characteristics based on display level achieved. Aggregation propensity and polyreactivity are two important aspects of the biophysical properties of a proteinCitation6 that can affect the extent to which they can be developed into a drug (“developability”).
It is clear that a total focus on engineering antibodies to improve affinity can lead to introduction of residues that can cause biophysical problems, as evidenced by several examples, including bococizumab and MEDI-1912. Developability problems, which often only emerge at higher concentrations, can occur in antibodies from any platform including immunised animals.Citation5 The total antibody concentration in serum is 10–15 mg/ml and represents millions of different antibodies. Thus, there is no selective pressure within the immune system to generate individual antibodies with optimal biophysical properties, and it cannot be assumed that antibodies arising from immunization will be free from problems.
Aggregation propensity and polyreactivity are closely related, and Dobson et al.Citation14 have shown that a small number of amino-acid changes can simultaneously reduce aggregation and polyreactivity with a consequent increase of in vivo half-life.Citation14 Aggregation may occur due to association of non-native protein conformations arising from unfolding, which in turn can be related to the stability of the protein. Where proteins are inherently unstable, melting temperature may be used to compare protein stability. Aggregation, however, may also occur with relatively stable native proteins through self-association and this may become more apparent as the protein concentration is raised. Thus, it is possible that proteins of similar sequence may be judged to be stable based on melting temperature, but one variant may be prone to aggregation while the other is not. Nonspecific interactions with proteins other than the target molecule are also a significant consideration in drug development, since this can adversely affect the specificity and performance of the drug. It has been shown that the in vivo half-life of antibodies can vary significantly between antibodies.Citation39 If an administered drug is drawn into a “sink” of nonspecific binding interactions with non-target components, it will be less available for binding to its target molecule and may have a reduced ability to reach or penetrate a target tissue or site of pathology.
The tendency to associate with self and with other proteins may be attributable to clustered hydrophobic or charged amino-acid residues on the surface of a protein molecule driving nonspecific interactions. For example, an antibody molecule may exhibit binding to negatively charged surfaces or molecules carrying a net negative charge (at neutral pH), such as the negatively charged backbone of DNA, or other negatively charged polymers such as heparin or heparan sulfate. Interactions with hydrophobic, negatively charged or positively charged surfaces may lead to a class of nonspecific interactions with other (non-target) molecules, particularly at higher concentrations. From this analysis one can see that the factors causing aggregation to self can also drive nonspecific interactions to other proteins. Equally there may be situations were self-aggregation is limited while polyreactivity occurs. demonstrates modest differences in the display level between briakinumab and ustekinumab, although nonspecific binding to Hsp70, Hsp90 and heparin sulfate are significantly worse for briakinumab. Thus, it may be possible to enrich clones on the basis of display level in combination with binding to specific and nonspecific targets. Nonspecific interactions are a critical consideration in drug development since they can adversely affect the performance, specificity, in vivo distribution or half-life of drug molecules.Citation24,Citation34,Citation38,Citation39
A number of factors contribute to the success of mammalian display in selecting for developability. We previously described the benefit of nuclease-directed integration to overcome this problem of constructing large libraries in mammalian cells while inserting only a single gene per cell enabling efficient gene selection on the basis of the encoded binding characteristics. The same benefit applies to selections based on antibody presentation levels. Furthermore, in contrast to random integration approaches (e.g., using lentiviral-Citation40–42 or transposase-Citation43 mediated integration), targeting of the antibody gene to a single genomic locus through nuclease-directed integration has an additional benefit when using display level as a “read out” since such targeted integration effects transcriptional normalization and so observed differences in display level arise from the properties of the antibody itself rather than variation in transcriptional activity.
Why is there a relationship between biophysical properties and display level? We have shown that very high densities can be achieved on the cell surface with 500,000 or more protein copies on the cell surface achieved for a well-behaved antibody, and so we can calculate a theoretical concentration at the cell surface. If we assume for the sake of this example that a suspension HEK293 cell is a sphere, we can estimate the volume occupied by an antibody on its surface. For a spherical HEK293 cell with a radius (r) of 10 micronsCitation44 (r = 10,000 nm), the cell volume can be calculated from the formula 4/3πrCitation3 = 4.18 rCitation3. An antibody has a height of 10 nm and will be present in a larger sphere of volume 4.18(r + 10 nm)Citation3. Thus, the volume occupied by the antibody is the difference between the volume of the cell and the larger sphere occupied by the antibody. With the above assumptions and using the example of 700,000 copies per cell (as found with ustekinumab), a concentration on the cell surface of 13.9 mg/ml is calculated (see Supplementary Figure 9). We conclude therefore that mammalian display forces the library members through a concentration “bottleneck” on the cell surface. The quality control machinery of the cell will remove aggregated complexes from the cell surface, resulting in lower presentation levels.Citation45–47 An additional possibility is that the antibodies are presented at high concentration with the complex milleu of proteins on the mammalian cell surface and antibodies prone to polyreactivity form complexes with other proteins that are also removed by the cellular quality control machinery. Indeed, Dobson et al.Citation14 use binding to HEK293 cells as a polyreactivity screen for MEDI-1912.
Based on surface presentation, yeast display was found not to differentiate between antibodies with different biophysical characteristics as well as mammalian display. This was illustrated by comparing the presentation levels of Ang2mAbCitation13 and MEDI1912Citation14 and their optimized daughter molecules. A substantial difference between the two systems is that antibodies presented by yeast display are in fact anchored to the cell wall (via fusion to the Aga2 protein, which is disulfide bonded to the cell wall via Aga1Citation48), whereas the antibody is anchored to the cell membrane by mammalian display, which might be considered a more dynamic situation than occurs on the cell wall. Dupres et alCitation49 have measured the yeast cell wall as 115 nm is depth, while an antibody is approximately 10 nM. Thus, in the cell wall the antibody occupies a greater volume and at a lower concentration than an equivalent surface density presented directly on the cell surface (c, f). Furthermore, aggregation-prone antibodies may benefit from linkage to a hydrophilic matrix. Thus, although graphical representations of yeast display often suggest that the antibody is fused to the cell membrane, the antibodies are in fact presented within a 3-dimension hydrophilic matrix, which may be a less dynamic environment. Dupres et al.Citation49 state that “In yeast, cell walls are made of a microfibrillar array of β-1-3 glucan and β −1-6 glucan chains, overlaid by manno-proteins, implying they are much stronger and stiffer than the glycocalyx of mammalian cells”. The embedded nature of the display system is underlined by McMahon et al.Citation50 who show that staining efficiency by yeast display is related to the molecular weight of the probe and can be improved by adding linkers of up to 600 amino acids to the end of the displayed molecule. In contrast, mammalian display anchors the antibody directly to the cell membrane.
The availability of the structure of the complex of bococizumab:PCSK9 enabled a strategy of targeting non-paratopic residues. It was observed, however, that residues outside the antigen binding site and clearly identified as contributing to aggregation and polyreactivity increase the apparent affinity for target. In an analysis of macromolecular binding by SPR, Schuck et al.Citation51 state that “the presence of low-affinity, non-specific surface sites, even if not specific and clearly distinct from sites of interest will therefore impact mass transport”. Thus, possible reasons for the contribution of non-paratopic residues to an apparent increase in affinity include nonspecific interactions having an effect on mass transfer. An examination of this effect is beyond the scope of this study, but highlights that an unrelenting focus on affinity values, to the exclusion of other factors, may lead maturation campaigns toward antibodies “benefitting” from the contribution of such problematic residues (exemplified here by bococizumab, MEDI1912 and briakinumab).
Bococizumab has been reported to be immunogenic and to induce anti-drug antibodies (ADAs) upon administration to humans. In a 4000 patient clinical trial, administration of bococizumab via subcutaneous injection was associated with the development of ADAs.Citation11 At 12 weeks post administration of bococizumab, 48% of patients had detectable levels of ADAs, and of these 29% had high titer neutralizing ADAs, which resulted in a loss of efficacy with significant attenuation in the reduction of the total LDL cholesterol.Citation11 The relationship between the propensity of therapeutic biologics, including antibodies, to self-interact and aggregate with their immunogenicity in vivo has been highlighted and reviewed by Ratanji et al.Citation8 and Moussa et al.Citation9 For example, biologics such as growth hormone, interferons and antibodies containing a greater proportion of aggregates are known to be more immunogenic. This may be because of the increased avidity of multivalent aggregates driving binding to dendritic cells via their surface-displayed innate receptors, resulting in their increased cellular update, antigen processing and increased peptide/MHC complex display. The multivalent aggregates may also directly stimulate B cells via specific B cell receptors to a greater extent than monomeric antibodies due to their avidity.
Walsh et al.Citation28 have shown a good correlation between clinical immunogenicity and in vitro immunogenicity assays measuring T cell activation and proliferation in PBMCs. Using such assays, we confirm the immunogenicity of bococizumab. Importantly we see significantly reduced immunogenicity within the panel of variants with improved biophysical properties. In silico assessment of immunogenicity suggest that the immunogenic epitopes, extending into the antibody light chain, are distinct from the regions in the heavy chain, which were modified to improve biophysical properties. Therefore, changes in one region that affect aggregation propensity also affect the immunogenicity of different residues, including the predicted immunogenic epitopes within a partner chain.
In summary, libraries encoding millions of protein variants can be constructed in mammalian cells by nuclease-directed integration. Normalized transcription coupled with high-density protein presentation on the cell surface enables selection for library members with optimal biophysical properties. In addition to improving the developability of candidate proteins during pre-clinical development, the improved solubility has the potential to reduce clinical immunogenicity of candidate drugs. Thus, mammalian display addresses developability issues during the earliest stages of lead discovery and significantly reduces the risk of expensive, late-stage failure in drug development.
Materials and methods
Mammalian display targeting vector and MEDI1912 library construction
Mammalian display HEK293 cell lines were generated by nuclease mediated gene integration using the bicistronic targeting vector pINT17-BSD described previously.Citation7 Synthetic genes encoding the antibody VH and VL genes, flanked by NcoI/XhoI and NheI/NotI restriction enzyme, respectively, were synthesized by IDT (Leuven, Belgium) and cloned into pINT17-BSD to create individual antibody display targeting vectors. A library of MEDI1912 VH variants was created by PCR assembly mutagenesis targeting three codons (W30, F31 and L56). Three PCR products were amplified from the VH template (see Supplementary Figure 10 for template sequence) using KOD polymerase (71086–3, Merck) according to the manufacturer’s instructions: VH1 (95 base pair (bp)) with primers MEDI-1912-F3 (CCATGGCCCAGGTTCAGCTG) and MEDI1912_W30NNS_F31NNS (CTGTCGGACCCATGTAAAGGCGCCSNNSNNAAAGGTGCCGCCGCTTGCTTTGCA); VH2 (102 bp) with primers MEDI-1912-F (GGCGCCTTTACATGGGTCCGACAG) and MEDI-1912_L56NNS (CTGGAAGTTCTGGGCCAGATTGGTSNNGCCGAAGATAGGGATGATGCCGCC); VH3 (213 bp) amplified with primers MEDI-1912-F2 (ACCAATCTGGCCCAGAACTTCCAG) and MEDI-1912-R (ACTCGAGACGGTGACCATTGTG). The three PCR products (VH1, VH2 and VH3) listed above were combined (10 ng each) and assembled in a PCR reaction with outer primers MEDI-1912-F3 and MEDI-1912- R using KOD polymerase. The PCR product was digested with Ncol and Xhol and ligated with NcoI/XhoI digested plNT17- MEDI-1912 (plNT17-BSD harboring the VL of MEDI1912). This ligation mix was then transformed into E. cloni® 10 G elite electrocompetent cells (60061–1, Lucigen) to yield a library size of 1.1 × 10⁶. The transformant plates were scraped and 2 OD600 units used to inoculate 50 ml Circlegrow media with 50 μg/ml kanamycin. The culture was then grown 4 hours at 37°C in a 250 ml baffled flask and midiprep plasmid DNA prepared (plNT17- MEDI-1912-library).
Bococizumab library construction
A bococizumab VH library was created where the S52, F54 and R57 codons were randomly mutated by PCR assembly mutagenesis. A 162 bp PCR product was created with primers 3152 (TTTTTTGCCATGGCCCAGGTTCAG) and 3150 (GATCTCGCCCATCCACTCAAG) with VH plus stop codon template (see Supplementary Figure 10 for sequence) using Platinum SuperFi (12359010, Merck according to the manufacturer’s instructions). An adapter PCR was then performed on the PCR product with primers 3152 and 3149 (CTTGAACTTCTCGTTGTAGTTGGTSNNGCCGCCSNNTGGSNNGATCTCGCCCATCCACTCAAG) to yield a 204 bp product. This was then PCR assembled with a second 183 bp PCR product (created by amplification from the bococizumab VH template with primers 3151 (ACCAACTACAACGAGAAGTTCAAG) and 3153 (ACTCGAGACTGTCACGGTGG)) with primers 3152 and 3153 to yield a 363 bp product. This product was then digested with NcoI and XhoI and ligated with pINT17-BSD harboring the bococizumab VL gene and the ligation mixed used to transform E. Cloni cells to give a library of 7.1 × 10⁵ clones and plasmid DNA prepared as described above. A bococizumab light chain library to mutate positions VL Y53, L94 and W95 was also created by assembly PCR. Here, two PCR products were generated using the VL template gene (Supplementary Figure 10) with primers 3071 (TTTTTTGCTAGCGACATCCAGATG) and 3069 (CTGGGCACGCCGGTGTATCTSNNGCTGGCGCTGTAGATCAGCAG) and primers 3073 (AGATACACCGGCGTGCCCAG) and 3070 (GTGCCCTGGCCAAATGTCCGSNNSNNAGAGTACCGCTGCTGGCAGTAG) with sizes 191 bp and 146 bp products, respectively. The two inserts were then PCR assembled with primers 3071 and 3075 (AAAAAAGCGGCCGCGGTACGCTTGATTTCCAGCTTGGTGCCCTGGCCAAATGTCCG) to give a 353 bp insert, digested with NheI/NotI and cloned into pINT17-BSD harboring an equimolar ratio of the bococizumab six VH variants (Y33A; Y33D; S52,F54N,R57S; Y33A,S52,F54N,R57S; Y33D,S52,F54N,R57S and wild-type) and a library of 1.2 × 10⁵ variants created as described above.
Modeling hydrophobic and charge patches
The Protein Data Bank structure of bococizumab bound to PCSK9, 3SQOCitation18 was prepared with the QuickPrep application in MOE Citation2019.0102.Citation52 The Protein Patches application identified the hydrophobic patches by determining the surface regions with a partition coefficient hydrophobicity potential as high as a methyl group sustained over a surface area greater than 50 ÅCitation2 Positive and negative charge patches were identified as regions with excess force-field charge sustained over an area of at least 40 ÅCitation2 The Protein Builder within MOE was used to build the bococizumab VH variant S52N, F54S, R57S by mutating each of the three residues, repacking their sidechains by searching a rotamer library for the lowest energy conformers, and energy minimizing the mutation sites with the Amber10 force-field.
Creation of antibody mammalian display HEK293 cell lines and libraries, flow cytometry, FACS and copy number determination
The creation of HEK293 or CHO antibody display cells lines was performed by TALEN mediated gene integration and Maxcyte STX electroporation, as described previouslyCitation7 except that CHO transfection used the Maxcyte STX CHO electroporation settings. The MEDI-1912 and bococizumab IgG HEK293 display libraries were created by the electroporation of 1 × 10Citation8 HEK293 cells per library. Blasticidin (BSD) selection (7.5 μg/ml) commenced 2 dpt, anti-Fc MACS enrichment of antibody displaying cells was performed 6 dptCitation7 and gene targeting efficiency was calculated by dilution plating and counting BSD-resistant colonies. Cells were stained with anti- Fc-PE (BioLegend, Cat. No. 409304) and NGF-biotin (256-GF-100, R&D Systems) or PCSK9-biotin (PC9-H82E7, AcroBiosystems) and Streptavidin-APC (405207, Biolegend), flow cytometry performed with an iQue screener (Intellicyte) and analyzed with FlowJo software (BD). FACS was done using a BD Influx High-Speed Cell Sorter (Becton, Dickinson). To enable copy number quantitation the Quantum Simply Cellular (QSC) microspheres kit (815, Bangs laboratories, Inc.) was used with a mix of one blank and four bead populations with increasing amount of Fc-specific capture antibody (goat anti-mouse IgG). QSC beads were stained with anti-Fc-PE, analyzed by flow cytometry and mean fluorescence intensity calculated for each bead population to enable a standard curve to be plotted (Supplementary Figure 3).
Antibody gene retrieval and NGS
Antibody gene retrieval from FACS-enriched mammalian display populations was performed by genomic DNA extraction and nested PCR.Citation7 VH genes were amplified by PCR and NGS performed using the Illumina Miseq and analyzed with the Geneious Biologics online software (Aukland, New Zealand) as described previously.Citation7
Yeast display and flow cytometry
Selected antibody VH and VL genes were cloned into the SfiI/NotI and NcoI/AscI restriction sites, respectively, of the pYD1-Gal yeast display vector.Citation20 Ligated DNA was used to transfect E. coli DH5a, plated onto LB-Amp plates, individual colonies picked, plasmid DNA prepared and clones DNA sequence confirmed. Final constructs were transformed into S. cerevisiae EBY100 and transformants selected on minimal medium for tryptophan prototrophy.Citation53 For yeast display induction, a starter culture was grown into 10 ml SDCAA medium in a sterile 125-ml flask (Corning disposable/filter vent) at 280 rpm, 30°C to a achieve a cell density of 5 to 10 OD600/ml. The yeast cells were centrifuged at 3000 g, 5 minutes and resuspended in 10 ml SG/RCAA. The culture was grown in 125-ml flask at 30°C at 240 rpm for 36 h. Staining of the induced yeast cells and flow cytometry analysis was performed as described above.
Polyreactivity screening by mammalian display
For polyreactivity screening HEK293 cells (2.5 x 10⁵) displaying either briakinumab or ustekinumab IgG were stained with anti-Fc-PE (BioLegend, Cat. No. 409304) and either Heparin-FITC (9 μM, Creative PEGWorks), or Hsp70 (10 μg/ml, 11660, Sino Biological) or Hsp90 (10 μg/ml, AP-160-050, R&D systems) labeled with DyLight 633 (according to the manufacturer’s instructions (46414, Thermo).
IgG expression and purification
Antibodies were expressed by transient transfection of Expi293 cells (A14635, ThermoFisher) according to the manufacturer’s instructions. Cell culture supernatants were harvested by centrifugation (2000 g, 20 minutes, 4°C) and filtered through a 0.45 μm filter. Protein A sepharose (PC-A100, Generon), 1/10 volume 10xPBS added, slurry (0.4 ml, 50% slurry per 40 ml culture supernatant) added mixed end-over-end for 1 hour in 50 ml falcon tube. The slurry with bound antibody was harvested by centrifugation (200 g, 5 minutes), transferred to a Proteus “1 step batch” spin column (NB-45-00058-2, Generon), column washed 2 × 10 ml 2xPBS and eluted with four column volumes of 0.2 M glycine (pH2.6). The eluate was immediately neutralized with 1/3 volume 1 M Tris-HCl (pH8). Purified antibodies were desalted by dialysis against PBS (pH7.4). Antibody concentrations were calculated from their absorbance at 280 nm.
Capture ELISA
The capture ELISA protocol was as described previouslyCitation7 except that PCSK9-biotin (PC9-H82E7, AcroBiosystems) was used as the antigen probe at a concentration of 0.1 nM.
AC-SINS
AC-SINS was essentially as described by Liu et al.,Citation25 with the following modifications. Polyclonal goat anti-human IgG Fc antibodies (109–005-098, Jackson ImmunoResearch) and goat nonspecific antibodies (005–000-003, Jackson ImmunoResearch) are buffer exchanged using Zeba Columns (89882, ThermoFisher Scientific) into 20 mM sodium acetate (pH 4.3), followed by concentration normalization to 0.4 mg/mL. A cocktail of the two antibodies is made using 20% of the nonspecific antibody, and 80% of the Fc-specific antibody and this cocktail added to gold nanoparticles (AuNP) (diluted 0.67 fold in milliQ grade water) in a 9:1 ratio. After room temperature incubation for 1 h, thiolated PEG (final concentration 0.1 μM, 729140, Sigma) is used to block empty sites on the AuNPs. These coated and blocked particles are stable in the coating solution at 4°C for up to 1 week. The AuNP are then centrifuged at 10,000 g for 10 minutes at 4°C, with 95% of the supernatant removed and further centrifuged at the same conditions. The final AuNP are resuspended in 1/10th of the starting volume in PBS (pH7.4). Ten μl are added to each well of a polypropylene 96-well plate (containing 100 μl of test antibody, either in supernatant or purified in PBS). The plate is incubated for 1–2 hours at room temperature on a shaking platform set to 700RPM. The contents (100 μl) are transferred to a clear 96-well polystyrene UV transparent plates (3635, Corning). Absorbance data were collected from 450 to 650 nm in increments of 1 nm using a BMG Pherastar instrument. A macro (kindly provided by the Tessier Lab, University of Michigan) is used to identify the maximum absorbance, smooth the data, and fit the data using a second-order polynomial. The smoothed maximum absorbance of the average blank (PBS alone) is subtracted from the smoothed max absorbance of the antibody sample to determine the antibody AC-SINS score.
DLS and HPLC-SEC
Purified antibodies were concentrated by ultra-filtration and Dynamic light scattering measurement were performed with a Nano S DLS (Malvern Instruments, Malvern, UK) on samples and PDI and the cumulant (or z-average) size (Zav) calculated using the zetasizer software (Malvern Instruments, Malvern, UK). For HPLC-SEC, purified antibodies were loaded onto a Superdex 200 Increase 5/150 column at a flow rate of 0.25 ml/min using an Agilent 1100 HPLC instrument.
Human Th CD4+ proliferation assays and data analysis
All samples (apart from KLH and medium only) were tested for endotoxin levels by a LAL test (88282, Thermo Fisher) prior to assay setup and were found to be within the acceptable limit (<1 EU/mL). The human Th CD4+ proliferation assay method followed that described by Jones et al.Citation54 PBMCs were sourced from Bioivt (Burgess Hill, UK) and haplotyped by MC Diagnostics (Saint Asaph, UK) by locus specific PCR followed by hybridization to sequence-specific oligonucleotide probes (Supplementary Table 4). PBMCs were purified from buffy coats using Lymphoprep (07851, STEMCELL Technologies, Waterbeach, UK) and all donors were depleted of CD8 + T cells using RosetteSep™ human CD8 depletion cocktail (15623, STEMCELL Technologies) as per the manufacturer’s instructions. PBMCs were frozen in 10% dimethyl sulfoxide (276855, Sigma) in Human Serum AB (H4522, Sigma) at 30 × 106 cells/mL and stored in liquid nitrogen (LN). LN frozen donor PBMCs were thawed, counted and labeled with carboxyfluorescein diacetate succinimidyl ester (CFDA-SE) (V12883, Thermo Fisher) using a protocol developed by Quah et al.Citation55 CFDA-SE-labeled cells (0.1 mL at 4–6 × 10⁶ cells/mL) were added to 96-well plates (CLS3595, Corning) containing antibody or KLH (H7017, Sigma) (0.1 ml, 90 µg/mL) in AIM-V cell culture medium (12055083, Thermo Fisher) in sextuplet and incubated at 37°C, 5% CO2. After day 8, cells were mixed by a multichannel pipette, 0.1 mL from each well transferred to a 96-well plate containing anti-CD3-PE, (300441, Biolegend), anti-CD4-APC (300537, Biolegend) and a viability dye 7-AAD (420404, Biolegend) diluted in 1:1 Human serum AB (H4522, Sigma) in Dulbecco’s PBS (50% HS-DPBS). Single-stained and fluorescence minus one controls were generated by pooling multiple donors together, stained and acquired alongside samples. Sample acquisition was performed using Intellicyte IQUE flow cytometer and flow cytometry file analysis using FlowJo (10.5.3 version). The gating strategy is described in Supplementary Figure 7 to quantify Th cell (CD3+CD4+) proliferation. Here, the mean percentage of the cells subject to cell division in the plus sample (antibody or KLH) wells was divided by the mean percentage of the cells subject to cell division in the negative (medium only) control to obtain an SI value for each antibody or KLH and donor combination. Outliers within the sextuplet groups were removed by performing robust regression and outlier removal (ROUT) with a ROUT coefficient Q =5% (GraphPad Prism version 8) prior to calculating the average SIs for each test/donor combination (depicted as a dot-plot in ). To test for statistical significance compared with the media only control, a Student’s t-test analysis was performed. Here, the average SIs for each test sample was then compared with the negative control (medium only) using a two-tailed unpaired (student) T test (GraphPad Prism version 8). A sample was deemed immunogenic when P < .05 and SI ≥ 2. The proliferation data was further analyzed by calculating an RI, which is frequency of donors responding (P < .05 and S I ≥ 2) multiplied by the average strength (SI) of response.
Human Th CD4+ activation marker assay
Haplotyped human PBMCs (0.5 mL, at 4–6 × 10⁶ cells/mL) prepared as described above, were incubated with different antibodies (0.5 mL, 90 µg/mL) or KLH (0.5 mL, 90 µg/m) in 24-well plates (CLS3527, Corning). On day 5 cells were mixed and transferred to a separate plate and labeled with anti-CD3-FITC (300440, Biolegend), anti-CD4-PE-Cy7 (317410, Biolegend), anti-marker-PE (CD69-PE 310910, CD71-PE 334105, CD25-PE 302605 or CD40L-PE 310805, obtained from Biolegend) and To-PRO-3 (T3605, ThermoFisher). Flow cytometry gating was as described in Supplementary Figure 7 and data analysis was performed by using FlowJo software (BD Life Sciences).
Abbreviations
Supplemental Material
Download Zip (4.2 MB)Supplementary material
Supplemental data for this article can be accessed on the publisher’s website.
References
- Kaplon H, Muralidharan M, Schneider Z, Reichert JM. Antibodies to watch in 2020. mAbs. 2020;12:1703531.
- Wörn A, Plückthun A. Stability engineering of antibody single-chain Fv fragments1. J Mol Biol. 2001;305(5):989–18. doi:https://doi.org/10.1006/jmbi.2000.4265.
- Dudgeon K, Rouet R, Kokmeijer I, Schofield P, Stolp J, Langley D, Stock D, Christ D. General strategy for the generation of human antibody variable domains with increased aggregation resistance. Proc Natl Acad Sci U S A. 2012;109(27):10879–84. doi:https://doi.org/10.1073/pnas.1202866109.
- Famm K, Hansen L, Christ D, Winter G. Thermodynamically stable aggregation-resistant antibody domains through directed evolution. J Mol Biol. 2008;376(4):926–31. doi:https://doi.org/10.1016/j.jmb.2007.10.075.
- Jain T, Sun T, Durand S, Hall A, Houston NR, Nett JH, Sharkey B, Bobrowicz B, Caffry I, Yu Y. Biophysical properties of the clinical-stage antibody landscape. Proc Natl Acad Sci U S A. 2017;114(5):944–49. doi:https://doi.org/10.1073/pnas.1616408114.
- Starr CG, Tessier PM. Selecting and engineering monoclonal antibodies with drug-like specificity. Curr Opin Biotechnol. 2019;60:119–27.
- Parthiban K, Perera RL, Sattar M, Huang Y, Mayle S, Masters E, Griffiths D, Surade S, Leah R, Dyson MR, et al. A comprehensive search of functional sequence space using large mammalian display libraries created by gene editing. mAbs. 2019;11(5):884–98. doi:https://doi.org/10.1080/19420862.2019.1618673.
- Ratanji KD, Derrick JP, Dearman RJ, Kimber I. Immunogenicity of therapeutic proteins: influence of aggregation. J Immunotoxicol. 2014;11(2):99–109. doi:https://doi.org/10.3109/1547691X.2013.821564.
- Moussa EM, Panchal JP, Moorthy BS, Blum JS, Joubert MK, Narhi LO, Topp EM. Immunogenicity of therapeutic protein aggregates. J Pharm Sci. 2016;105(2):417–30. doi:https://doi.org/10.1016/j.xphs.2015.11.002.
- Nabhan M, Pallardy M, Turbica I. Immunogenicity of bioproducts: cellular models to evaluate the impact of therapeutic antibody aggregates. Front Immunol. 2020;11:1664–3224. doi:https://doi.org/10.3389/fimmu.2020.00725.
- Ridker PM, Tardif J-C, Amarenco P, Duggan W, Glynn RJ, Jukema JW, Kastelein JJP, Kim AM, Koenig W, Nissen S. Lipid-reduction variability and antidrug-antibody formation with bococizumab. N Engl J Med. 2017;376(16):1517–26. doi:https://doi.org/10.1056/NEJMoa1614062.
- Carr FJ, Baker MP. Recombinant antibodies for immunotherapy. In Little M, ed. Cambridge: Cambridge University Press; 2009. pp. 43–52.
- Buchanan A, Clementel V, Woods R, Harn N, Bowen MA, Mo W, Popovic B, Bishop SM, Dall’Acqua W, Minter R, et al. Engineering a therapeutic IgG molecule to address cysteinylation, aggregation and enhance thermal stability and expression. mAbs. 2013;5(2):255–62. doi:https://doi.org/10.4161/mabs.23392.
- Dobson CL, Devine PWA, Phillips JJ, Higazi DR, Lloyd C, Popovic B, Arnold J, Buchanan A, Lewis A, Goodman J, et al. Engineering the surface properties of a human monoclonal antibody prevents self-association and rapid clearance in vivo. Sci Rep. 2016;6(1):38644. doi:https://doi.org/10.1038/srep38644.
- Bethea D, Wu S-J, Luo J, Hyun L, Lacy ER, Teplyakov A, Jacobs SA, O’Neil KT, Gilliland GL, Feng Y, et al. Mechanisms of self-association of a human monoclonal antibody CNTO607. Protein Eng Des Sel. 2012;25(10):531–38. doi:https://doi.org/10.1093/protein/gzs047.
- Jacobs SA, Wu SJ, Feng Y, Bethea D, O’Neil KT. Cross-interaction chromatography: A rapid method to identify highly soluble monoclonal antibody candidates. Pharm Res. 2010;27(1):65–71. doi:https://doi.org/10.1007/s11095-009-0007-z.
- Nobbmann U, Connah M, Fish B, Varley P, Gee C, Mulot S, Chen J, Zhou L, Lu Y, Sheng F, et al. Dynamic light scattering as a relative tool for assessing the molecular integrity and stability of monoclonal antibodies. Biotechnol Genet Eng Rev. 2007;24(1):117–28. doi:https://doi.org/10.1080/02648725.2007.10648095.
- Chao G, Lau WL, Hackel BJ, Sazinsky SL, Lippow SM, Wittrup KD. Isolating and engineering human antibodies using yeast surface display. Nat Protoc. 2006;1(2):755–68. doi:https://doi.org/10.1038/nprot.2006.94.
- van den Beucken T. Affinity maturation of fab antibody fragments by fluorescent-activated cell sorting of yeast-displayed libraries. FEBS Lett. 2003;546:288–94.
- Ferri N, Corsini A, Sirtori CR, Ruscica M. Bococizumab for the treatment of hypercholesterolaemia. Expert Opin Biol Ther. 2017;17(2):237–43. doi:https://doi.org/10.1080/14712598.2017.1279602.
- Liang H, Chaparro-Riggers J, Strop P, Geng T, Sutton JE, Tsai D, Bai L, Abdiche Y, Dilley J, Yu J. Proprotein convertase substilisin/kexin type 9 antagonism reduces low-density lipoprotein cholesterol in statin-treated hypercholesterolemic nonhuman primates. J Pharmacol Exp Ther. 2012;340(2):228. doi:https://doi.org/10.1124/jpet.111.187419.
- Sun A, Benet LZ. Late-stage failures of monoclonal antibody drugs: a retrospective case study analysis. Pharmacology. 2020;105(3–4):145–63. doi:https://doi.org/10.1159/000505379.
- Dyson MR, Shadbolt SP, Vincent KJ, Perera RL, McCafferty J. Production of soluble mammalian proteins in Escherichia coli: identification of protein features that correlate with successful expression. BMC Biotechnol. 2004;4(1):32. doi:https://doi.org/10.1186/1472-6750-4-32.
- Kelly RL, Yu Y, Sun T, Caffry I, Lynaugh H, Brown M, Jain T, Xu Y, Wittrup KD. Target-independent variable region mediated effects on antibody clearance can be FcRn independent. mAbs. 2016;8(7):1269–75. doi:https://doi.org/10.1080/19420862.2016.1208330.
- Liu Y, Caffry I, Wu J, Geng SB, Jain T, Sun T, Reid F, Cao Y, Estep P, Yu Y, et al. High-throughput screening for developability during early-stage antibody discovery using self-interaction nanoparticle spectroscopy. mAbs. 2014;6(2):483–92. doi:https://doi.org/10.4161/mabs.27431.
- Jones TD, Crompton LJ, Carr FJ, Baker MP. Therapeutic antibodies: methods and protocols. In Dimitrov AS, ed. Totowa (NJ): Humana Press; 2009. pp. 405–23.
- Wullner D, Zhou L, Bramhall E, Kuck A, Goletz TJ, Swanson S, Chirmule N, Jawa V. Considerations for optimization and validation of an in vitro PBMC derived T cell assay for immunogenicity prediction of biotherapeutics. Clin Immunol. 2010;137(1):5–14. doi:https://doi.org/10.1016/j.clim.2010.06.018.
- Walsh RE, Lannan M, Wen Y, Wang X, Moreland CA, Willency J, Knierman MD, Spindler L, Liu L, Zeng W. Post-hoc assessment of the immunogenicity of three antibodies reveals distinct immune stimulatory mechanisms. mAbs. 2020;12(1):1764829. doi:https://doi.org/10.1080/19420862.2020.1764829.
- Paul S, Kolla RV, Sidney J, Weiskopf D, Fleri W, Kim Y, Peters B, Sette A. Evaluating the immunogenicity of protein drugs by applying in vitro mhc binding data and the immune epitope database and analysis resource. Clin Dev Immunol. 2013;2013:467852–467852. doi:https://doi.org/10.1155/2013/467852.
- Vita R, Mahajan S, Overton JA, Dhanda SK, Martini S, Cantrell JR, Wheeler DK, Sette A, Peters B. The immune epitope database (IEDB): 2018 update. Nucleic Acids Res. 2018;47(D1):D339–D343. doi:https://doi.org/10.1093/nar/gky1006.
- Paul S, Lindestam Arlehamn CS, Scriba TJ, Dillon MBC, Oseroff C, Hinz D, McKinney DM, Carrasco Pro S, Sidney J, Peters B. Development and validation of a broad scheme for prediction of HLA class II restricted T cell epitopes. J Immunol Methods. 2015;422:28–34. doi:https://doi.org/10.1016/j.jim.2015.03.022.
- Dhanda SK. Predicting HLA CD4 immunogenicity in human populations. Front Immunol. 2018;9:1369.
- Gandhi M, Alwawi E, Gordon KB. Anti-p40 antibodies ustekinumab and briakinumab: blockade of interleukin-12 and interleukin-23 in the treatment of psoriasis. Semin Cutan Med Surg. 2010;29(1):48–52. doi:https://doi.org/10.1016/j.sder.2010.02.001.
- Schoch A, Kettenberger H, Mundigl O, Winter G, Engert J, Heinrich J, Emrich T. Charge-mediated influence of the antibody variable domain on FcRn-dependent pharmacokinetics. Proc Natl Acad Sci U S A. 2015;112(19):5997–6002. doi:https://doi.org/10.1073/pnas.1408766112.
- Xu Y, Roach W, Sun T, Jain T, Prinz B, Yu T-Y, Torrey J, Thomas J, Bobrowicz P, Vasquez M. Addressing polyspecificity of antibodies selected from an in vitro yeast presentation system: a FACS-based, high-throughput selection and analytical tool. Protein Engineering Design and Selection. 2013;26(10):663–70. doi:https://doi.org/10.1093/protein/gzt047.
- Kelly RL, Le D, Zhao J, Wittrup KD. Reduction of nonspecificity motifs in synthetic antibody libraries. J Mol Biol. 2018;430(1):119–30. doi:https://doi.org/10.1016/j.jmb.2017.11.008.
- Kelly RL, Geoghegan JC, Feldman J, Jain T, Kauke M, Le D, Zhao J, Wittrup KD. Chaperone proteins as single component reagents to assess antibody nonspecificity. mAbs. 2017;9(7):1036–40. doi:https://doi.org/10.1080/19420862.2017.1356529.
- Datta-Mannan A, Thangaraju A, Leung D, Tang Y, Witcher DR, Lu J, Wroblewski VJ. Balancing charge in the complementarity-determining regions of humanized mAbs without affecting pI reduces non-specific binding and improves the pharmacokinetics. mAbs. 2015;7(3):483–93. doi:https://doi.org/10.1080/19420862.2015.1016696.
- Hötzel I, Theil F-P, Bernstein LJ, Prabhu S, Deng R, Quintana L, Lutman J, Sibia R, Chan P, Bumbaca D. A strategy for risk mitigation of antibodies with fast clearance. mAbs. 2012;4(6):753–60. doi:https://doi.org/10.4161/mabs.22189.
- Zhang H, Wilson IA, Lerner RA. Selection of antibodies that regulate phenotype from intracellular combinatorial antibody libraries. Proc Natl Acad Sci. 2012;109(39):15728–33. doi:https://doi.org/10.1073/pnas.1214275109.
- Beerli RR, Bauer M, Buser RB, Gwerder M, Muntwiler S, Maurer P, Saudan P, Bachmann MF. Isolation of human monoclonal antibodies by mammalian cell display. Proc Natl Acad Sci U S A. 2008;105(38):14336–41. doi:https://doi.org/10.1073/pnas.0805942105.
- Breous-Nystrom E, Schultze K, Meier M, Flueck L, Holzer C, Boll M, Seibert V, Schuster A, Blanusa M, Schaefer V. Retrocyte Display® technology: generation and screening of a high diversity cellular antibody library. Methods. 2014;65(1):57–67. doi:https://doi.org/10.1016/j.ymeth.2013.09.003.
- Waldmeier L, Hellmann I, Gutknecht CK, Wolter FI, Cook SC, Reddy ST, Grawunder U, Beerli RR. Transpo-mAb display: transposition-mediated B cell display and functional screening of full-length IgG antibody libraries. mAbs. 2016;8(4):726–40. doi:https://doi.org/10.1080/19420862.2016.1160990.
- Haghparast SM, Kihara T, Miyake J. Distinct mechanical behavior of HEK293 cells in adherent and suspended states. PeerJ. 2015;3:e1131. doi:https://doi.org/10.7717/peerj.1131.
- Sun Z, Brodsky JL. Protein quality control in the secretory pathway. J Cell Biol. 2019;218:3171–87.
- Rivera VM. Regulation of protein secretion through controlled aggregation in the endoplasmic reticulum. Science. 2000;287(5454):826–30. doi:https://doi.org/10.1126/science.287.5454.826.
- Apaja PM, Lukacs GL. Protein homeostasis at the plasma membrane. Physiology (Bethesda). 2014;29:265–77.
- Boder ET, Wittrup KD. Yeast surface display for screening combinatorial polypeptide libraries. Nat Biotechnol. 1997;15(6):553–57. doi:https://doi.org/10.1038/nbt0697-553.
- Dupres V, Dufrene YF, Heinisch JJ. Measuring cell wall thickness in living yeast cells using single molecular rulers. ACS Nano. 2010;4(9):5498–504. doi:https://doi.org/10.1021/nn101598v.
- McMahon C, Baier AS, Pascolutti R, Wegrecki M, Zheng S, Ong JX, Erlandson SC, Hilger D, Rasmussen SGF, Ring AM, et al. Yeast surface display platform for rapid discovery of conformationally selective nanobodies. Nat Struct Mol Biol. 2018;25(3):289–96. doi:https://doi.org/10.1038/s41594-018-0028-6.
- Schuck P, Zhao H. The role of mass transport limitation and surface heterogeneity in the biophysical characterisation of macromolecular binding processes by SPR biosensing. Methods Mol Biol. 2010;627:15–54.
- Molecular Operating Environment (MOE). Chemical computing group ULC. 1010 Sherbrooke St. West (Suite #910, Montreal, QC, Canada); Chemical Computing Group; 2019. p. H3A 2R7.
- Kieke MC, Shusta EV, Boder ET, Teyton L, Wittrup KD, Kranz DM. Selection of functional T cell receptor mutants from a yeast surface-display library. Proc Natl Acad Sci U S A. 1999;96(10):5651–56. doi:https://doi.org/10.1073/pnas.96.10.5651.
- Jones TD, Phillips WJ, Smith BJ, Bamford CA, Nayee PD, Baglin TP, Gaston JSH, Baker MP.Identification and removal of a promiscuous CD4+ T cell epitope from the C1 domain of factor VIII. J Thromb Haemost. 2005;3(5):991–1000. doi:https://doi.org/10.1111/j.1538-7836.2005.01309.x.
- Quah BJ, Warren HS, Parish CR. Monitoring lymphocyte proliferation in vitro and in vivo with the intracellular fluorescent dye carboxyfluorescein diacetate succinimidyl ester. Nat Protoc. 2007;2(9):2049–56. doi:https://doi.org/10.1038/nprot.2007.296.