
ABSTRACT
The heterogeneity of glycosylation on therapeutic monoclonal antibodies (mAbs) may affect the safety and efficacy of these agents. In particular, glycans of nonhuman origin, such as galactose-alpha-1,3-galactose (gal-α-gal) and N-glycolylneuraminic acid (NGNA), in the Fc region of therapeutic mAbs produced from murine cell lines carry a risk of immunogenicity. Immunogenic glycan structures can have immune-mediated clearance, resulting in faster clearance from in vivo circulation than non-immunogenic structures. To demonstrate the impact of these Fc nonhuman glycans on in vivo clearance, we purified and analyzed the glycan profile of a monoclonal antibody (mAb1) from human serum samples collected from clinical study participants. We purified mAb1 in a three-step chromatographic separation process (protein A, immobilized anti-mAb1 antibody affinity, and weak cation exchange chromatography) and extracted and labeled its N-linked oligosaccharide structures with 2-aminobenzamide acid for analysis on ultrahigh-performance hydrophilic interaction liquid chromatography. A comparison of the glycan profile of mAb1 recovered from human serum on the same day and 4 weeks after dosing revealed no significant differences, indicating similar clearance of mAb1 with nonhuman gal-α-gal or NGNA glycan in the Fc region compared with the human glycans. The relative proportions of the glycans remained similar, and all patients who had already received multiple doses of mAb1 over the course of a year were negative for antidrug antibodies, suggesting that none of the glycans induced an immune response. Therefore, we concluded that mAb1 gal-α-gal and NGNA glycoforms represent a low risk of conferring immunogenicity.
Introduction
Glycosylation is a common posttranslational modification in therapeutic monoclonal antibodies (mAbs), and it contributes substantially to the heterogeneity of protein glycans. In therapeutic mAbs, complex-type biantennary glycans are typically found when mammalian expression systems are used. Glycosylation can occur in the constant crystallizable fragment (Fc) region or in the variable antigen-binding fragment (Fab) region of mAbs. N-glycans in the Fab region differ from the oligosaccharides in the Fc region in that they are generally more galactosylated and abundant with sialic acids.Citation1 This heterogeneity of glycan structures on therapeutic mAbs may affect their pharmacokinetics (PK) and bioactivity.Citation2–12 For example, high mannose content has been shown to increase in vivo serum clearance of mAbs due to the presence of mannose receptors in the human body, which play a critical role in binding and removal of mannose-containing molecules.Citation2,Citation3,Citation7,Citation12 Studies have shown, however, that the heterogeneity of major glycans (e.g., G0f, G1f, and G2f) in the Fc region does not seem to have a significant impact on serum clearance.Citation1,Citation3
Most therapeutic mAbs are produced from Chinese hamster ovary, NS0, or Sp2/0 cell lines.Citation13,Citation14 When mAbs are produced from murine cell lines (NS0 and SP2/0), nonhuman glycan structures, such as galactose-alpha-1,3-galactose (gal-α-gal) and N-glycolylneuraminic acid (NGNA), can contribute to the heterogeneity of glycosylation.Citation4,Citation15–17 Nonhuman glycan structures have also been observed in CHO cell lines.Citation18 Theoretically, these nonhuman glycan structures may cause immune responses that can affect the in vivo clearance of mAbs.Citation15,Citation19–21 Gal-α-gal and NGNA can be present in the Fab region or the Fc region or both domains of mAbs. It has been reported that gal-α-gal in the Fab region of cetuximab causes hypersensitivity reactions to red meat for patients who have preexisting immunoglobulin E antibodies against gal-α-gal.Citation17 In contrast, the impact of gal-α-gal in the Fc region of mAbs has been unclear.Citation1,Citation19
Studies on the efficacy and safety of mAbs have often reported that immunogenicity can potentially increase immune-mediated clearance or adverse effects of these therapeutic agents.Citation22–26 In humans, anti–gal-α-gal and anti-NGNA antibodies constitute as much as 1% and 0.1–0.2%, respectively, of circulating immunoglobulin G (IgG) and may initiate an immune response when gal-α-gal- or NGNA-attached substances enter the body.Citation1,Citation20,Citation23,Citation27,Citation28 Assessment of antidrug antibodies (ADAs) on drug administration is used to measure the level of clinical immunogenicity of mAbs.Citation5,Citation22,Citation29 However, it can be difficult to directly measure ADAs against gal-α-gal and NGNA because ADAs are only temporally present in serum, and so may not be in the range of detection.Citation30 In addition, ethical and safety reasons preclude the inclusion of a proper control group in immunogenicity-related studies, as this would involve exposing individuals known to develop immunogenic response to the potentially immunogenic substances. To overcome these challenges, we applied an indirect approach to assess the immunogenicity of glycan structures by determination of in vivo clearance of a mAb with glycan structure heterogeneity. We hypothesized that immunogenic glycan structures would have an immune-mediated clearance, resulting in faster clearance from in vivo circulation than non-immunogenic structures. Similar clearance rates are indicative of the lack of immunogenic response to glycan structures.
Chen et al. and Goetze et al. demonstrated the effect of Fc glycan forms on the clearance of therapeutic IgG antibody in humans by affinity purification of IgG1 or IgG2 from serum.Citation2,Citation3 Their groups achieved more than 90% purity of extracted IgGs from sera by using a single purification step, which was sufficient to assess differences in changes for major glycan species and high mannose species. However, due to interference from glycans originating from serum proteins, low-presenting glycans, such as sialic acids, from mAbs could not be accurately quantitated. Alessandri et al. monitored eight glycans of therapeutic mAbs purified from clinical human sera by affinity purification and concluded that the oligomannose species were cleared faster than fucosylated biantennary oligosaccharide structures.Citation7 They confirmed the recovery of mAb by weak cation exchange chromatography (WCX) before analyzing glycan profiles by normal-phase high-performance liquid chromatography (HPLC).
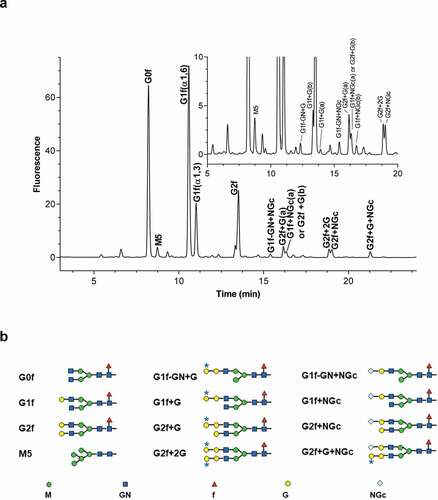
Here, we report the development of a purification method to recover and enrich a proprietary IgG1 therapeutic protein, designated mAb1, from human serum with high purity by a multi-chromatographic separation method. This procedure enabled us to compare minor glycan species, such as gal-α-gal and NGNA, along with the major glycans of mAb1. Glycan profiles of mAb1 on ultra-performance liquid chromatography (UPLC) with peak identification (a) and structures of glycan peaks (b) are shown in . All glycan peaks were identified using liquid chromatography–mass spectrometry analysis and exoglycosidases.
Figure 1. Glycan profiles of mAb1 by UPLC (a); inset shows enlarged figure. (b) Structures of glycans; asterisks indicate galactose-alpha-1,3-galactose linkages (b). G, galactose; GN, N-acetyl-glucosamine; M, mannose; f, fucose; NGc, N-glycolylneuraminic acid
The three-step chromatographic method comprises protein A separation, anti-mAb1 affinity fractionation, and WCX purification in series. The robustness of the method was determined by confirming the recovery and purity of spiked mAb1 in commercially available human serum. The purification method was then applied to 14 clinical serum samples collected from seven clinical study participants both at d 337 (after the final dose [T0]) and d 365 (4 weeks after the final dose [TF]). The study participants had an autoimmune disease and were administered a high dose (several fold higher than therapeutic dose) of mAb1 by intravenous infusion every 4 weeks for 48 weeks. By comparing the glycan heterogeneity of purified mAb1 in sera collected at two time points, we were able to determine whether there was any preferential clearance of mAb1 with different Fc glycan structures in vivo. Because the mAb1 glycans that were tested are present only in the Fc region of the antibody, the impact, if any, of glycan heterogeneity on serum clearance would most likely be due to different glycan structures in the Fc region. The method described here may be applicable to efforts to compare the glycan profiles by HPLC, whether domain specific or global, of mAbs in clinical samples.
Results
Purification method development
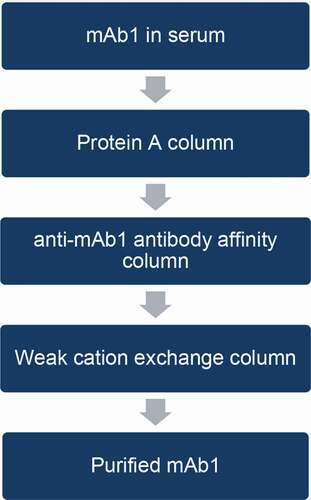
A three-step chromatographic column purification scheme was developed to extract and enrich mAb1 from the sera of patients administered the drug. The purification scheme entails the use of a protein A column, followed by an anti-mAb1 affinity column, and finally an ion-exchange column ().
Figure 2. Purification scheme for mAb1 from human serum
mAb1 purification and glycan profiling
The protein A column captured IgGs in serum, including mAb1, and removed non-IgG proteins and other serum components from the sample. This step improved binding efficiency by reducing nonspecific binding of serum proteins in the next step, in which mAb1 was purified on an anti-mAb1 antibody affinity column. The anti-mAb1 affinity column captured mAb1 and removed the majority of other IgGs from the protein A column.
The glycan profiles of mAb1 () and serum () were compared with that of mAb1 purified from serum by a two-step process (protein A and immobilized anti-mAb1 antibody column) (). Due to nonspecific binding of serum proteins onto the immobilized anti-mAb1 antibody column, noticeable interferences in glycan profile by serum glycoproteins were still observed after the two-step purification. Hence, an additional purification step was needed.
Figure 3. Comparison of UPLC glycan profiles. (a) mAb1; (b) human serum; (c) mAb1 from human serum purified only by protein A and immobilized anti-mAb1 affinity columns; (d) mAb1 from human serum purified by protein A, immobilized anti-mAb1 affinity, and WCX columns. Arrows in (c) indicate glycan species present in serum proteins, which may interfere with mAb1 glycan profiles. After two-step purification, the interference peaks from serum proteins were not completely removed (c), and major glycan species of mAb1 co-eluted with glycans from serum. The peak marked with an asterisk (c, d) showed a specific glycan peak observed only in serum glycoproteins and used to confirm purification efficiency. After three-step purification, this major serum glycan interference was significantly reduced (d), and both glycan profiles before (a) after (d) were comparable
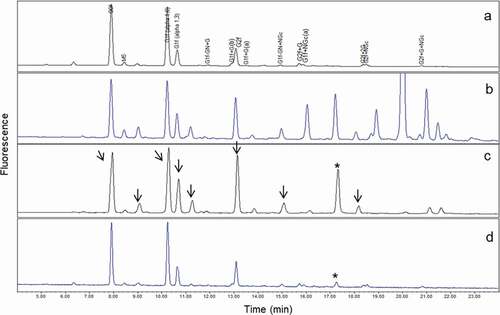
WCX was added as an additional purification step to remove serum glycoproteins before analysis of glycan profiles. WCX has been widely used as a protein purification tool because of its high specificity for separation of proteins with different surface charges. When WCX was implemented, interfering serum glycans were significantly reduced (). Arrows in ) indicate the level of interference by serum proteins upon analysis of glycans from serum mAb1 purified by the first two steps (protein A and anti-mAb1 antibody affinity columns). The peak indicated by the asterisk in was used to compare the level of interference by glycans from serum proteins. This specific peak was not observed in mAb1 glycan profiles but was present in serum at levels similar to those of major glycan species (G0f, G1f, and G2f) (). It was therefore used as an indicator of the level of serum glycan interference in the glycan profiles of final purified mAb1 products. )shows that the glycan profile of purified mAb1 was similar to that of non-purified mAb1 () after WCX was implemented as a third purification step. Although some sample loss was expected during WCX purification, achieving greater purity was considered to be more critical than obtaining a higher yield. The interfering serum glycan peak at 17.4 minutes (indicated by the asterisks in ) was reduced from 13.4% to 2.8% after purification by WCX. This result confirmed that the purity of mAb1 extracted from serum after three-step chromatographic purification was sufficiently high for glycan analysis of mAb1 with negligible interference by serum-related glycans.
Recovery of mAb1 glycan structures
Recovery of mAb1 glycans following three-step purification
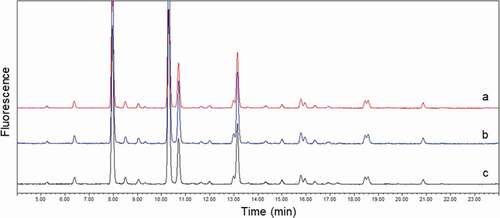
To confirm that the purification process itself did not have an impact on mAb1 glycan profiles, we compared the glycan profiles of non-purified mAb1 with those of two process controls that were purified by the three-step process (). The process controls (mAb1 from phosphate-buffered saline (PBS buffer () and mAb1 from serum () purified by the three-step process) showed the same glycan profiles as the non-purified mAb1 control ()), indicating that the multiple purification steps did not change the glycan profile. It was also confirmed that interference by glycans from serum proteins was negligible, as shown by the well-overlapping profiles in ,c.
Figure 4. Comparison of glycan profiles. (a) mAb1 without purification; (b) mAb1 purified from PBS buffer with three-step purification; and (c) mAb1 purified from serum with three-step purification. Overlay of three profiles demonstrated that interference by serum glycoproteins in mAb1 glycan profile was negligible after three-step purification
Recovery of glycan profile from degraded mAb1
Because the clinical serum samples had been collected at different times (d 337 [T0] and d 365 [TF]), mAb1 collected at TF was expected to be more degraded than that collected at T0, due to longer exposure to in vivo conditions. Therefore, it was important to verify that the three-step purification method could equally purify both fresh and degraded mAb1 with good recovery of glycan profiles. This was done because, if any differences occurred in the binding efficiencies of fresh and degraded mAb1 on any of the three columns, the differences in glycans between T0 mAb1 and TF mAb1 could be misattributed to the chromatographic process rather than to preferential clearance in serum caused by glycan heterogeneity of the product. To verify that there was no difference in the binding affinities to the three columns of two differently degraded mAb1 substances, we tested mAb1 that was heat stressed at either 25℃ or 40℃ for 3 months in formulation buffer pH 6.0. The two heat-stressed (degraded) mAb1 were then spiked in serum and purified by the three-step purification process, and their glycan profiles were compared. The differences in peak shapes on WCX () for the two heat-stressed mAb1 were primarily due to deamidation, which is common during the heat stress of mAbs. Other minor modifications contributing to the change of chromatographic profiles on WCX include aggregation and fragmentation. An in-house study of in-vitro incubation of mAb1 in serum, to mimic what happens to mAb1 in vivo, also showed similar degradation pathways (data not shown). Because the duration of the stress study (3 months) is longer than the exposure of the mAb1 to in vivo conditions (4 weeks), the heat-stressed mAb1 is considered a worse case for assessment of suitability of the purification method.
Figure 5. Comparison of WCX chromatograms (a) and glycan profiles (b) among non-purified mAb1 and degraded mAb1 stressed at 25℃ or 40℃ for 3 months and spiked in and purified from serum
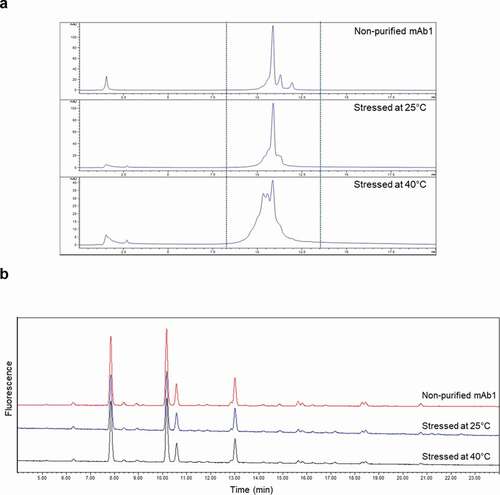
When mAb1 stressed at 25℃ or 40℃ was spiked in serum and purified by the three-step purification process, no significant changes were found in glycan profiles compared with non-purified mAb1 (), ). It is assumed that the structure of degraded mAb1 was sufficiently maintained to interact with protein A and the anti-mAb1. In addition, no significant changes in glycan profiles were observed for degraded mAb1 from in-house stability studies (data not shown). Hence, it was determined that the three-step purification method can be used to test variously degraded materials.
Table 1. Glycan analysis of degraded mAb1
Evaluation of glycan recovery by serum lot-to-lot (matrix)
To evaluate the impact of differences in serum protein compositions among study participants, we tested two human serum lots for purification efficiency. mAb1 was spiked in two different commercially available pooled human serum lots and processed by three-step purification. When glycan profiles were compared with those of non-processed mAb1, no significant change was observed (data not shown), indicating that no significantly different level of interference by serum glycoproteins should be expected during the analysis of patient serum samples.
Glycan profiles of mAb1 in clinical samples
After confirming the robustness and specificity of the purification process for mAb1 from serum, we tested T0 and TF serum samples acquired from each of seven patients in the clinical study, for a total of 14 serum samples. mAb1 spiked in PBS and mAb1 spiked in serum were used as process controls. Results of in-house enzyme-linked immunosorbent assay to measure mAb1 concentrations at both time points were used to determine the amount of serum to be purified for 100 µg of mAb1 (data not shown). All 14 clinical serum samples and the process controls, as well as non-purified mAb1, were processed in single batch by the three-step purification method followed by glycan analysis. The amount of recovered mAb1 after three-step purification is shown in .
Table 2. Recovered mAb1 from three-step purification process
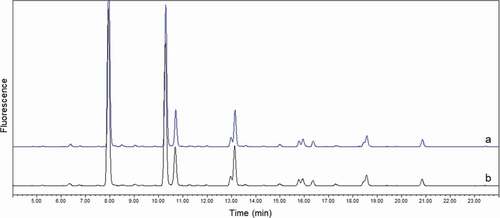
Overlaid oligosaccharide profiles of the first patient serum samples are shown in . No significant changes were observed in oligosaccharide profiles of TF mAb1 compared with the T0 sample. The overlap of the profiles indicates that there was no difference in clearance of mAb1 with different oligosaccharide structures.
Figure 6. Overlay of glycan profiles of purified mAb1 from clinical study patient. (a) patient 1 at T0; (b) patient 1 at TF. No significant differences were observed between two samples, especially for minor glycan species
A comparison of the major glycans among all tested samples from seven patients is shown in and . The results indicate that mAb1 containing major oligosaccharides (G0f, G1f, and G2f) had similar clearance in serum, which is consistent with previously reported data.Citation1,Citation3 Differences in glycan structures between patients are due to use of different batches of mAb1.
Table 3. Glycan analysis of mAb1 purified from 14 clinical sera
Figure 7. Comparison of major glycans (G0f, G1f, G2f) between T0 and TF. T0 (black): samples taken from patients after receiving final dose on d 337; TF (gray) samples taken from patients on d 365 (4 weeks of final dose)
and show the levels of the mAb1 containing nonhuman oligosaccharide structures (gal-α-gal and NGNA). The levels were generally similar for T0 and TF. Although the data may appear to show a slight decrease in glycan levels between T0 and TF for some patients, these differences were within the variability of the experiments and PK data and have no significant or practical impact on in vivo PK. Therefore, the results indicate no difference in clearance of nonhuman gal-α-gal and NGNA glycans compared with the human major glycans (G0f, G1f, G2f). These results also indicate that the glycans were cleared by a similar mechanism, and that there was no additional clearance mechanism, such as immune response–mediated clearance, for the nonhuman glycans.
Figure 8. Comparison of Gal-α-Gal and NGNA between T0 and TF. T0 (black): samples taken from patients after receiving final dose on d 337; TF (gray) samples taken from patients on d 365 (4 weeks of final dose)
M5 is the only glycoform reported to have an increased clearance rate relative to other glycans. Although our study showed a trend toward preferential clearance of mAb1 with M5 similar to previous data,Citation7 this finding cannot be considered conclusive because of the very low level of M5 (<0.5% of total peaks) in mAb1 ( and ).
Figure 9. Changes in levels of Mannose 5 between T0 and TF. T0 (black): samples taken from patients after receiving final dose on d 337; TF (gray) samples taken from patients on d 365 (4 weeks of final dose)
Discussion
In this study, we evaluated the in vivo clearance of nonhuman glycans compared with that of human glycans in mAb1 expressed by NS0 cells. Efforts to directly quantitate Fc glycan structures on therapeutic mAbs in vivo have been challenging, due to the low concentration of mAbs in serum and the difficulties inherent in the mAb purification process to acquire mAbs in high purity. We developed a robust mAb1 purification method for Fc glycan analysis that produced very low interference by human serum protein glycans. This three-step chromatographic purification process consisted of: (1) protein A column chromatography, (2) immobilized anti-mAb1 antibody affinity column chromatography, and (3) WCX. The three-step process demonstrated high specificity (with high purity) and acceptable recovery of mAb1 from clinical serum samples for characterization of in vivo product quality.
Following the administration of mAb1 to patients, the relative amounts of major human glycans (G0f, G1f, and G2f) and nonhuman gal-α-gal and NGNA glycans remained similar over a course of 4 weeks. The minor differences that were observed were within the experimental variability. The gal-α-gal and NGNA glycans were minor peaks (<4% each). At this level, the precision of the glycan method is around 10% coefficient of variation (CV). The observed differences are therefore not significant when assay precision is considered. Furthermore, the observed variability in glycan levels is well within the variability of half-life as determined from the clinical trials. This result indicates that there are insignificant differences in the glycans clearance rates in humans. Although the clearance of major glycans (G0f, G1f, G2f) has been reported in the literature,Citation1,Citation3 here we report for the first time, to our knowledge, the clearance of nonhuman gal-α-gal and NGNA glycans in humans. Our results support the PK characterization of the glycans and can also provide insight into the immunogenicity assessment of nonhuman glycans.
Therapeutic antibody structures can trigger an immune response, which results in an immune-mediated clearance mechanism that can change the PK profile of mAbs in humans.Citation15,Citation19–21 Several studies conducted with therapeutic mAbs, including palivizumab, natalizumab, adalimumab, and infliximab, have found the presence of ADAs to be associated with lower measured levels of the drug. For example, palivizumab has been found to have a 20% higher clearance in children with ADA, and a 90% reduction in serum drug levels has been correlated with ADA against natalizumab.Citation24
In humans, gal-α-gal and NGNA may initiate an immune response when they enter the body,Citation1,Citation20,Citation23,Citation27,Citation28 potentially resulting in faster clearance. The results of our study show that clearance of mAb1 is not affected by glycan structure. Because the patient serum samples were analyzed after patients had already received multiple doses of mAb1 over the course of a year, any potential immune response, along with any impact of immune-related clearance, would have been observable by the time of analysis.
The relative proportions of the glycans remained similar and all patients were ADA negative, suggesting that none of the glycans induced an immune response. Therefore, we conclude that mAb1 containing gal-α-gal and NGNA has a low risk of immunogenicity for the patients evaluated in this study. While the conclusion is based on data from all seven patents, collection of additional data from a larger number of patients can further support this conclusion. Furthermore, additional evaluation of several other mAbs and disease indications will be needed to make a broader claim of low immunogenicity for gal-α-gal and/or NGNA. Additional experiments should be performed in order to prove that N-glycans do not influence the clearance of the mAbs in the context of an immune response. The approach presented in this study can be used in future studies to corroborate our results with those of other Fc-linked N-glycans from mAbs produced in murine cell lines.
Materials and methods
Ethics statement
The study from which patient serum samples were obtained was carried out in accordance with the Declaration of Helsinki and was approved by appropriate institutional review boards. All subjects provided written informed consent before undergoing any study procedures.
Chemicals and recombinant proteins
The proprietary mAb1 used in these studies is a fully human IgG1 antibody produced by AstraZeneca. Human sera for method development were purchased from either BioIVT (catalog no. HMSRM, lot BRH638690) or VWR. Anti-mAb1 antibody was prepared in house. The WCX column was obtained from Thermo Fisher Scientific (catalog no. 054993, Propac WCX-10, 4 × 250 mm). The 14 clinical serum samples were acquired from a clinical trial of mAb1.
2-AB (catalog no. A89804) and 2-picoline borane (catalog no. 654213) were purchased from Sigma-Aldrich. PNGase F was purchased from Promega (V4831), and the GlycoClean S-plus cartridge was obtained from Agilent (GKI-4726). The UPLC (M207735 with fluorescence detector) and the UPLC column (Acquity UPLC glycoprotein amide, 300 Å, 1.7 µm, 2.1 × 150 mm, BEH column) were obtained from Waters.
Protein A column chromatography
A prepacked HiTrap 1-mL protein A column (GE Healthcare) was installed on an Agilent 1200 HPLC (Waters) for protein A separation. Serum samples were diluted 1:1 in Dulbecco PBS and filtered through 0.45-μm filters to reduce viscosity before loading. A 1-mL injection loop was installed on the HPLC. Mobile phase A was Dulbecco PBS, pH 7.4, and mobile phase B was 100 mM acetic acid, pH 2.7. An injection volume of up to 950 μL and a flow rate of 0.2 mL/min were used during the run. A stepped gradient with 100% mobile phase B was applied at 10.01 min for 5 min. Total run time was 25 min, and about 1 mL of eluted fraction was collected between 18.8 and 20.8 min. Fifty microliters of 1 M Tris, pH 8.0, was added in fraction vials before fractions were collected to neutralize eluted samples.
Immobilization of anti-mAb1 antibody
Anti-mAb1 antibody was immobilized to N-hydroxysuccinimide (NHS)–activated Sepharose 4 Fast Flow resins (GE Life Sciences) according to the manufacturer’s instructions, with subtle modifications. Briefly, the NHS-activated resins were washed three times with 15-bead volumes of 1 mM hydrochloric acid prior to immobilization. The resins were mixed with anti-mAb1 antibody (1 mg of antibody per 0.5 mL of resin), and the immobilization reaction was allowed to proceed for 48 h at 4℃. The antibody-immobilized resins were then washed five times with 0.1 M sodium bicarbonate, 0.5 M sodium chloride at pH 8.3 to remove any excess non–cross-linked antibody. Unbound NHS groups were quenched by incubating the resins with 0.1 M Tris HCl, pH 8.5, for 4 h. Three cycles of alternating high- and low-pH washes (0.1 M Tris HCl, pH 8.5, and 0.1 M sodium acetate, 0.5 M sodium chloride, pH 4.5) were performed after quenching. The anti-mAb1 antibody–immobilized resins were then stored in PBS at 4℃ .
Purification by anti-mAb1 antibody affinity column
For purification of immobilized anti-mAb1 antibody on an affinity column, mobile phase A was 20 mM Tris, pH 7.5 (or pH 7.4) and mobile phase B was 500 mM arginine, 50 mM Tris, pH 7.3. Mobile phase C was 100 mM acetic acid, pH 2.7. An injection volume of up to 950 μL was used, and the flow rate was 0.2 mL/min during loading, 0.5 mL/min during arginine wash and elution, and 0.8 mL/min during wash after elution. A stepped gradient with 100% mobile phase C was applied at 40.01 min for 13 min. The run time was 70 min. Eluted fraction was collected between 45.7 and 51.0 min in two vials. Collection vials contained 50 µL of 1 M Tris, pH 8.0, before collection. Approximately 2.5 mL was collected in two vials. Fractions were pooled before spinning in a Vivaspin 6 centrifugal concentrator (Sigma Aldrich) with a molecular weight cutoff of 30 K for 20 min at 3,500 × g. One milliliter of 20 mM phosphate, pH 6.5, was added, and the fractions were spun for 20 min at 3,500 × g. This step was then repeated once more for buffer exchange. The final sample volume of approximately 50 µL was then brought to a volume of approximately 100 μL with 20 mM phosphate, pH 6.5, for loading on a WCX column.
Weak cation exchange chromatography
For WCX, mobile phase A was 20 mM phosphate, pH 6.5, and mobile phase B was 20 mM phosphate, 100 mM sodium chloride, pH 6.5. An injection volume of up to approximately 100 μL and a flow rate of 1 mL/min were used during the run. A linear gradient was applied between 15% mobile phase B at 5 min and 100% mobile phase B at 15 min. The eluted fraction was collected between 9.0 and 12.5 min. The run time was 27 min. A volume of approximately 3.5 mL was collected in two vials for each injection. Two fractions were pooled before spinning in a Vivaspin 6 with a molecular weight cutoff of 30 K for 20 min at 3,500 × g. One milliliter of 50 mM Tris, pH 7.5, was added, and the fractions were spun for an additional 30 min at 3,500 × g. The final sample volume was less than 30 µL. After careful transfer of the samples to 1.5-mL centrifuge tubes, the sample concentration was checked with a Nanodrop spectrometer.
Glycan extraction, labeling, and solid-phase extraction clean-up for HILIC-UPLC
Three microliters of PNGase F was added to approximately 30 µL of sample and incubated at 37℃ for 16 ± 2 h. The cleaved oligosaccharides were labeled by incubating with a cocktail of 2-AB plus 2-picoline borane complex at 37℃ for 30 min. The 2-AB–labeled glycan sample was purified with a GlycoClean S-plus solid-phase extraction cartridge and then eluted with 150 μL of water into 1.5-mL Eppendorf tubes. The eluates were then dried in a SpeedVac vacuum concentrator at 40℃ for 2 h. Dried samples were reconstituted with 10 µL of water, 22.5 µL of acetonitrile was added, samples were transferred to total recovery vials (Waters), and 10 µL was injected into an Acquity UPLC glycoprotein BEH glycoprotein column (300 Å, 1.7 µm, 2.1 × 150 mm; Waters). Peaks were monitored by fluorescence detection (excitation at 330 nm and emission at 420 nm). Glycan profiling assay showed precision of 3.3% CV for major glycans (G0f, G1f, and G2f) and 9.3% for minor glycans, including gal-α-gal and NGNA. Peaks above the limit of quantitation (0.1%) were included in the total peak area. The gal-α-gal and NGNA contents were determined by summing up the peak area percentage of all glycans containing gal-α-gal or NGNA, respectively. Two glycans, G2f+G(b) and G1f+NGc(a), co-eluted in one peak, and the corresponding peak area percentage were included to calculate the percentages of both gal-α-gal and NGNA.
Abbreviations
| 2-AB | = | 2-Aminobenzamide |
| ADA | = | Antidrug antibody |
| BEH | = | Ethylene bridged hybrid |
| CV | = | Coefficient of variation |
| Fab | = | Antigen-binding fragment |
| Fc | = | Crystallizable fragment |
| gal-α-gal | = | Galactose-alpha-1,3-galactose |
| HPLC | = | High-performance liquid chromatography |
| IgG | = | Immunoglobulin G |
| M5 | = | Mannose 5 |
| mAb | = | Monoclonal antibody |
| NGNA | = | N-glycolylneuraminic acid |
| NHS | = | N-hydroxy-succinimide |
| PBS | = | Phosphate-buffered saline |
| PK | = | Pharmacokinetics |
| UPLC | = | Ultra-performance liquid chromatography |
| WCX | = | Weak cation exchange chromatography |
Disclosure of potential conflicts of interest
All authors are or were employees of AstraZeneca at the time that this research was performed, with stock ownership and/or stock options or interests in the company.
Acknowledgments
We thank Xiangyang Wang for support of this study, Kasia Kozakowska for critical review of the manuscript, and Gengcheng Yang for early technical support. Editorial support was provided by Deborah Shuman.
Additional information
Funding
References
- Reusch D, Tejada ML. Fc glycans of therapeutic antibodies as critical quality attributes. Glycobiology. 2015;25:1325–11. doi:https://doi.org/10.1093/glycob/cwv065.
- Goetze AM, Liu YD, Zhang Z, Shah B, Lee E, Bondarenko PV, Flynn GC. High-mannose glycans on the Fc region of therapeutic IgG antibodies increase serum clearance in humans. Glycobiology. 2011;21:949–59. doi:https://doi.org/10.1093/glycob/cwr027.
- Chen X, Liu YD, Flynn GC. The effect of Fc glycan forms on human IgG2 antibody clearance in humans. Glycobiology. 2009;19:240–49. doi:https://doi.org/10.1093/glycob/cwn120.
- Keck R, Nayak N, Lerner L, Raju S, Ma S, Schreitmueller T, Chamow S, Moorhouse K, Kotts C, Jones A. Characterization of a complex glycoprotein whose variable metabolic clearance in humans is dependent on terminal N-acetylglucosamine content. Biologicals. 2008;36:49–60. doi:https://doi.org/10.1016/j.biologicals.2007.05.004.
- Wang YM, Wang J, Hon YY, Zhou L, Fang L, Ahn HY. Evaluating and reporting the immunogenicity impacts for biological products: a clinical pharmacology perspective. AAPS J. 2016;18:395–403. doi:https://doi.org/10.1208/s12248-015-9857-y.
- Millward TA, Heitzmann M, Bill K, Langle U, Schumacher P, Forrer K. Effect of constant and variable domain glycosylation on pharmacokinetics of therapeutic antibodies in mice. Biologicals. 2008;36:41–47. doi:https://doi.org/10.1016/j.biologicals.2007.05.003.
- Alessandri L, Ouellette D, Acquah A, Rieser M, Leblond D, Saltarelli M, Radziejewski C, Fujimori T, Correia I. Increased serum clearance of oligomannose species present on a human IgG1 molecule. mAbs. 2012;4:509–20. doi:https://doi.org/10.4161/mabs.20450.
- Kanda Y, Yamada T, Mori K, Okazaki A, Inoue M, Kitajima-Miyama K, Kuni-Kamochi R, Nakano R, Yano K, Kakita S, et al. Comparison of biological activity among nonfucosylated therapeutic IgG1 antibodies with three different N-linked Fc oligosaccharides: the high-mannose, hybrid, and complex types. Glycobiology. 2007;17:104–18. doi:https://doi.org/10.1093/glycob/cwl057.
- Wright A, Morrison SL. Effect of altered CH2 associated carbohydrate structure on the functional properties and in vivo fate of chimeric mouse-human IgG1. J Exp Med. 1994;180:1087–96. doi:https://doi.org/10.1084/jem.180.3.1087.
- Newkirk MM, Novick J, Stevenson MM, Fournier MJ, Apostolakos P. Differential clearance of glycoforms of IgG in normal and autoimuune-prone mice. Clin Exp Immunol. 1996;106:259–64. doi:https://doi.org/10.1046/j.1365-2249.1996.d01-847.x.
- Vidarsson G, Dekkers G, Rispens T. IgG subclasses and allotypes: from structure to effector functions. Front Immunol. 2014;5:520. doi:https://doi.org/10.3389/fimmu.2014.00520.
- Huang L, Biolsi S, Bales KR, Kuchibhotla U. Impact of variable domain glycosylation on antibody clearance: an LC/MS characterization. Anal Biochem. 2006;349:197–207. doi:https://doi.org/10.1016/j.ab.2005.11.012.
- Lagasse HA, Alexaki A, Simhadri VL, Katagiri NH, Jankowski W, Sauna ZE, Kimchi-Sarfaty C. Recent advances in (therapeutic protein) drug development. F1000Res. 2017;6:113. doi:https://doi.org/10.12688/f1000research.9970.1.
- Kaplon H, Reichert JM. Antibodies to watch in 2018. mAbs. 2018;10:183–203. doi:https://doi.org/10.1080/19420862.2018.1415671.
- Liu L. Antibody glycosylation and its impact on the pharmacokinetics and pharmacodynamics of monoclonal antibodies and Fc-fusion proteins. J Pharm Sci. 2015;104:1866–84. doi:https://doi.org/10.1002/jps.24444.
- Ghaderi D, Taylor RE, Padler-Karavani V, Diaz S, Varki A. Implications of the presence of N-glycolylneuraminic acid in recombinant therapeutic glycoproteins. Nat Biotechnol. 2010;28:863–67. doi:https://doi.org/10.1038/nbt.1651.
- Chung CH, Mirakhur B, Chan E, Le Q-T, Berlin J, Morse M, Murphy BA, Satinover SM, Hosen J, Mauro D, et al. Cetuximab-induced anaphylaxis and IgE specific for galactose-α-1,3-galactose. N Engl J Med. 2008;358:1109–17. doi:https://doi.org/10.1056/NEJMoa074943.
- Bosques CJ, Collins BE, Meador JW 3rd, Sarvaiya H, Murphy JL, Dellorusso G, Bulik DA, Hsu IH, Washburn N, Sipsey SF, et al. Chinese hamster ovary cells can produce galactose-alpha-1,3-galactose antigens on proteins. Nat Biotechnol. 2010;28:1153–56. doi:https://doi.org/10.1038/nbt1110-1153.
- Higel F, Seidl A, Sorgel F, Friess W. N-Glycosylation heterogeneity and the influence on structure, function and pharmacokinetics of monoclonal antibodies and Fc fusion proteins. Eur J Pharm Biopharm. 2016;100:94–100. doi:https://doi.org/10.1016/j.ejpb.2016.01.005.
- Lammerts van Bueren JJ, Rispens T, Verploegen S, van der Palen-merkus T, Stapel S, Workman LJ, James H, van Berkel PH, van de Winkel JG, Platts-Mills TA, et al. Anti-galactose-alpha-1,3-galactose IgE from allergic patients does not bind alpha-galactosylated glycans on intact therapeutic antibody Fc domains. Nat Biotechnol. 2011;29:574–76. doi:https://doi.org/10.1038/nbt.1912.
- Steinke JW, Platts-Mills TA, Commins SP. The alpha-gal story: lessons learned from connecting the dots. J Allergy Clin Immunol. 2015;135:589–596;quiz 597. doi:https://doi.org/10.1016/j.jaci.2014.12.1947.
- Kuriakose A, Chirmule N, Nair P. Immunogenicity of biotherapeutics: causes and association with posttranslational modifications. J Immunol Res. 2016;2016:1298473. doi:https://doi.org/10.1155/2016/1298473.
- Galili U. Immune response, accommodation, and tolerance to transplantation carbohydrate antigens. Transplantation. 2004;78:1093–98. doi:https://doi.org/10.1097/01.TP.0000142673.32394.95.
- Wang W, Wang EQ, Balthasar JP. Monoclonal antibody pharmacokinetics and pharmacodynamics. Clin Pharmacol Ther. 2008;84:548–58. doi:https://doi.org/10.1038/clpt.2008.170.
- Carrascosa JM. Immunogenicity in biologic therapy: implications for dermatology. Actas Dermosifiliogr. 2013;104:471–79. doi:https://doi.org/10.1016/j.ad.2013.02.005.
- Sailstad JM, Amaravadi L, Clements-Egan A, Gorovits B, Myler HA, Pillutla RC, Pursuhothama S, Putman M, Rose MK, Sonehara K, et al. A white paper: consensus and recommendations of a global harmonization team on assessing the impact of immunogenicity on pharmacokinetic measurements. AAPS J. 2014;16:488–98. doi:https://doi.org/10.1208/s12248-014-9582-y.
- Galili U. Anti-Gal: an abundant human natural antibody of multiple pathogeneses and clinical benefits. Immunology. 2013;140:1–11. doi:https://doi.org/10.1111/imm.12110.
- Rispens T, Derksen NI, Commins SP, Platts-Mills TA, Aalberse RC. IgE production to alpha-gal is accompanied by elevated levels of specific IgG1 antibodies and low amounts of IgE to blood group B. PLoS One. 2013;8:e55566. doi:https://doi.org/10.1371/journal.pone.0055566.
- Shankar G, Arkin S, Cocea L, Devanarayan V, Kirshner S, Kromminga A, Quarmby V, Richards S, Schneider CK, Subramanyam M, et al. Assessment and reporting of the clinical immunogenicity of therapeutic proteins and peptides-harmonized terminology and tactical recommendations. AAPS J. 2014;16:658–73. doi:https://doi.org/10.1208/s12248-014-9599-2.
- Smith A, Manoli H, Jaw S, Frutoz K, Epstein AL, Khawli LA, Theil FP. Unraveling the effect of immunogenicity on the PK/PD, efficacy, and safety of therapeutic proteins. J Immunol Res. 2016;2016:2342187. doi:https://doi.org/10.1155/2016/2342187.