
ABSTRACT
Therapeutic proteins including antibodies and Fc-fusion proteins undergo a large number of chemical modifications during cell culture, purification, storage and in human circulation. They are also exposed to harsh conditions during stress studies, including elevated temperature, extremes of pH, forced oxidation, physiological pH, UV light to assess the possible degradation pathways and suitability of methods for detecting them. Some of these modifications are located on residues in binding regions, leading to loss of binding and potency and classified as critical quality attributes. Currently, criticality of modifications is assessed by a laborious process of collecting antibody fractions from the soft chromatography techniques ion exchange and hydrophobic interaction chromatography and characterizing the fractions one-by-one for potency and chemical modifications. Here, we describe a method for large-scale, parallel identification of all critical chemical modifications in one experiment. In the first step, the antibody is stressed by one or several stress methods. It is then mixed with target protein and separated by size-exclusion chromatography (SEC) on bound antibody-target complex and unbound antibody. Peptide mapping of fractions and statistical analysis are performed to identify modifications on amino acid residues that affect binding. To identify the modifications leading to slight decreases in binding, competitive SEC of antibody and antigen mixtures was developed and described in a companion study by Shi et al, where target protein is provided at lower level, below the stoichiometry. The newly described method was successfully correlated to crystallography for assessing criticality of chemical modifications and paratope mapping. It is more sensitive to low-level modifications, better streamlined and platform ready.
Introduction
Antibodies, Fc-fusion proteins and other proteins with antibody domains constitute the majority of modern therapeutic recombinant proteins.Citation1 Following protein biosynthesis, they can undergo a large number of covalent modifications, including post-translational modifications (PTMs) and chemical modifications, which can change their structure and function. PTMs refer to enzymatic modifications of proteins typically taking place during cell culture, such as glycosylation, hydroxylation, disulfide formation, formylation, and enzymatically induced fragmentation. Chemical modifications often designate non-enzymatic modifications, degradations taking place during the entire process, including cell culture, purification, formulation, and storage. They comprise deamidation, oxidation, isomerization, glycation, acid-induced hydrolysis, and other modifications, many of which are still unknown and identified only by mass. PTMs, chemical modifications, and also mutations and misincorporations are often called covalent or chemical modifications to distinguish them from physical modifications, such as aggregation, fragmentation, phase change.
A critical quality attribute (CQA) of a therapeutic protein is a physical, chemical, biological, or microbiological property that should be within an appropriate range to ensure the desired product efficacy (potency and in-vivo half-life) and safety (immunogenicity and adverse effects).Citation2 The method described here is focused on assessing criticality of attributes (chemical modifications) for binding to the therapeutic target protein and potency). Multiple chemical modifications can be associated with residues in binding regions of the antibody. Only some of them, however, cause loss of binding to therapeutic target and efficacy and classified as CQAs. In addition to the standard conditions of manufacturing and storage, therapeutic proteins are exposed to atypical, harsh conditions (including elevated temperature, extremes of pH, forced oxidation, physiological pH, UV light) during accelerated stress studies designed to elucidate forced degradation pathways and the suitability of methods for detecting the degradations, if they occur. It is an analytical challenge to identify and distinguish critical and non-critical modifications, and the method described here was designed to address the challenge.
Criticality of antibody modifications with respect to binding to target is currently assessed by a laborious process of fractionating and characterizing antibody variants one-by-one. For that, therapeutic antibodies are separated on fractions by soft separation techniques, such as ion exchange chromatography (IEX),Citation3–9 hydrophobic interaction chromatography (HIC),Citation10–12 size exclusion chromatography (SEC),Citation10 and field-flow fractionation,Citation13 with the goal of having one attribute per fraction. The fractions are collected and subjected to biochemical characterization (including peptide mapping), and to binding and cell-based assays with the objective of identifying the site and nature of modification, and its impact on efficacy. The clean fractionation of antibody species (variants and impurities) with only one modification per chromatographic peak, however, is often not possible.Citation14 It is also challenging to confidently identify modifications and establish their criticality in minor chromatographic peaks due to insufficient amount of material for the assays and the presence of abundant artificial modifications induced by handling of low-concentration fractions.Citation14
Paratope and epitope mapping approaches
The identification of residues on the antibody (paratope) that establish the productive contacts with the target protein (epitope) is critical for antibody drug development. In particular, paratope and paratope mapping is important to understand antibody-target binding, elucidate the interaction’s stoichiometry, mechanism of drug action and also to guide future antibody engineering efforts. Several techniques have been traditionally used for paratope and epitope mapping,Citation15–17 including X-ray crystallography,Citation18 nuclear magnetic resonance (NMR),Citation19 alanine-scanning mutagenesis,Citation20–22 and mass spectrometry (MS)-based techniques such as hydrogen deuterium exchange (HDX),Citation23–26 oxidative labeling by hydroxyl radicals by applying synchrotron X-ray radiolysis,Citation27–29 and fast photochemical oxidation of proteins (FPOP) using fast lasers.Citation30–34 A more detailed review of the paratope and epitope mapping techniques can be found in the Supplemental Information section.
SEC of antibody-target complexes
A typical therapeutic antibody–target interaction displays relatively high affinity (~ Kd = 10−10 M). Such antibody associates with its target within a minute at ~1 mg/ml and remains bound after dilution for many hours, which is sufficient to elute from a SEC column together as an antibody-target complex after an hour-long SEC separation. In the past, SEC has been applied to study antibody-target complexes and stoichiometry of their interactions.Citation35–40 In cases where binding is weaker than Kd = 10−8 M, the antibody and target protein undergoes dissociation and thus elute from SEC as separate species (separate peaks), as has been shown for several weak antibody interactions.Citation13 As a result of antibody stress, some chemical modifications may lead to weaker binding, dissociation of antibody-target complexes and their separate elution from the column. For example, SEC of mixture of the stressed anti-epidermal growth factor receptor (EGFR) antibody panitumumab and soluble EGFR followed by high performance liquid chromatography (HPLC)-MS characterization of intact and reduced bound and unbound antibody species confirmed that iso-aspartate formation in Asp92 of light chain resulted in loss of binding and dissociation of the complex on the SEC column.Citation37 Here we describe a shotgun method for large-scale, parallel, automated criticality assessment of all chemical modifications in one experiment using peptide mapping. The method is also suitable for paratope mapping and potentially for epitope mapping of antibody-target binding sites.
Results
SEC separation of antibody-target complexes
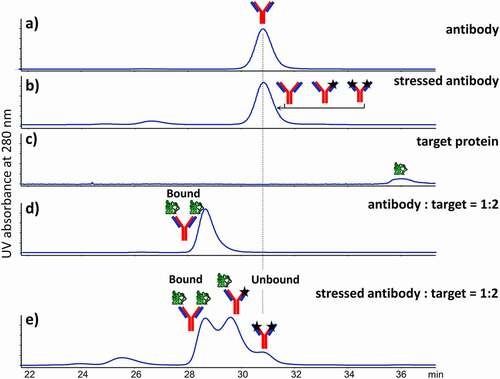
During SEC separation, the antibody and stressed antibody eluted at approximately 31 minutes (, S1 and 2a). Several stress conditions were evaluated, as described in the Materials and Methods section. Exposure to UV and cool white light was selected as antibody stress condition for this study because these conditions produced a large number of modifications, and bound and unbound antibody fractions were similar in peak areas (protein amount) (). The stressed antibody eluted at the same time as the non-stressed antibody because the chemical modifications did not change the size of the antibody molecules (). A small percentage of aggregates eluted at 26 minutes (). Injected alone, target protein of much smaller size eluted later, at 36 minutes (). When the antibody was mixed with target at 1:2 molar ratio, a complex eluted at 28–29 min containing one antibody and two target molecules (). The size and stoichiometry were deduced from SEC analysis of a mixture of molecular weight calibrants and SEC separations of other antibody-target complexes using SEC with multi-angle light scattering detector.Citation41 The target protein used in this study is a soluble, extracellular region of a receptor, described in the literature as a monomer, further indicating that 1:2 antibody:target is the logical stoichiometry. When stressed antibody was mixed with the target, three peaks appeared (). The pattern indicated that the stress-induced modifications, which prevented antibody molecules from creating strong binding to the target. The SEC peaks were interpreted as having the following composition. The earliest eluting SEC peak (28–29 minutes) contained two target molecules bound to antibody, the later eluting SEC peak (29–30.5 minutes) contained antibody with one unbinding arm, disabled by a modification (). The latest peak (30.5–31.5 minutes) was assigned as completely unbound antibody because its elution time was the same as for the injected along with antibody (). Due to the relatively small size and mass of the target (~17 kDa) as compared to the antibody (~147 kDa), addition of receptor led to relatively small shift in elution time, and the SEC peaks partially co-eluted. The amount of material in the SEC fraction with completely unbound antibody was much lower than the bound antibody, which is not preferred for accurate comparison of chemical modifications. In the label-free quantitation of chemical modifications by HPLC-MS used in this study, samples were required to have similar protein concentrations in each collected fraction to avoid differences in artificial modifications, caused by the sample preparation steps of SEC fraction collection, guanidine unfolding, reduction, and alkylation of disulfide bonds, tryptic digestion, quench and HPLC-MS/MS analysis. Therefore, the bound (28–29 minutes) and partially unbound (29–30.5 minutes) antibody fractions were collected for peptide mapping. In the following text, partially unbound antibody will be called unbound to shorten and simplify the narrative.
Figure 1. Workflow for the method of SEC fractionation of stressed antibody-target complexes and HPLC-MS/MS peptide mapping of bound and unbound antibodies to identify the critical modifications that affect binding and map paratope. Antibody was stressed by one or several stress conditions to cause chemical modifications. (a) The stressed antibody was mixed with its target protein, and the mixture was separated by size-exclusion chromatography (SEC) on earlier eluting antibody-target complex and later eluting unbound antibody. (b) The bound and unbound fractions were collected and subjected to enzymatic digestion followed by (c) HPLC-MS/MS peptide mapping to identify and quantify chemical modification of the antibody in each fraction. Statistical analysis was performed and presented as (d) relative abundance plot and as (e) volcano plot, where every dot is defined by the fold change (FC) of a chemical modification level in unbound versus bond fraction as X-axis and confidence as Y-axis. Modifications on amino acid residues impacting binding the most appeared in the top right corner of the volcano plot, and (f) were mapped on the antibody sequence to generate a paratope map. (g) Correlation to crystallography of the antibody-target complex revealed that 8 out of the 11 critical antibody residues were within 5Å from the target, indicating high probability of the interactions and validity of the method
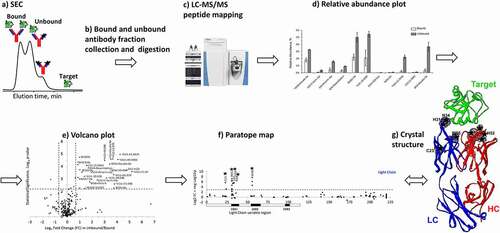
Figure 2. Size-exclusion chromatography with UV detection (at 280 nm) profiles of (a) antibody, (b) stressed antibody, (c) target protein, (d) antibody-target mixture and (e) stressed antibody – target mixture
Peptide mapping and relative abundance plot
LC-MS/MS analysis of tryptic digests was performed to identify and quantify 270 chemical modifications of amino acids residues in the bound and unbound therapeutic proteins with the goal to identify the critical modifications responsible for the loss of binding (, and Figure S1). As will be shown later, a majority of modifications, taking place during the stress, do not affect binding and are equally present in bound and unbound fractions. Also, the artificial modifications occurring after the stress and during sample preparation should and do have similar levels for the method to work. The fractionation, sample preparation, and analysis were repeated several times (n = 3 in this study) to calculate standard deviation and also perform t-test and calculate p-values as a measure of statistical significance for every modification (). Relative abundances with error bars for 11 modifications (out of 270 total modifications) in bound and unbound antibody fractions are shown on the relative abundance plot as an example (). The error bars equal to ± 2 standard deviations were selected to represent the 95% confidence interval and p-value using the following rationale. Both standard deviation and p-value are associated with the standard normal distribution, and the 95% confidence level corresponds to −2 and +2 standard deviations. These 11 modifications have high unbound/bound FC and statistical significance, which can be relatively easily visualized on the plot (). However, it is difficult to visualize and distinguish statistically significant differences (FC) using the relative abundance plot for the entire set of 270 modifications (data not shown).
Table 1. Results of peptide mapping of several samples of IgG1 antibody used in this study, including reference material (RM), after stress at 40°C for 4 weeks in the mildly acidic formulation (40 C4W), after UV light exposure described in Materials section, bound to target, unbound. The experiments were repeated three times including UV stressed antibody – target binding, fractions collection, digestions and HPLC-MS/MS analysis. Percentages of chemical modifications were averaged after the three measurements. Twenty-seven (27) chemical modifications satisfied criteria of statistical significance of fold change > 1.8 (Log2 FC > 0.83) and p < .006 (-Log10(p)>2.2). These 27 modifications occurred on 11 amino acid (AA) residues, which constituted paratope. Out of the 11 residues, 8 were within 5 Å from the target according to the crystallography data. On 6 residues, the modifications exceeded 0.3% after 4C4W, and only two modifications N34 deamidation and S32/S33 fragmentation exceeded 4%, indicating good stability in the liquid formulation
Figure 3. Relative abundance plot of 11 chemical modifications from bound and unbound antibody fractions with high unbound/bound FC and statistical significance. The error bars equal to ± 2 standard deviations are used to represent the 95% confidence interval
Volcano plot
Volcano plot, which is a type of two-dimensional scatter plot, is a better statistical tool to identify statistically significant changes in large data sets composed of replicate data. The volcano plot shows statistical significance (defined as – log10 of p-value) and FC (defined as log2 of FC) on the y and x axes, respectively (, bottom and ). FC, or ratio was calculated as abundance ratio of relative chemical modifications in unbound versus bound antibody fractions. Minus log10 of p-value is typically used to make statistical significance a positive value and comparable with FC. Log2 of FC is typically used to make negative (left) and positive (right) parts of the axis symmetrical. Every dot represents a modification on a residue. Abundances of critical modifications affecting binding the most should be statistically significantly higher in unbound protein fractions, while noncritical modifications and artificial modifications should be similar and have FC close to 1 (Log2 of FC close to 0). Statistically significant data including 27 modifications were grouped in the top right corner of the volcano plot () bordered by the dashed lines with p-value < 0.006 (-log10 p-value > 2.2) and FC > 1.8 (Log2 FC > 0.83). Figure S2 and related text in the Supplemental Information section describe the thresholds selection for the volcano plot in greater detail. and Figure S3 contain information about 27 modifications (out of 270 total modifications) with the highest ratio of modifications in unbound and bound antibody fractions and statistical significance. These modifications occurred on 11 residues identified as the paratope of the antibody, which was visualized as described below.
Figure 4. A volcano plot for FC of chemical modifications in unbound versus bound antibody (as X-axis) and statistical significance of the measurements (as Y-axis). Twenty-seven modifications on amino acid residues that affect binding the most appeared in the top right corner of the volcano plot bordered by FC > 1.8 and p-value < 0.006
Quality control by using volcano plots for individual chemical modifications
How do we know that the uncovered modifications were caused during the antibody stress before binding to target and not artificially introduced after elution from SEC column and following sample preparation? What if one of the fractions was treated differently during sample preparation, due to, for example, lower protein concentration in the fraction? This could result in higher oxidation, due to greater impurities-to-protein ratio and other artifacts due to, for example, greater nonspecific tryptic cleavages during peptide mapping. Review of individual types of modifications was performed for quality control using the following rationale (). If SEC unbound and bound antibody fractions were collected and processed similarly, noise will be symmetrical and near the base of the volcano and around the vertical axis Log2(FC) = 0. The noise is grayed on the plot for all modifications (). For example, several isomerization and H2O loss (succinimide) modifications occurred in the study and most of them were at the base of the volcano (). They have FC = 1 (log2 FC = 0), indicating that they were equal in both fractions. These modifications either occurred before mixing/binding and they did not affect binding, or they occurred equally during sample preparation. Heavy chain D33 H2O loss, however, was clearly different from the other modifications of this type. Volcano patterns of other types of modifications look similar, including deamidation; + 13.97 Da = double oxidation and H2O loss on H, Y, W; clips; digestion artifacts; unknown modifications; oxidation. Detailed descriptions of the modifications, including unknown modifications, can be found in Supplemental Information of Zhang et al.Citation42 Notably, the majority of dots for Double, Triple Oxidation, and Kynurenine Ox were slightly shifted to the right, suggesting that the unbound fraction was exposed more to unintentional oxidation by radicals and metals impurities after fraction collection. For even stricter quality control, it may be useful to incorporate spiking of an internal standard protein into the collected SEC fractions to ensure that sample preparation was performed similarly for the two fractions.
Figure 5. Volcano plots for individual chemical modifications as a quality control measure including the following modifications: (a) all modifications, (b) isomerization and H2O loss due to succinimide formation, (c) deamidation, (d) + 13.97 Da = double oxidation and H2O loss on H, Y, W, (e) clips, (f) digestion artifacts, (g) unknown modifications, (h) oxidation, (i) double, triple oxidation, kynurenine formation
Adding the bound SEC fraction of non-stress antibody sample was thought as another control (additional to the stressed bound) to confirm the non-critical modifications of stressed bound sample. The statistical analysis (volcano plots) of the collected bound and unbound SEC fractions relative to the reference material (RM) and stressed sample can be useful in identifying artificial modifications caused by SEC fractionation and digestion. These additional quality control steps should further improve the method and support identified critical modifications in the future studies.
Paratope mapping
The modifications on residues with the highest FC and greatest statistical significance from the top right corner of the volcano plot were mapped on the sequences of antibody heavy chain (HC) and light chain (LC) to create a paratope map. The paratope map was plotted as a modification score versus residue number (). The modification score was chosen as a sum of logarithms for fold change and p-value (Log2 FC + -log10 p-value) because both were important for separating signal from noise, scales have similar values, and the sum represents the modifications in the top right corner. Of the 11 residues with the highest score, 10 were located at complementarity-determining regions (CDRs), which are typically involved in binding (). The only critical modification detected outside of CDRs was on a cysteine residue (C23) in frame region 1, suggesting that long-range (allosteric) effects may play a role caused by the reduced disulfide bond and modified cysteine. Residues in the conserved regions, typically not involved in binding, had significantly lower scores, constituting noise.
Figure 6. Paratope mapping plots for (a) heavy chain and (b) light chain of the antibody binding to target protein. Y-axis is a sum of logarithms for FC and p-value (Log2 FC + -log10 p-value). X-axis shows residue numbers. Variable regions are highlighted by bars under X-axis. Complementarity-determining regions (CDRs) are the black sections of the bars
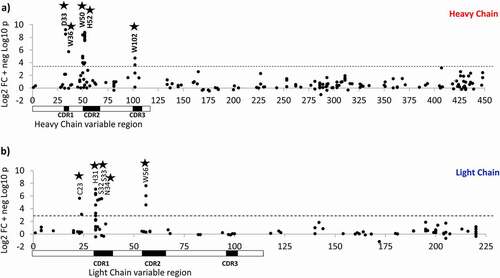
The following 59 residues belong to CDRs, including HC residues 31–35, 50–66, 99–107, and LC residues 31–40, 55–66, 97–102. Chemical modifications were detected on 28 of them. Only 10 of the modified residues were found to affect binding with statistical significance. Other eighteen had low FC (Figure S4), or statistical significance or both (Figure S5).
In alignment with crystallography observations
These data seem to correlate well with the crystal structure (data not shown), where the antibody-target complex revealed that 8 of the 11 critical antibody residues were within 5A within of residues in the epitope ( and ), indicating that these antibody residues are close and likely to interact with the target. These results supported the validity of the method.
Discussions
In this study, 270 chemical modifications were identified and quantified by peptide mapping of bound and unbound fractions of stressed antibody (Figure S3A). After statistical analysis including the volcano plot, 27 modifications on 11 residues were categorized as affecting binding to the target with statistical significance (Figure S3 B and C). The results indicate that the 11 residues were involved in binding and constitute paratope residues. Chemical modifications of their side chains, or possibly spatial shift of the impacted residues (and adjacent protein backbone) in case of isoaspartate formation, resulted in loss of binding as measured by SEC. Modification of LC cysteine residue C23 (located outside of CDR), associated with reduction of a disulfide bond, suggests that this modification decreased binding through a long-range (allosteric) effect. The reduction of the disulfide bond probably led to a spatial shift or weakened the structure, facilitating a modification on a CDR residue. This is in agreement with previous studies indicating that reduced disulfide bonds lead to weakened antibody stability.Citation43 Clipping between S32 and S33 in LC CDR1 was identified as impacting binding. Although these residues are located in a CDR and may be directly involved in binding, it is also possible that loss of binding resulted from cleavage of the protein backbone at S32/S33, leading to significant shifts in resulting CDR fragments. Among the 11 residues affecting binding to the target, only 6 residues had modifications that exceeded 0.3% in pH 5 liquid formulation after 40°C stress for 4 weeks (40°C 4W), which is a useful approximation for 2-year storage at 4°–8°C temperature ( and Figure S3 D). Only two modifications, N34 deamidation and S32/S33 clip, exceeded 4% after 40°C4W, indicating good stability in the liquid formulation.
As previous results indicated,Citation13 antibody-antigen complexes are preserved in SEC if binding is stronger than affinity coefficient 10−8M Kd. During assessment of several different antibody-target combinations by the described method, we found that some modifications, however, resulted in only a slight decrease of binding, which would keep antibody-target as a complex eluting together from SEC, despite the modifications. To identify those modifications, competitive SEC of antibody and antigen mixtures were developed and described in a companion study by Shi et al.,Citation41 where target protein is provided at a lower level, below the stoichiometry.
Comparison to other mapping techniques
The method described here uses stable chemical modifications on amino acid side chains for mapping protein–protein interactions, similar to oxidative labeling by hydroxyl radicals, but it does not require high-energy synchrotron radiation, as in X-ray radiolysis,Citation27–29 or lasers, as in Fast Photochemical Oxidation of Proteins (FPOP).Citation30–34 Additionally, modifications in our method are introduced before binding to target, not after binding, as in synchrotron radiolysis or FPOP.
The paratope mapping technique described here is somewhat similar to alanine-scanning mutagenesis,Citation20–22 but with the following key differences. Instead of mutations, side chains of amino acid residues are altered by chemical modifications, which is a simpler process. Also, instead of one-by-one binding to target measurements, the described method allows parallel, large-scale paratope and potentially epitope mapping. Although alanine-scanning mutagenesis can potentially provide epitope/paratope information at the amino acid level, it is a rather lengthy and laborious process, and it suffers from the uncertainty of not knowing whether the mutation genuinely affected a key interacting residue or just disrupted the folding of the mutated protein.Citation15 And yet, scanning mutagenesis remains the most reliable and preferred method for paratope and epitope mapping. Our technique encounters similar uncertainty because the side chains are modified before binding. As our studies of several antibody-target molecules indicate, the method provides useful information, and long-range, allosteric modifications were not common during paratope mapping. This is probably because antibody binding sites (paratope) are typically located in CDRs, which are unfolded, unstructured, flexible loops. Modifications also preferentially take place on unfolded, unstructured, flexible loops (which are mainly CDRs). Therefore, modifications should not affect folding, and cause long-range impacts, but rather differentiate critical and non-critical modifications in CDRs.
Although this article reports use of chemical modifications on a large number of residues after antibody stress, shotgun amino acid substitutions at low level on a large number of residues can provide a similar opportunity for paratope mapping using the described method. The substitutions can be created, for example, by using mutant libraries generated by error-prone PCR mutagenesis,Citation44 or misincorporations by starvation for several amino acids during cell culture.Citation42
Epitope mapping
The disclosed method can be potentially used for epitope mapping on the surface of target proteins. For that, the target protein should be stressed instead of the antibody under the same or similar stress conditions. The rest of the experimental flow should be the same, except that SEC fractions of bound target (antibody-target complex) and unbound target should be collected and compared. Our initial experiments indicated that stress of target indeed decreases antibody-target complex formation as measured by SEC, but the experiment is more challenging. Target proteins (ligands and extracellular soluble parts of receptors) are typically less stable than antibodies, and their formulation solutions are not as optimized (they are often just simply phosphate-buffered saline solutions), resulting in target protein unfolding and precipitation under stress.
Role of the method in current and future development of therapeutic antibodies
The method is applicable in all phases of process development from developability assessment to marketing application. The approach is especially relevant in situations when other structural data (crystallography or NMR), analytical methods (including ion exchange and hydrophobicity interaction chromatography), potency assay and conventional binding assay (e.g., surface plasmon resonance, ELISA-based), are not available. For example, during early developability assessment an antibody candidate with promising therapeutic, animal toxicology, viscosity, cell culture titer parameters may be wrongfully deselected because of a high level of a modification in a CDR region. The method described here can be deployed to quickly assess the impact of high-level, and all other modifications, as long as the soluble target protein is available. The method can also be useful during the final steps of development for elucidation of structure – function relationships and forced degradation pathways.
Multi-attribute method (MAM) has been recently designed and developed for targeted quantitation of quality attributes (critical chemical modifications) by HPLC-MS in regulatory environment including Current Good Manufacturing Practice (cGMP) laboratories (quality control).Citation45,Citation46 Although the conventional methods including IEX, HIC, capillary electrophoresis (CE), reversed phase HPLC, normal phase HPLC, hydrophilic interaction chromatography, are currently still essential for early development and characterization, they offer limited information on specific product-related variants and impurities. They have served as surrogate measures, often capable of only detecting global rather than site-specific chemical modification at the amino acid level.Citation46 Replacement of conventional methods with MAM, along with incorporation of process control levers, could enable efficient and informative product attribute control for protein therapeutics.Citation46 Traditional gel electrophoresis (SDS-PAGE), for example, had been the most popular analytical method for therapeutic proteins for decades, but was replaced by other techniques in modern industrial analytical and quality control laboratories. The continuing demand for faster pace and lower cost of protein drug development will logically lead to removal of the conventional methods and their replacement with MAM to eliminate duplication and provide enhanced information content. If the future industrial analytical labs will not have HPLC and CE systems, columns, buffers for the conventional methods, there will be no infrastructure to collect and characterize the fractions with different variants and impurities. The method described here will fit well into that future, because it does not require the conventional methods for assessment of criticality of chemical modifications, just SEC, stressed antibody, soluble target proteins and peptide mapping by HPLC-MS/MS.
Our newly described method has been used for identification of critical chemical modifications and correlated well to crystallography in this study (), to crystallography and traditional methods in the companion trastuzumab – HER2 articleCitation41 and several unpublished studies for different antibody-target pairs. In general, solubility and sufficiently high molecule weight of the target protein (to cause an SEC shift) are prerequisites for the method to work. Practically, solubility of target proteins was typically reached, with only a few exceptions when it was eluting from SEC as an aggregate. If needed, a larger size of target protein could be also achieved by conjugation to an antibody Fc region, which is often used to facilitate purification of proteins. Our method is more sensitive to low-level modifications, better streamlined and platform ready.
Materials and methods
Materials
The study material was an IgG1 antibody with a molecular weight of 149 kDa produced at Amgen and formulated at 70 mg/ml in 10 mM acetate, pH 5.2, 9% sucrose. The antibody target protein was a 17 kDa soluble portion of its antigen tagged with six His residues. The target was formulated at a concentration of 0.81 mg/mL in a solution comprising 30 mM HEPES (pH 7.6), 0.15 M NaCl, and 3 mM CaCl2 and stored at −70°C before use.
Methods
The procedure included the following steps illustrated in and S1.
Antibody stress: photo-stress P2
Several antibody stress conditions were evaluated, including elevated temperature in the original pH 5 formulation at 40°C for 4 weeks (40°C4W); physiological conditions (pH 7, 37°C); extremes of pH; photo stress by combination of cool white and UV light. The photo stress caused the greatest effect on binding: approximately half of the antibody molecules lost partial (with one Fab arm) or complete binding to target, and was chosen for the study. During the photo stress, the antibody was stressed by cool white and UV light (Photo-stress P2) to cause stability-indicating modifications (attributes). The sample was subjected to photo stress P2 according to the International Council for Harmonization of Technical Requirements for Pharmaceuticals for Human Use (ICH) guideline ICH Q1B “Stability testing, photo stability testing of new drug substances and products”. Briefly, antibody samples in the original pH 5 formulation in glass vials were exposed to an illumination of approximately 1.2 million lux hours of cool white fluorescence and 200 watt-hours per square meter of UV irradiance. All samples were maintained at 25°C. Cool white fluorescent lamp was set at 8 klux, and time of incubation was (1.2 million lux hours/8 klux=) 150 h. For UV irradiation, UV lamp was set at 10 watt per square meter, and time of incubation was (200 watt-hours per square meter/10 watt per square meter=) 20 h. The photo stress P2 including the UV irradiation was harsh and above the typical stress experienced by the therapeutic proteins during production, purification, formulation, storage, and in human circulation. The P2 test was designed for method suitability testing to ensure that the analytical methods used are capable of detecting light-induced oxidation on solvent-exposed tryptophan, methionine, histidine, and other residues, if such unexpectedly occur.
Mixing antibody and target protein
A total of 38 µL of 0.25 mg/mL antibody material (Reference Material – RM or P2) was mixed with 2 µL of target at 0.81 mg/mL and incubated at 37° C in HPLC vial for 10 minutes. Then, 20 µL of the mixture was injected into the HPLC for SEC separation.
SEC and fraction collection
Two SEC columns (G3000SWxl, 7.8 mm ID x 30 cm column, Catalog # 08541, TOSOH Bioscience) were linked with a short connecting tube and operated under the following conditions: mobile phase included 100 mM sodium phosphate, 250 mM NaCl, pH 6.8; flow rate 0.5 mL/min; column temperature 37°C. Run time was 35 minutes. Autosampler was at 4 C. UV/VIS detection was performed at 214 nm and 280 nm. The eluting fractions were collected above 10 kDa cutoff filter in 7.5 M guanidine and subjected to sample preparation for peptide mapping.
Peptide mapping
Peptide mapping of the collected fractions was performed using the sample preparation procedure including refolding with guanidine, reduction and alkylation of disulfide bonds, buffer exchange and digestion with trypsin on peptides suitable for HPLC-MS/MS analysis as previously described.Citation47 HPLC-MS/MS peptide mapping analysis was performed on Agilent 1290 HPLC system connected to Thermo Scientific Q-Exactive Biopharma mass spectrometer according. Acquired HPLC-MS/MS raw data and sequences of antibody, target protein and trypsin were used to identify and quantify modifications by MassAnalyzer software.Citation48
Abbreviations
Å, Angstrom; CDR, Complementarity-determining region; cGMP, Current Good Manufacturing Practice; CE, Capillary electrophoresis; CEX, Cation exchange chromatography; CQA, Critical quality attribute; EGFR, Epidermal growth factor receptor; FC, Fold change; FPOP, Fast photochemical oxidation of proteins; HC, Heavy chain; HDX, Hydrogen deuterium exchange; HIC, Hydrophobic interaction chromatography; HPLC, High performance liquid chromatography; IEX, Ion exchange chromatography; Kd, Equilibrium dissociation constant; LC, Light chain; MAM, Multi-attribute method; MS, Mass spectrometry; NMR, Nuclear magnetic resonance; NP, Normal phase; RM, Reference Material; RP, Reversed phase; SEC, Size-exclusion chromatography; PTM, Post-translational modification.
Supplemental Material
Download PDF (1.1 MB)Acknowledgments
We would like to thank colleagues for fruitful discussions and support of the study including Zhongqi Zhang, Daniel Woodall, Professor Roman Zubarev, Jill Crouse-Zeineddini, Scott Kuhns, Scott Siera, Julie Hong, Trent Munro, Greg Zinkl, Patrick Swann, Rohini Deshpande, Jette Wypych, Chetan Goudar. This research was supported by Amgen Inc.
Supplementary material
Supplemental data for this article can be accessed on the publisher’s website.
References
- Kaplon H, Muralidharan M, Schneider Z, Reichert JM. Antibodies to watch in 2020. mAbs. 2020;12:1703531.
- ICH. ICH International Conference on Harmonization (ICH) Guideline Q8 (R2) Pharmaceutical Development. 2009. .https://www.fda.gov/regulatory-information/search-fda-guidance-documents/q8r2-pharmaceutical-development.
- Harris RJ, Kabakoff B, Macchi FD, Shen FJ, Kwong MY, Andya JD, Shire SJ, Bjork N, Totpal K, Chen AB. Identification of multiple sources of charge heterogeneity in a recombinant antibody. J Chromatogr B Biomed Sci Appl. 2001;752:233–10.
- Ponniah G, Kita A, Nowak C, Neill A, Kori Y, Rajendran S, Liu H. Characterization of the acidic species of a monoclonal antibody using weak cation exchange chromatography and LC-MS. Anal Chem. 2015;87:9084–92.
- Yan Y, Liu AP, Wang S, Daly TJ, Li N. Ultrasensitive Characterization of Charge Heterogeneity of Therapeutic Monoclonal Antibodies Using Strong Cation Exchange Chromatography Coupled to Native Mass Spectrometry. Anal Chem. 2018;90:13013–20.
- Fekete S, Beck A, Fekete J, Guillarme D. Method development for the separation of monoclonal antibody charge variants in cation exchange chromatography, Part II: pH gradient approach. J Pharm Biomed Anal. 2015;102:282–89.
- Trappe A, Fussl F, Carillo S, Zaborowska I, Meleady P, Bones J. Rapid charge variant analysis of monoclonal antibodies to support lead candidate biopharmaceutical development. J Chromatogr B Analyt Technol Biomed Life Sci. 2018;1095:166–76.
- Kaschak T, Boyd D, Lu F, Derfus G, Kluck B, Nogal B, Emery C, Summers C, Zheng K, Bayer R, et al. Characterization of the basic charge variants of a human IgG1: effect of copper concentration in cell culture media. mAbs. 2011;3:577–83.
- Liu H, Ren W, Zong L, Zhang J, Wang Y. Characterization of recombinant monoclonal antibody charge variants using WCX chromatography, icIEF and LC-MS/MS. Anal Biochem. 2019;564–565:1–12.
- Harris RJ. Heterogeneity of recombinant antibodies: linking structure to function. Dev Biol. 2005;122:117–27.
- Chaderjian WB, Chin ET, Harris RJ, Etcheverry TM. Effect of copper sulfate on performance of a serum-free CHO cell culture process and the level of free thiol in the recombinant antibody expressed. Biotechnol Prog. 2005;21:550–53.
- Zhang Y, Martinez T, Woodruff B, Goetze A, Bailey R, Pettit D, Balland A. Hydrophobic interaction chromatography of soluble interleukin I receptor type II to reveal chemical degradations resulting in loss of potency. Anal Chem. 2008;80:7022–28.
- Pollastrini JM, Dillon TM, Bondarenko PV, Chou RY. Field flow fractionation for assessing neonatal Fc receptor and Fcgamma receptor binding to monoclonal antibodies in solution. Anal Biochem. 2011;414:88–98.
- Berkowitz SA, Engen JR, Mazzeo JR, Jones GB. Analytical tools for characterizing biopharmaceuticals and the implications for biosimilars. Nat Rev Drug Discov. 2012;11:527–40.
- Abbott WM, Damschroder MM, Lowe DC. Current approaches to fine mapping of antigen-antibody interactions. Immunology. 2014;142:526–35.
- Opuni KFM, Al-Majdoub M, Yefremova Y, El-Kased RF, Koy C, Glocker MO. Mass spectrometric epitope mapping. Mass Spectrom Rev. 2018;37:229–41.
- Goswami D, Zhang J, Bondarenko PV, Zhang Z. MS-based conformation analysis of recombinant proteins in design, optimization and development of biopharmaceuticals. Methods. 2018;144:134–51.
- Luo J, Liu Z, Guo Y, Li M. A structural dissection of large protein-protein crystal packing contacts. Sci Rep. 2015;5:14214.
- Blech M, Peter D, Fischer P, Bauer MM, Hafner M, Zeeb M, Nar H. One target-two different binding modes: structural insights into gevokizumab and canakinumab interactions to interleukin-1beta. J Mol Biol. 2013;425:94–111.
- Cunningham BC, Wells JA. High-resolution epitope mapping of hGH-receptor interactions by alanine-scanning mutagenesis. Science. 1989;244:1081–85.
- Weiss GA, Watanabe CK, Zhong A, Goddard A, Sidhu SS. Rapid mapping of protein functional epitopes by combinatorial alanine scanning. Proc Natl Acad Sci U S A. 2000;97:8950–54.
- Morrison KL, Weiss GA. Combinatorial alanine-scanning. Curr Opin Chem Biol. 2001;5:302–07.
- Zhang Z, Smith DL. Determination of amide hydrogen exchange by mass spectrometry: a new tool for protein structure elucidation. Protein Sci. 1993;2:522–31.
- Englander SW. Hydrogen exchange and mass spectrometry: a historical perspective. J Am Soc Mass Spectrom. 2006;17:1481–89.
- Sevy AM, Healey JF, Deng W, Spiegel PC, Meeks SL, Li R. Epitope mapping of inhibitory antibodies targeting the C2 domain of coagulation factor VIII by hydrogen-deuterium exchange mass spectrometry. J Thromb Haemost. 2013;11:2128–36.
- Houde D, Peng Y, Berkowitz SA, Engen JR. Post-translational modifications differentially affect IgG1 conformation and receptor binding. Mol. Cell Proteomics. 2010;9:1716–28.
- Maleknia SD, Ralston CY, Brenowitz MD, Downard KM, Chance MR. Determination of macromolecular folding and structure by synchrotron x-ray radiolysis techniques. Anal Biochem. 2001;289:103–15.
- Xu G, Chance MR. Radiolytic modification of acidic amino acid residues in peptides: probes for examining protein-protein interactions. Anal Chem. 2004;76:1213–21.
- Xu G, Chance MR. Hydroxyl radical-mediated modification of proteins as probes for structural proteomics. Chem Rev. 2007;107:3514–43.
- Hambly DM, Gross ML. Laser flash photolysis of hydrogen peroxide to oxidize protein solvent-accessible residues on the microsecond timescale. J Am Soc Mass Spectrom. 2005;16:2057–63.
- Aye TT, Low TY, Sze SK. Nanosecond laser-induced photochemical oxidation method for protein surface mapping with mass spectrometry. Anal Chem. 2005;77:5814–22.
- Gau BC, Sharp JS, Rempel DL, Gross ML. Fast photochemical oxidation of protein footprints faster than protein unfolding. Anal Chem. 2009;81:6563–71.
- Chen J, Cui W, Giblin D, Gross ML. New protein footprinting: fast photochemical iodination combined with top-down and bottom-up mass spectrometry. J Am Soc Mass Spectrom. 2012;23:1306–18.
- Jones LM, Sperry B, Carroll A, Gross ML. Fast photochemical oxidation of proteins for epitope mapping. Anal Chem. 2011;83:7657–61.
- Santora LC, Kaymakcalan Z, Sakorafas P, Krull IS, Grant K. Characterization of noncovalent complexes of recombinant human monoclonal antibody and antigen using cation exchange, size exclusion chromatography, and BIAcore. Anal Biochem. 2001;299:119–29.
- Sanny CG. Antibody-antigen binding study using size-exclusion liquid chromatography. J Chromatogr B Analyt Technol Biomed Life Sci. 2002;768:75–80.
- Rehder DS, Chelius D, McAuley A, Dillon TM, Xiao G, Crouse-Zeineddini J, Vardanyan L, Perico N, Mukku V, Brems DN, et al. Isomerization of a single aspartyl residue of anti-epidermal growth factor receptor immunoglobulin gamma 2 antibody highlights the role avidity plays in antibody activity. Biochemistry. 2008;47:2518–30.
- Demeule B, Shire SJ, Liu J. A therapeutic antibody and its antigen form different complexes in serum than in phosphate-buffered saline: a study by analytical ultracentrifugation. Anal Biochem. 2009;388:279–87.
- Philo JS. Overview of the quantitation of protein interactions. Curr Protoc Protein Sci. 2001;20:1–13.
- Arthur KK, Gabrielson JP, Hawkins N, Anafi D, Wypych J, Nagi A, Sullivan JK, Bondarenko PV. In vitro stoichiometry of complexes between soluble RANK ligand and the monoclonal antibody Denosumab. Biochemistry. 2012;51:795–806.
- Shi RL, Xiao G, Dillon TM, McAuley A, Ricci MS, Bondarenko PV. Identification of critical chemical modifications by size exclusion chromatography of stressed antibody-target complexes with competitive binding. mAbs. 2021. https://doi.org/10.1080/19420862.2021.1887612.
- Zhang Z, Shah B, Bondarenko PV. G/U and certain wobble position mismatches as possible main causes of amino acid misincorporations. Biochemistry. 2013;52:8165–76.
- Lacy ER, Baker M, Brigham-Burke M. Free sulfhydryl measurement as an indicator of antibody stability. Anal Biochem. 2008;382:66–68.
- Cirino PC, Mayer KM, Umeno D. Generating mutant libraries using error-prone PCR. Methods Mol Biol. 2003;231:3–9.
- Rogers RS, Nightlinger NS, Livingston B, Campbell P, Bailey R, Balland A. Development of a quantitative mass spectrometry multi-attribute method for characterization, quality control testing and disposition of biologics. mAbs. 2015;7:881–90.
- Rogers RS, Abernathy M, Richardson DD, Rouse JC, Sperry JB, Swann P, Wypych J, Yu C, Zang L, Deshpande RA. View on the Importance of “Multi-Attribute Method” for Measuring Purity of Biopharmaceuticals and Improving Overall Control Strategy. Aaps J. 2018;20:1–8.
- Ren D, Pipes GD, Liu D, Shih LY, Nichols AC, Treuheit MJ, Brems DN, Bondarenko PV. An improved trypsin digestion method minimizes digestion-induced modifications on proteins. Anal Biochem. 2009;392:12–21.
- Zhang Z. Large-scale identification and quantification of covalent modifications in therapeutic proteins. Anal Chem. 2009;81:8354–64.