
ABSTRACT
The occurrence of an immune response against therapeutic proteins poses a major risk for the development of biologics and for successful treatment of patients. Generation of anti-drug antibodies (ADAs) can lead to formation of immune complexes (ICs), consisting of drug and ADAs, with potential impact on safety, efficacy and exposure. Here, we focus on the effects of IC formation, i.e., specific IC sizes, ADA and drug properties, on drug pharmacokinetics. Pre-formed IC preparations of an IgG1 drug (with wild type or with an ablated effector function at the Fc domain) and different ADA surrogates (directed against the complementarity-determining regions or Fc domain of the drug) were administered to rats and collected serum was analyzed to determine the total drug concentration. A combination of size-exclusion chromatography and ELISA enabled a size-specific evaluation of IC profiles in serum and their changes over time. Within five minutes, total drug concentration decreased by ~20–60% when the drug was complexed. Independent of the ADA surrogate and drug variant used, increasing IC size led to increased clearance. Comparing ICs formed with the same ADA surrogate but different IgG1 variants, we observed that complexed drug with a wildtype Fc domain showed faster clearance compared to immune effector function modified drug. Data generated in this study indicated that clearance of drug due to ADA generation is driven by size and structure of the formed ICs, but also by the immune effector functions of the Fc domains of IgGs.
Abbreviations Ab: antibody, ADA: anti-drug antibody, AUC: area under the curve, Bi: biotin, CDR: complementary-determining region, cmax: maximal concentration, Dig: digoxigenin, ELISA: enzyme-linked immunosorbent assay, Fc: fragment crystallizable, FcRn: neonatal Fc receptor, HMW: high molecular weight, IC: immune complex, IC-QC: immune complex quality control, IgG: immunoglobulin G, mAb: monoclonal antibody, mADA: monoclonal ADA, pAb: polyclonal antibody, pADA: polyclonal ADA, PD: pharmacodynamics; PK: pharmacokinetic, QC: quality control, SEC: size-exclusion chromatography, WT: wildtype
Introduction
Monoclonal antibodies (mAbs) and other biotherapeutics allow targeted treatment of a variety of diseases. Although great effort is undertaken during drug development to reduce immunogenicity of antibody therapeutics, immunogenicity is nevertheless one of the most critical challenges for this class of therapeutics. Adverse events, like pharmacological abrogation or hypersensitivity reactions, can be triggered by binding of anti-drug antibodies (ADAs) to circulating drug and subsequent formation of immune complexes (ICs) (type III reaction) or by surface-associated formation of ICs (type II reaction).Citation1 ADAs can be neutralizing or non-neutralizing. Neutralization of therapeutic mAbs is mainly caused by the binding of ADAs to the complementary-determining region (CDR), and can subsequently lead to abrogation of pharmaceutical activity.Citation2,Citation3 ADAs directed against the CDR of a therapeutic mAb are described for humanized as well as for fully human molecules.Citation4,Citation5 Besides preventing the binding of the drug to its target, formation of ICs can affect the total drug exposure, leading to increased clearance.Citation6,Citation7
IC formation can affect pharmacokinetic (PK) and pharmacodynamical (PD) properties of therapeutic proteins, like safety (e.g., hypersensitivity reactions), loss of exposure, and efficacy, and a better understanding of the process will help modeling and simulation aspects of PK in the presence of ICs.Citation7 From the bioanalytical point of view, ADAs can be a challenge, as they can interfere in total drug PK assays, and therefore lead to biased results.Citation8–10
The detailed interaction between ADA and drug, that is, the formation of drug/ADA ICs, is well understood.Citation11,Citation12 Although it is well known from literature that large ICs are cleared faster than smaller ICs, quantitative information about the exact size or structure of the ICs, as well as their actual impact on drug PK is missing.Citation7,Citation13–16
To study the effects of IC formation on the PK of two therapeutic mAbs, in vivo studies in rats with pre-formed and defined IC preparations were performed.Citation11 Animals were dosed with monomeric/uncomplexed monoclonal IgG1 (hereinafter referred to as “drug”) or IgG1 that was fully complexed with different ADA surrogates targeting either the Fc or CDR of the drug (anti-Fc ADA → <Fc>, anti-CDR ADA → <CDR>).
The Fc domain of an IgG has different effector functions. For example, it plays a crucial role in the binding to Fcɣ receptors and complement. Both, the Fcɣ receptor and complement, play a role in the clearance of antigen-mAb ICs and Fc-mediated toxicity.Citation13 An exchange of defined amino acids (PGLALA mutation) in the Fc domain of an IgG abolish these interactions and lead to a “silent” Fc effector function.Citation17 For our studies, we used two different variants of the drug: 1) with a wildtype Fc (WT-Fc) domain (drugWT), and 2) with a modified effector function (drugPGLALA).Citation17 The ADA surrogates were derived from different species and were monoclonal or polyclonal antibodies (pADA<CDR>, mADA<CDR>, mADA<Fc>). The applied bioanalytical assay panel was previously described and allowed the quantification of total drug (free and fully complexed) and size-specific IC PK evaluation in the collected matrices.Citation11
The goal of this work was to study the effects of IC size and property on drug PK, focusing on the effect of the different drug and ADA properties. Additionally, the clearance of the different IC species was analyzed in more detail. As it is known from literature that ICs can have a faster clearance compared to monomeric molecules, our study focused on the first hours after administration to investigate particularly the initial clearance phase.Citation1,Citation13
Results
Dosing solutions: Generation of drug/ADA complexes
The dosing solutions were prepared as described by Hoffman et al., where also different conditions and concentrations of the components were tested.Citation11 The dosing solutions for the control groups contained monomeric IgG1 (drug, germline sequence, no target-binding specificity) with a WT-Fc domain (drugWT) or a PGLALA mutation in the Fc domain (drugPGLALA).Citation17 The dosing solutions for the IC groups were generated by mixing one of the two drug variants with one of three ADA surrogates (monoclonal or polyclonal IgG against the CDR of the drug and a monoclonal IgG against the Fc domain of the drug) in a ratio of 1:1.5. In sum, eight different solutions were prepared.
Residual dosing solutions were analyzed by size-exclusion chromatography (SEC) to determine the composition and pattern of the generated ICs (, UV trace at 280 nm) and to allow a detailed comparison with the IC profiles in the in vivo samples. Furthermore, dosing solutions of drugPGLALA + pADA<CDR> and drugPGLALA + mADA<Fc> were analyzed via SEC and a subsequent drug-specific ELISA. The overlay of the UV trace and the reconstructed ELISA profile demonstrated the absence of monomeric drug (22.5 min) in the dosing solutions (, c). The monomer peak in the UV trace at 22.5 min resulted from the excess of ADAs.
Figure 1. Analysis of dosing solutions yy SEC and ELISA. (a) Size exclusion Chromatograms (absorbance) of all dosing solutions. (b/c) Dosing solution with drugPGLALA + pADA<CDR> (b) and drugPGLALA + mADA<Fc> (c): Absorbance (solid line) and reconstructed ELISA profile (dashed line). No monomeric drug detectable in the reconstructed ELISA IC profiles. Elution of monomeric IgG at ~ 22.5 min
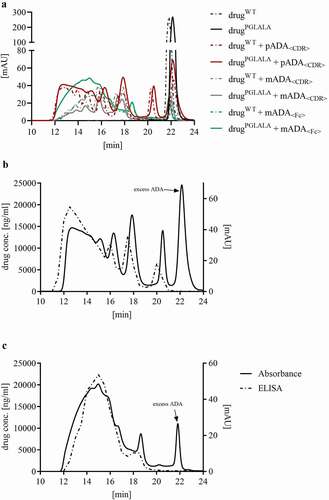
Detailed analysis of IC generation and the size of the formed ICs was previously published by Hoffmann et al.Citation11 The dosing solution generated with drugPGLALA + pADA<CDR> were composed of 7% dimers, 13% tetramers, 10% hexamers, and 53% high molecular weight (HMW) ICs (+15% excess ADA, relating to the AUC).Citation11 For drugWT + pADA<CDR>, the dosing solution showed a distribution of 8% dimers, 16% tetramers, 13% hexamers, and 49% HMW ICs. The distribution of the IC species for the other solutions are summarized in .
Table 1. Composition of the IC dosing solutions. The percentages of defined IC sizes in the dosing solutions were determined by analyzing the area under the curve of the UV trace of the SEC chromatograms. The “% monomeric ADA” listed in the table is the value of the area under the curve of the ADA monomer UV peak
Comparison of drug concentration in serum and plasma
To exclude an impact of serum preparation on drug content (especially when complexed with ADAs in large ICs), e.g., due to aggregation during clotting, blood samples from a control group (drugPGLALA) and an IC group (drugPGLALA + pADA<CDR>) were split and serum and plasma were generated. The results demonstrated that the drug concentration in serum and plasma had a variation of less than 10% (). As no impact of serum preparation on total drug concentration could be observed, serum was used as matrix of choice for all further analyses.
Figure 2. Comparison of the total drug concentration in serum and plasma. Blood from groups dosed with drugPGLALA or drugPGLALA + pADA<CDR> was divided for serum and plasma preparation and the total drug concentration was determined yy acid dissociation ELISA to study potential influences of serum/plasma preparation on drug concentration when complexed with ADAs
Total drug PK analysis
Rats in the comparison groups were dosed with a total drug concentration of 4 mg/kg, rats in the IC groups were dosed with pre-formed ICs composed of 4 mg/kg drug and 6 mg/kg ADA. Serum samples were taken 5 min, 30 min, 1 hr, 4 hr, 8 hr, 24 hr, 48 hr, and 72 hr after administration. Determination of total drug concentration in study serum samples was performed with a total drug ELISA (an ADA-tolerant, drug-specific acid dissociation ELISA). The recovery of total drug was ensured by using a set of IC-QCs with defined concentrations of drug fully complexed with ADAs and conventional assay criteria of ±20% drug recovery (H-IC-QC: 300 µg/ml drug + 450 µg/ml ADA, M-IC-QC: 150 µg/ml drug + 225 µg/ml ADA, L-IC-QC: 7.5 µg/ml drug + 11.25 µg/ml ADA).Citation11 All subjects within one dosing group (3 rats/group) showed good homogeneity of determined drug concentrations. The drug concentrations for all groups are displayed in and Table S1.
Figure 3. Total drug concentration in serum samples of all groups (PK data was fitted to a 2 compartment model for intra venous bolus injection by statistical method, with relative standard deviation (coefficient of variation), n = 3)
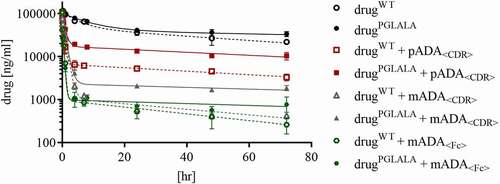
Figure 4. Reconstructed drug + pADA<CDR> IC profiles from serum samples (mean values of all three animals). (a) ICs were separated by SEC, fractionated, and he drug concentration in every collected fraction was determined by total drug ELISA to reconstruct the IC profiles. Potential elution of monomeric drug is marked with a dashed line. Elution time [min] refers to the elution of drug/ICs from the SEC column. (b) Defined time points were selected for comparison of drugWT + pADA<CDR> and drugPGLALA + pADA<CDR> indicating clearance differences of the respective dimeric and tetrameric ICs
![Figure 4. Reconstructed drug + pADA<CDR> IC profiles from serum samples (mean values of all three animals). (a) ICs were separated by SEC, fractionated, and he drug concentration in every collected fraction was determined by total drug ELISA to reconstruct the IC profiles. Potential elution of monomeric drug is marked with a dashed line. Elution time [min] refers to the elution of drug/ICs from the SEC column. (b) Defined time points were selected for comparison of drugWT + pADA<CDR> and drugPGLALA + pADA<CDR> indicating clearance differences of the respective dimeric and tetrameric ICs](/cms/asset/994a178a-f12b-4717-bbc4-2a7239c21772/kmab_a_1995929_f0004_oc.jpg)
Figure 5. Reconstructed drug + mADA<CDR> IC profiles from serum samples (mean values of all three animals). (a) ICs were separated by SEC, fractionated, and the drug concentration in every collected fraction was determined by total drug ELISA to reconstruct the IC profiles. Potential elution of monomeric drug is marked with a dashed line. Elution time [min] refers to the elution of drug/ICs from the SEC column. (b) Defined time points were selected for comparison of drugWT + mADA<CDR> and drugPGLALA + mADA<CDR> indicating clearance differences of the respective dimeric and tetrameric ICs
![Figure 5. Reconstructed drug + mADA<CDR> IC profiles from serum samples (mean values of all three animals). (a) ICs were separated by SEC, fractionated, and the drug concentration in every collected fraction was determined by total drug ELISA to reconstruct the IC profiles. Potential elution of monomeric drug is marked with a dashed line. Elution time [min] refers to the elution of drug/ICs from the SEC column. (b) Defined time points were selected for comparison of drugWT + mADA<CDR> and drugPGLALA + mADA<CDR> indicating clearance differences of the respective dimeric and tetrameric ICs](/cms/asset/12fe099f-988e-4e29-9297-08afffb391f7/kmab_a_1995929_f0005_oc.jpg)
The 5 min samples from the control groups dosed with monomeric drug had concentrations of 106.6 µg/ml (drugPGLALA) and 107.7 µg/ml (drugWT), which matched the calculated maximal concentration (cmax) of ~110 µg/ml, assuming a serum volume of 36 ml/kg.
For the IC groups, drug concentrations at the first sampling time point (5 min) were lower compared to the calculated cmax of 110 µg/ml. Groups dosed with drugWT or drugPGLALA + mADA<Fc> showed a drug concentration of 42.4 and 38.4 µg/ml, respectively. For the groups dosed with drugWT or drugPGLALA + pADA<CDR> drug concentrations of 86.8 and 72.1 µg/ml were observed, respectively.
After one hour, the total drug concentration for animals dosed with drugPGLALA + pADA<CDR> was 42.9 µg/ml and for those dosed with drugWT + pADA<CDR> 16.8 µg/ml. Groups that received ICs of drugWT or drugPGLALA + mADA<CDR> had total drug concentrations of 27.2 and 24.2 µg/ml, respectively, after one hour. After approximately four hours, the PK for all groups showed a similar concentration–time profile ().
To better understand the differences in total drug concentration between the IC groups and to study the clearance of different IC sizes, study samples were further analyzed by SEC and ELISA.
IC size-specific analysis: SEC and acid dissociation ELISA
For the reconstruction of the IC profiles and the detection of changes in the profiles over time, the ICs in the serum samples were separated by SEC and collected fractions were subsequently analyzed for their drug concentration via a drug-specific ELISA as previously described by Hoffmann et al.Citation11
To exclude biased results due to loss of ICs during the process of SEC and fractionation, we performed a mass balance analysis; the drug amount recovered from collected fractions was compared to the total drug concentration of this serum sample with a tolerance in discrepancy of 25%.Citation11 All analyzed samples passed this criterion, confirming that no IC species were lost during SEC. The reconstructed IC profiles shown in , and S1 show the mean of three animals.
Figure 6. Reconstructed drug + mADA<Fc> IC profiles in serum samples (mean values of all three animals). ICs were separated by SEC, fractionated, and the drug concentration in every collected fraction was determined by total drug ELISA to reconstruct the IC profiles. Potential elution of monomeric drug is marked with a dashed line. Elution time [min] refers to the elution of drug/ICs from the SEC column. IC profiles for later time points (8 hr – 72 hr) are not illustrated because of very low concentration
![Figure 6. Reconstructed drug + mADA<Fc> IC profiles in serum samples (mean values of all three animals). ICs were separated by SEC, fractionated, and the drug concentration in every collected fraction was determined by total drug ELISA to reconstruct the IC profiles. Potential elution of monomeric drug is marked with a dashed line. Elution time [min] refers to the elution of drug/ICs from the SEC column. IC profiles for later time points (8 hr – 72 hr) are not illustrated because of very low concentration](/cms/asset/344a5aa8-61fe-440b-8326-9070dd90568f/kmab_a_1995929_f0006_b.gif)
Comparing the reconstructed five minutes serum IC profile (, Figure S1) of the group dosed with drugPGLALA + pADA<CDR> with the appropriate dosing solution (), significant reduction of the HMW ICs (ICs ≥ hexamers) was observed. After four hours, HMW ICs were almost quantitatively cleared (, Figure S1). In the 72 hours sample, the predominant IC species were dimers and tetramers. Hexameric ICs were only present in low concentration.
The dosing solutions (, ) of drugPGLALA or drugWT + pADA<CDR> had a similar content of the different IC sizes, and the reconstructed IC profile of the sample from animals dosed with drugWT + pADA<CDR> was highly comparable to the five-minute profile from drugPGLALA + pADA<CDR> () with the same tendency of HMW IC clearance. At later time points (1 hour and 24 hours), drugWT and drugPGLALA complexed in a dimeric IC with pADA<CDR> showed similar concentrations, whereas the drugWT complexed in tetrameric and larger ICs showed a much faster decrease in concentration compared to the respective drugPGLALA ICs ().
Analysis of samples from the groups dosed with drugWT or drugPGLALA + mADA<CDR> showed overlaying IC patterns between both drug variants for the first hour (, Figure S1). After four hours, only dimeric ICs were detected at very low concentrations for drugWT. For drugPGLALA, tetrameric and dimeric ICs were still present ().
Sample analysis of animals dosed with drugWT or drugPGLALA + mADA<Fc> showed a fast clearance of ICs larger than tetramers (, Figure S1). No significant difference in the clearance of defined IC species was detected comparing ICs formed with drugWT or drugPGLALA, as discussed below.
In the observed period, no monomeric drug was detected in any study sample (elution time at 22.5 min, to 6, marked with dashed line).
Based on the total drug concentration in the study sample and on the drug concentration in defined IC species, total drug and IC size-specific drug clearance were calculated. The values are summarized in . Total drug clearance was higher when drugWT was used for IC generation. This is also true for all size-specific IC drug clearance values determined. The clearance of drug complexed with pADA<CDR> in a dimeric IC was very similar for drugWT and drugPGLALA. Tetrameric ICs of drugPGLALA + pADA<CDR> showed a slower clearance compared to tetrameric ICs with drugWT. Clearance of HMW ICs was very high for all groups. In general, clearance increased with IC size, independent of the drug variant or ADA surrogate.
Table 2. Clearance values of monomeric drug and drug complexed in defined IC species
Discussion
Immunogenicity, in particular the formation of ADAs against a biotherapeutic, can affect efficacy and lead to loss of drug exposure. The binding of ADAs to the drug lead to the formation of ICs. The size and the structure of these ICs depend on different parameters, like ratio, concentration and the epitope.Citation11 Here, we studied the effect of ICs on drug PK by focusing on the impact of drug Fc functionalities (wildtype or effector function modified), ADA properties, and the IC sizes on drug clearance.
Several approaches were published to analyze the formation of ICs after an immune response against a biotherapeutic. For example, Schie et al. used patient-derived, ADA-positive sera to analyze the present ICs and to characterize ICs formed with isolated human ADAs in vitro.Citation12
Johansson et al. and Rojas et al. worked with an approach where a subsequent dosing of a drug and ADA surrogate for the formation of ICs in vivo was used.Citation16,Citation18 Although ICs were formed in an in vivo environment, determination of the effect of IC formation on drug PK is challenging, because the initial situation and IC size distribution is unknown.
To enable a detailed evaluation of how the formation of drug/ADA ICs affects the drug PK, we conducted in vivo studies using pre-formed drug/ADA ICs. The dosing solutions contained ICs with a well-known complex sizes, as well as well-known distribution and amount of the ICs ().Citation11 With the knowledge of the IC sizes and amounts dosed to the study animals, an evaluation of size-specific IC clearance could be performed.
To mimic the natural conditions as well as possible, we used pre-formed, but non-covalent ICs for the in vivo studies presented here. We considered the alternative of covalent coupling as reported in some studies as less optimal due to the potential formation of artificial, unnatural ICs due to undirected coupling.Citation14,Citation15
For the formation of the ICs used in this study, human IgG1 drug surrogates (germline sequence) lacking any target-binding specificity were selected to exclude target-mediated clearance. Two variants of this surrogate were used: a wildtype Fc and a variant with a PGLALA mutation (ablating its immune effector functions), often used for therapeutic monoclonal Abs.Citation17 As the effector function of the Fc domain is relevant for the disposition and clearance of ICs, this property has to be taken into consideration for data interpretation.Citation11,Citation17,Citation19–22
As ADA surrogates, we used three animal-derived IgGs as recommended by the regulatory guidelines to be used as positive controls for immunogenicity testing methods.Citation23,Citation24 To mimic the natural polyclonal immune response, we selected a polyclonal Ab directed against the CDR of the drug (pADA<CDR>, rabbit derived).Citation2,Citation3,Citation12 To further study the influence of the clonality of the ADA, we included a monoclonal ADA surrogate against the drug CDR (mADA<CDR>, mouse derived). To study the effect of the epitope, a third ADA surrogate directed against the Fc domain (mADA<Fc>. mouse derived) was selected to perform the studies (CDR vs. Fc-specific ADAs).Citation11 The animal-derived ADA surrogates showed comparable IC formation properties as human-derived ADAs, confirming the suitability for the in vivo studies described here.Citation11,Citation12
The selected ADA surrogates had wildtype immune effector functions. Biacore and Octet experiments (data not shown) confirmed the binding of all used ADA surrogates to rat Fcɣ receptors (CD32 and CD64), which was in agreement with literature.Citation25–30
Generation and characterization of defined IC mixtures and the bioanalytical tools needed for analysis were developed and described previously.Citation11 The ratio of drug and ADA (1:1.5) was chosen to guarantee full complexation of drug with ADAs with minimal ADA excess. As the focus of the study was the effect of drug/ADA IC formation on drug PK, no monomeric drug should bias the results. Furthermore, the lack of initial-free drug simplifies the detection of potential IC dissociation in vivo, although previous in vitro experiments showed the high stability of the pre-formed ICs used.Citation11
In vivo experiments were performed in rats to obtain sufficient blood volumes for the extensive IC analysis. Rats provide enough blood volume for serial blood sampling to minimize variability. As previous reports have demonstrated that especially large ICs showed a fast clearance, the observation period was set at 72 hours with frequent blood sampling within the first hours to monitor the initial clearance of the ICs.Citation1,Citation13,Citation16 Additionally, a short study period minimized the risk of endogenous ADA formation in the rats, which would bias IC distribution and clearance.
The guidelines for immunogenicity testing give no clear recommendations regarding the best matrix, serum or plasma, for ADA detection.Citation23,Citation24 As long as the ADA is a monomer, the effect of blood preparation on the ADA content should not be relevant. If ADAs are complexed with drug (especially large ICs), serum preparation (i.e., clotting) could have an effect on the IC concentration and therefore on ADA concentration in the study samples, e.g., due to precipitation, aggregation or sticking of drug/ADA ICs to the clotted pellet. To exclude this potential source of errors, the concentration of the total drugPGLALA (monomeric and in complex with pADA<CDR>) in serum and plasma (no clotting during plasma generation) was compared. Selected blood samples were divided and processed to serum and plasma in parallel and analyzed for the total drug concentration via acid dissociation ELISA. The variation between determined drugPGLALA concentrations in serum and plasma was less than 10% (), indicating that serum preparation did not have an effect on the IC concentration in the in vivo samples. Consequently, serum is a suitable matrix for the analysis of ICs and immunogenicity testing in general since serum preparation should not result in loss of ADAs due to IC formation. All further bioanalytical analysis of the total drug concentration as well as the analysis of the IC profiles were performed in serum.
The total drug concentration for the control groups (drugPGLALA, drugWT) showed expected and similar PK profiles for monomeric IgG molecules with cmax (5 min) of 107.7 and 106.6 µg/ml (, Table S1 calculated cmax: 110 µg/ml), indicating that the administered dose as well as the bioanalytical results are correct.
The cmax of drug complexed with ADAs was reduced 20 to 60% compared to monomeric drug, although all groups received the same drug concentration of 4 mg/kg (the drug concentration in all dosing solutions was confirmed by ELISA, data not shown). The use of IC-QCs (fully complexed drug), in addition to conventional QCs (monomeric drug), was used to monitor the performance of the total drug assay and show that the observed reduced recovery was not due to an analytical bias (ADA interference), but was a biological effect.Citation11 This tremendous difference in the first five minutes between monomeric and complexed drug and between different ADA surrogates indicated very rapid binding in vasculature followed by specific clearance from circulation.Citation12,Citation13
During the first four hours, fast clearance of complexed drug was detected in all IC groups, followed by a parallel concentration/time profile (). This observed parallel concentration/time profile could theoretically be caused by the dissociation of ICs into monomeric drug and ADAs. The bioanalytical method, a combination of SEC and drug-specific ELISA, has the potential to monitor such a dissociation.Citation11 During the studied period, no monomeric drug was detected for all IC groups (), excluding dissociation into monomers as the reason for the parallel concentration/time profile in the drug PK (). Dissociation of larger ICs into smaller ICs (without the appearance of monomeric drug) is another theoretical consideration for this observed effect. As we did not detect an increase for smaller ICs in the reconstructed IC profiles, but rather can see a constant decrease, we consider this process as unlikely. In addition, our in vitro pre-studies showed that the formed ICs (also HMW ICs) were highly stable, even after high dilution.Citation11 Another possible explanation for the observed parallel concentration/time profile could be the impact of specific Fcɣ receptors, responsible for the uptake and degradation of ICs, or even of FcRn, due, for example, to saturation or selective processing of IC sizes, which must be further examined in appropriate studies. Nevertheless, after four hours the monomeric drugs and the complexed drugs followed the same kinetic behavior, suggesting that the remaining small ICs were cleared with a very similar elimination rate as the monomeric forms.
As the dosed IC composition were well known (), we could follow the changes of the IC pattern in vivo and were able to evaluate IC size-specific PK. For all groups dosed with complexed drug, reconstructed IC profiles of the five minutes sample showed that a relevant part of the HMW ICs were already cleared (). The calculated clearance values () for the HMW ICs range between ~2,500 and more than 12,000 mg/day/kg. This rapid clearance was most likely due to FcɣR-mediated phagocytic uptake and complement binding, as Schie et al. could demonstrate strong activation for ICs larger than hexamers in an in vitro approach.Citation12,Citation13 The fast clearance of the HMW fraction of the dosed ICs () also explained the low total drug concentration after already five minutes observed for these groups (, Table S1).
The reconstruction of the IC patterns of the groups dosed with drug + pADA<CDR> enabled an analysis of the clearance of defined IC species and demonstrated the effect of the Fc domain of the drug (wildtype vs. PGLALA effector function) on clearance. For drugWT + pADA<CDR> (, Figure S1), only dimeric ICs were present at higher amounts after four hours, whereas all larger ICs were already cleared. The fast clearance of ICs larger than dimers could explain why Schie et al. only detected dimeric ICs in patient samples.Citation12 For drugPGLALA + pADA<CDR>, tetrameric and dimeric ICs were still present after 72 hours (, Figure S1). A direct overlay of the reconstructed IC patterns with drugWT and drugPGLALA at defined time points visualized the impact of the drug Fc domain variants. The 5 min overlay () showed no difference in the IC pattern between both drug variants. Over time, the dimeric ICs for drugWT and drugPGLALA showed the same concentration, but tetrameric and larger ICs of drugWT were cleared much faster compared to ICs with drugPGLALA (). In a previous work, we demonstrated that ICs generated with pADA<CDR> form cyclic structures with Fc domains facing inwards and/or outwards of the ring.Citation11 In case of tetrameric and larger ICs of drugWT + pADA<CDR>, every IgG in these ICs has a WT-Fc effector function and can therefore bind to Fc receptors. In tetrameric and larger ICs of drugPGLALA + pADA<CDR>, only every second IgG (only the ADA) carried a WT-Fc effector function. Therefore, binding to Fc receptors seemed to be decreased, which is also reflected in the lower drugPGLALA clearance if complexed in tetrameric ICs (13.8 mg/day/kg for drugPGLALA compared to 209 mg/day/kg for drugWT, ). In a dimeric IC the Fc effector functions of the drug did not have a detectable effect, most likely due to the structure of the IC dimer with Fc domains facing in opposite directions. This was also underlined by the comparable clearance values of the dimeric ICs (11.2 and 4.44 mg/kg/day, ). These results confirm the in vivo relevance of the FcɣR-mediated clearance and are in line with the in vitro findings of Schie et al. that at least four active Fc moieties are needed for an efficient FcɣR-mediated internalization by macrophages.Citation12
In contrast, HMW ICs that are cleared faster via at least two pathways (FcɣR and complement) showed very similar clearances independent of the Fc effector function of the drug (wildtype or PGLALA, , b). We conclude from this finding that the PGLALA mutation has little impact on the clearance if the IC size reaches a critical size (> hexamer), resulting in the formation of less structured ICs.
For rats dosed with drugWT or drugPGLALA + mADA<CDR> the clearance values for defined IC species were comparable to the corresponding IC species counterparts with pADA<CDR>, although the total drug clearance for ICs with mADA<CDR> was noteworthy higher compared to pADA<CDR> (, ). This was most likely due to the generally lower content of dimeric ICs for drug + mADA<CDR> (, , S1). Dimeric ICs showed the lowest clearance values, which were comparable to monomeric drug (control groups, ).
The total PK as well as the SEC analysis of the groups dosed with drugWT or drugPGLALA + mADA<Fc> showed no significant differences (, , Figure S1). Comparing the effect of ADAs directed against the drug CDR or Fc domain, we saw a much faster clearance of ICs when formed with ADAs against drug Fc domain. This could be explained by the high amount of HMW ICs in the dosing solution (), but most likely also by the structure of the formed ICs.Citation11 In our previous work we demonstrated the formation of ring structured ICs when using ADAs against drug CDR. For ICs generated with ADAs against drug Fc, we did not find any clear structures.Citation11 Therefore, we conclude that ICs of drug + mADA<Fc> mainly form linear, less structurally defined ICs, which can bind better to Fc receptors and form a better platform for complement binding compared to ring-structured ICs. This observation was also made in in vitro experiments. It was found out that Fc-linked IgG hexamers activated complement efficiently, whereas anti-idiotypic ICs did not.Citation12,Citation31,Citation32 In general, this data indicates that increased clearance of ICs is not an ADA property, but rather every ADA can have clearing potential when the formed ICs have a critical size (dependent on ratio and concentration of drug and ADA) in combination with the structure of the formed ICs.Citation11
Based on our observations, different aspects, like the ratio between ADA and drug, the concentration of both compounds, the structure of formed ICs, but also the Fc properties (wildtype vs. PGLALA mutation) seem to drive IC clearance. Comparing the drug clearance between groups dosed with complexed drug carrying a wildtype Fc domain and groups dosed with complexed drug carrying a PGLALA mutation, values were ~3-fold higher for complexed drug with a WT-Fc domain (). As we can exclude target-mediated drug disposition through the CDR of the drug surrogates, these differences in IC clearance indicate the important role of the drug Fc effector function and the associated interactions with complement and FcɣRs for the IC clearance process.
The use of pre-formed ICs in the dosing solution enabled us to analyze the IC size-specific PK of drug/ADA ICs. Appropriate for the intended purpose of analyzing the fast clearance of ICs, frequent blood sample collection was performed in the first hour after dosing, and rare blood sampling at later time points. Despite the short observation time of 72 hours and the resulting estimate for AUClast to infinity, we believe that the clearance values reflect well the differences between IC entities ().
Since formation of IC sizes is dependent on ratio and concentration, the formation of HMW ICs in vivo is possible. However, as we could demonstrate in our in vivo studies, these types of ICs are very rapidly cleared, and consequently detection of such in vivo patient samples is unlikely.
Overall, the detailed bioanalysis in combination with the chosen study design gave us a better understanding about the impact of ICs on drug PK, comparing the influence of different ADA properties, drug variants, and IC sizes. The high flexibility of the used analytical methods enables a broad application for complex analysis in biological matrices of different nature.
For better understanding the clearance pathways, metabolism, and distribution of ICs, in particular for the very fast clearance of HMW ICs, follow-up in vivo studies are needed to shed more light on these processes.
Materials and methods
Reagents
10x phosphate-buffered saline (PBS, 11666789001), Roche universal buffer for ELISA (RUB), and bovine serum albumin (BSA, 10735094001) were obtained from Roche Diagnostics GmbH (Germany). Rat serum (female, Wistar rats) was obtained from Charles River Laboratories (Germany). Rat plasma (#RATPLLIHP-WH, lot #Rat329266) was obtained from Seralab (UK). 25% HCl (1.00316), ethanol, 30% H2O2, and Tris(hydroxymethyl)aminomethane (Tris/HCl) and NaCl (1.06404) were obtained from Merck KGaA (Germany). Histidine was ordered from Sigma (H6034 and 56190, respectively). Glycine and 3-(4Hydroxyphenyl) propionic acid (HPPA) were obtained from Serva Electrophoresis GmbH (Heidelberg, Germany) and Sigma Aldrich (St. Louis, MO, USA), respectively.Citation11
Antibodies
All antibodies used in this study as well as the labeling with biotin (Bi) and digoxigenin (Dig) were performed in house (Roche, Pharmaceutical Research and Early Development and Roche Diagnostics GmbH). Antibodies and buffer used for in vivo applications were tested and approved for endotoxin levels. The ADA surrogates pAb<CDR>, mADA<CDR>, and mADA<Fc> were generated by immunization of rabbits and mice (hybridoma technology) with the drug fragments, respectively.Citation33 The IgG1 drug surrogates were predominantly expressed in a human cell line.
Generation and characterization of dosing solutions
Generation of ICs for dosing was performed with endotoxin tested and approved antibodies in 20 mM histidine/HCl. 140 mM NaCl, pH 6. 2 mg/ml drug and 3 mg/ml ADA were mixed and incubated for at least 1 hr at room temperature (r.t.) on a shaker at 450 rpm before administration to allow adjustment of an equilibrium. For further analysis, aliquots of the dosing solutions were stored at −80°C. Dosing solutions were analyzed by SEC using a Dionex Ultimate 3000 system with a Waters XBridge Protein BEH SEC Guard Column, 450 Å, 3.5 µm, 7.8 mm × 30 mm and XBridge Protein BEH SEC Column, 450 Å, 3.5 µm, 7.8 mm X 300 mm (for more details see Hoffmann et al.). 11 the relative proportion of defined IC species (defined peaks in SEC) was determined by the AUC using Chromeleon software (). The drug content in the respective ICs was estimated based on the %-distribution of the different IC species.
Study design
All studies were conducted with the approval of the local veterinary authorities in strict adherence to the German and Swiss federal regulations on animal protection and to the rules of the Association for Assessment and Accreditation of Laboratory Animal Care International (AAALAC). Female Wistar rats (Crl:WI, Charles River Laboratories) received a single intravenous injection of monomeric drug (3 rats/group) or ICs of drugWT or drugPGLALA and pADA<CDR>, mADA<CDR>, or mADA<Fc> (3 animals/group) into the tail vein. A dose of 4 mg/kg monomeric drug were administered. ICs were injected at a dose of 10 mg/kg (1:1.5 ratio drug (4 mg/kg) to ADA (6 mg/kg)). Consecutive blood samples from all animals were taken from anaesthetized animals sublingually (for animals dosed with drugPGLALA and drugPGLALA ICs) or using a jugular catheter (for animals dosed with drugWT and drugWT ICs) pre-dose, as well as after 5 min, 0.5, 1, 4, 8, 24, 48 and 72 hr. For serum generation, blood samples were allowed to clot at r.t. for 15 to 30 min in serum activator-coated tubes; serum was harvested following centrifugation (5,000 rpm, 10 min, 4°C) and stored at −80°C. If blood plasma should be collected, one-third of the blood was prepared in test tubes coated with Li/Heparin and centrifuged for 3 min at 12,000 rpm at 4°C and stored at −80°C.
Total drug concentration: Acid dissociation ELISA
Collected serum or plasma samples were thawed and kept at r.t. as short as possible. The general procedure of the acid dissociation ELISA was described previously.Citation11 In short, serum or plasma study samples were diluted 100-fold in PBS and 0.5% BSA (assay buffer I), 1,000-fold in assay buffer I with 1% rat serum/plasma, and 3,000-fold in assay buffer I with 1% rat serum/plasma to achieve a final concentration of 1% serum or plasma in every dilution. Aliquots of remaining dosing solutions were diluted 100,000-fold in assay buffer I with 1% rat serum/plasma to reach a final concentration of the drug of ~20 ng/ml. QCs of monomeric drug (30,000; 15,000; and 750 ng/ml) were prepared in 100% rat serum or plasma. IC-QCs (drug fully complexed with the appropriate ADAs in a 1:1.5 ratio) were prepared in 100% serum or plasma and incubated for at least 1 hr at r.t. at 450 rpm (30,000; 15,000; and 750 ng/ml drug concentration). Before usage, QCs and IC-QCs were diluted 100-fold in assay buffer I. Calibrators (monomeric drug) were serially diluted in assay buffer I with 1% serum or plasma in a concentration range between 375 and 0.51 ng/ml. Diluted study samples, dosing solutions, QCs, and IC-QCs as well as the calibrators were treated with acid before addition of the capture and detection reagents (in duplicates). The further process, as well as the capture and detection reagents used, were described previously.Citation11
SEC and acid dissociation ELISA of serum samples: Reconstruction of IC profiles in study samples
20 µl of serum samples from animals dosed with ICs were separated by SEC and reconstituted by acid dissociation ELISA. The detailed procedure was described previously.Citation11 In short, 20 µl of study serum samples were centrifuged and injected, separated, and fractionated via an Dionex UltiMate 3000 system with a Waters SEC column (see also Generation and characterization of dosing solutions). Collection plates (96 well) were pre-filled with a highly concentrated BSA solution (0.5% BSA final) to avoid unspecific binding or aggregation of fractionated proteins. Fractions of 250 µl were collected every 30 sec. If necessary, fractions were diluted 1:1 with PBS, 5% ethanol and 0.5% BSA (assay buffer II) to strike the calibration range. Unfractionated study samples were diluted 3,000-fold in assay buffer II. For QC, IC-QC, and calibrator preparation as well as the further process please see above and in the previous publication.Citation11 The performance of the SEC column was tested regularly with commercially available SEC standards.
Data evaluation
Drug clearance was calculated with the PK evaluation program Phoenix WinNonlin 6.4 (Phoenix®). PK data was fitted to a 2-compartment model for intravenous bolus injection by statistical method.
Supplemental Material
Download MS Word (755.7 KB)Acknowledgments
We thank Peter Schrag, Marie-Stella Gruyer, Veronique Dall’Asen, and Christelle Rapp for their experimental in vivo support. We thank Jamal Abu Tarbush for the preparation of in vivo-suitable antibodies and Uwe Dahl, Miriam Moheysen-Zadeh, Claudia Bruecklmayr, and Kristina Bichler for their lab support. We want to acknowledge Nuvisan GmbH for their support of some of the in vivo studies. We want to acknowledge Julia Heinrich for project support (all current or former Roche employees).
Disclosure statement
This project was funded by Roche Diagnostics GmbH. E. Opolka-Hoffmann received a grant from Roche Diagnostics GmbH during her employment at the LMU Munich. E. Opolka-Hoffmann, G. Jordan. M. Lechmann, Robin Kieferle and R. F. Staack are employees of Roche Diagnostics GmbH, Penzberg. M. Otteneder is employee of Hoffmann-La Roche AG. Basel. Some authors are owners of Roche bonus shares and profit certificates.
Supplementary material
Supplemental data for this article can be accessed on the publisher’s website
Additional information
Funding
References
- Krishna M, Nadler SG. Immunogenicity to biotherapeutics - the role of anti-drug immune complexes. Front Immunol. 2016;7:21. doi:10.3389/fimmu.2016.00021.
- Stubenrauch K, Kunzel C, Vogel R, Tuerck D, Schick E, Heinrich J. Epitope characterization of the ADA response directed against a targeted immunocytokine. J Pharm Biomed Anal. 2015;114:296–11. doi:10.1016/j.jpba.2015.05.029.
- Harding FA, Stickler MM, Razo J, DuBridge RB. The immunogenicity of humanized and fully human antibodies: residual immunogenicity resides in the CDR regions. MAbs. 2010;2(3):256–65. doi:10.4161/mabs.2.3.11641.
- Ritter G, Cohen LS, Williams C Jr., Richards EC, Old LJ, Welt S. Serological analysis of human anti-human antibody responses in colon cancer patients treated with repeated doses of humanized monoclonal antibody A33. Cancer Res. 2001;61:6851–59.
- Cassinotti A, Ardizzone S, Porro GB. Adalimumab for the treatment of Crohn’s disease. Biologics. 2008;2:763–77.
- Ponce R, Abad L, Amaravadi L, Gelzleichter T, Gore E, Green J, Gupta S, Herzyk D, Hurst C, Ivens IA, et al. Immunogenicity of biologically-derived therapeutics: assessment and interpretation of nonclinical safety studies. Regul Toxicol Pharmacol. 2009;54(2):164–82. doi:10.1016/j.yrtph.2009.03.012.
- Chirmule N, Jawa V, Meibohm B. Immunogenicity to therapeutic proteins: impact on PK/PD and efficacy. AAPS J. 2012;14(2):296–302. doi:10.1208/s12248-012-9340-y.
- Heinrich J, Staack RF, Stubenrauch KG, Papadimitriou A. Proposal for a harmonized descriptive analyte nomenclature for quantitative large-molecule bioanalysis. Bioanalysis. 2015;7(24):3057–62. doi:10.4155/bio.15.218.
- Salimi-Moosavi H, Lee J, Desilva B, Doellgast G. Novel approaches using alkaline or acid/guanidine treatment to eliminate therapeutic antibody interference in the measurement of total target ligand. J Pharm Biomed Anal. 2010;51(5):1128–33. doi:10.1016/j.jpba.2009.11.021.
- van Schouwenburg PA, Bartelds GM, Hart MH, Aarden L, Wolbink GJ, Wouters D. A novel method for the detection of antibodies to Adalimumab in the presence of drug reveals “hidden” immunogenicity in rheumatoid arthritis patients. J Immunol Meth. 2010;362(1–2):82–88. doi:10.1016/j.jim.2010.09.005.
- Hoffmann E, Jordan G, Lauer M, Ringler P, Kusznir EA, Rufer AC, Huber S, Jochner A, Winter G, Staack RF, et al. Generation, characterization, and quantitative bioanalysis of Drug/Anti-drug antibody immune complexes to facilitate dedicated in vivo studies. Pharm Res. 2019;36(9):129. doi:10.1007/s11095-019-2661-0.
- van Schie KA, Kruithof S, Ooijevaar-de Heer P, Derksen NI, van de Bovenkamp FS, Saris A, Vidarsson G, Bentlage AE, Jiskoot W, Romeijn S, Koning RI. Restricted immune activation and internalisation of anti-idiotype complexes between drug and antidrug antibodies. Ann Rheum Dis. 2018;77(10):1471–79. doi:10.1136/annrheumdis-2018-213299.
- Rojko JL, Evans MG, Price SA, Han B, Waine G, DeWitte M, Haynes J, Freimark B, Martin P, Raymond JT, et al. Formation, clearance, deposition, pathogenicity, and identification of biopharmaceutical-related immune complexes: review and case studies. Toxicol Pathol. 2014;42(4):725–64. doi:10.1177/0192623314526475.
- Finbloom DS, Plotz PH. Studies of reticuloendothelial function in the mouse with model immune complexes. II. Serum clearance, tissue uptake, and reticuloendothelial saturation in NZB/W mice. J Immunol. 1979;123:1600–03.
- Plotz PH, Kimberly RP, Guyer RL, Segal DM. Stable model immune complexes produced by bivalent affinity labeling haptens: in-vivo survival. Mol Immunol. 1979;16(9):721–29. doi:10.1016/0161-5890(79)90013-0.
- Rojas JR, Taylor RP, Cunningham MR, Rutkoski TJ, Vennarini J, Jang H, Graham MA, Geboes K, Rousselle SD, Wagner CL, et al. Formation, distribution, and elimination of infliximab and anti-infliximab immune complexes in cynomolgus monkeys. J Pharmacol Exp Ther. 2005;313(2):578–85. doi:10.1124/jpet.104.079277.
- Schlothauer T, Herter S, Koller CF, Grau-Richards S, Steinhart V, Spick C, Kubbies M, Klein C, Umaña P, Mössner E, et al. Novel human IgG1 and IgG4 Fc-engineered antibodies with completely abolished immune effector functions. Protein Eng Des Sel. 2016;29(10):457–66. doi:10.1093/protein/gzw040.
- Johansson A, Erlandsson A, Eriksson D, Ullén A, Holm P, Sundström BE, Roux KH, Stigbrand T. Idiotypic-anti-idiotypic complexes and their in vivo metabolism. Cancer. 2002;94(4 Suppl):1306–13. doi:10.1002/cncr.10301.
- Chappel MS, Isenman DE, Everett M, Xu YY, Dorrington KJ, Klein MH. Identification of the Fc gamma receptor class I binding site in human IgG through the use of recombinant IgG1/IgG2 hybrid and point-mutated antibodies. Proc Natl Acad Sci U S A. 1991;88(20):9036–40. doi:10.1073/pnas.88.20.9036.
- Lo M, Kim HS, Tong RK, Bainbridge TW, Vernes J-M, Zhang Y, Lin YL, Chung S, Dennis MS, Zuchero YJY, et al. Effector-attenuating substitutions that maintain antibody stability and reduce toxicity in mice. J Biol Chem. 2017;292(9):3900–08. doi:10.1074/jbc.M116.767749.
- Klein C, Schaefer W, Regula JT. The use of CrossMAb technology for the generation of bi- and multispecific antibodies. MAbs. 2016;8(6):1010–20. doi:10.1080/19420862.2016.1197457.
- Regula JT, Lundh von Leithner P, Foxton R, Barathi VA, Cheung CMG, Bo Tun SB, Wey YS, Iwata D, Dostalek M, Moelleken J, et al. Targeting key angiogenic pathways with a bispecific Cross MAb optimized for neovascular eye diseases. EMBO Mol Med. 2016;8(11):1265–88. doi:10.15252/emmm.201505889.
- Immunogenicity testing of therapeutic protein products – developing and validating assays for anti-drug antibody detection. Guidance for industry. U.S. Food and Drug Administration; 2019. https://www.fda.gov/regulatory-information/search-fda-guidance-documents/immunogenicity-testing-therapeutic-protein-products-developing-and-validating-assays-anti-drug
- Guideline on Immunogenicity assessment of therapeutic proteins. European Medicines Agency; 2017. https://www.ema.europa.eu/en/documents/scientific-guideline/guideline-immunogenicity-assessment-therapeutic-proteins-revision-1_en.pdf.
- Lovdal T, Andersen E, Brech A, Berg T. Fc receptor mediated endocytosis of small soluble immunoglobulin G immune complexes in Kupffer and endothelial cells from rat liver. J Cell Sci. 2000;113(Pt 18):3255–66. doi:10.1242/jcs.113.18.3255.
- Bogers WM, Stad RK, Janssen DJ, van Rooijen N, Van Es LA, Daha MR. Kupffer cell depletion in vivo results in preferential elimination of IgG aggregates and immune complexes via specific Fc receptors on rat liver endothelial cells. Clin Exp Immunol. 1991;86(2):328–33. doi:10.1111/j.1365-2249.1991.tb05818.x.
- Johansson AG, Lovdal T, Magnusson KE, Berg T, Skogh T. Liver cell uptake and degradation of soluble immunoglobulin G immune complexes in vivo and in vitro in rats. Hepatology. 1996;24:169–75.
- Mousavi SA, Sporstol M, Fladeby C, Kjeken R, Barois N, Berg T. Receptor-mediated endocytosis of immune complexes in rat liver sinusoidal endothelial cells is mediated by FcgammaRIIb2. Hepatology. 2007;46(3):871–84. doi:10.1002/hep.21748.
- Farber DL, Giorda R, Nettleton MY, Trucco M, Kochan JP, Sears DW. Rat class III Fc gamma receptor isoforms differ in IgG subclass-binding specificity and fail to associate productively with rat CD3 zeta. J Immunol. 1993;150:4364–75.
- Boltz-Nitulescu G, Bazin H, Spiegelberg HL. Specificity of fc receptors for IgG2a, IgG1/IgG2b, and IgE on rat macrophages. J Exp Med. 1981;154(2):374–84. doi:10.1084/jem.154.2.374.
- Wang G, de Jong RN, van den Bremer ET, Beurskens F, Labrijn A, Ugurlar D, Gros P, Schuurman J, Parren PHI, Heck AR, et al. Molecular basis of assembly and activation of complement component C1 in complex with immunoglobulin G1 and antigen. Mol Cell. 2016;63(1):135–45. doi:10.1016/j.molcel.2016.05.016.
- Diebolder CA, Beurskens FJ, de Jong RN, Koning RI, Strumane K, Lindorfer MA, Voorhorst M, Ugurlar D, Rosati S, Heck AJR, et al. Complement is activated by IgG hexamers assembled at the cell surface. Science. 2014;343(6176):1260–63. doi:10.1126/science.1248943.
- Staack RF, Stracke JO, Stubenrauch K, Vogel R, Schleypen J, Papadimitriou A. Quality requirements for critical assay reagents used in bioanalysis of therapeutic proteins: what bioanalysts should know about their reagents. Bioanalysis. 2011;3:523–34.