
ABSTRACT
With the aim of increasing protein productivity of Chinese hamster ovary (CHO) cells, we sought to generate new CHO hosts with favorable biomanufacturing phenotypes and improved functionality. Here, we present an innovative approach of enriching the CHO host cells with a high mitochondrial membrane potential (MMP). Stable transfectant pools and clonal cell lines expressing difficult-to-express bispecific molecules generated from the MMP-enriched host outperformed the parental host by displaying (1) improved fed-batch productivity; (2) enhanced long-term cell viability of pools; (3) more favorable lactate metabolism; and (4) improved cell cloning efficiency during monoclonal cell line generation. Proteomic analysis together with Western blot validation were used to investigate the underlying mechanisms by which high MMP influenced production performance. The MMP-enriched host exhibited multifaceted protection against mitochondrial dysfunction and endoplasmic reticulum stress. Our findings indicate that the MMP-enriched host achieved an overall “fitter” phenotype that contributes to the significant improvement in biomanufacturing capability.
Introduction
Improving recombinant protein manufacturing using Chinese hamster ovary (CHO) host cells is a major challenge for biopharmaceutical companies. The phenotypic and genotypic variations within the CHO host population are known to contribute to their versatility in growth, metabolism, and biosynthetic capacity.Citation1,Citation2 The host cell heterogeneity, together with random integration of expression vectors into the host genome, result in recombinant cell lines that express proteins with varying productivity and product quality profiles. Therefore, development of cell lines for biotherapeutic protein production requires extensive screening of heterogeneous transfectant populations to identify and isolate high-producing cells. Obtaining a host cell line that exhibits a more homogeneous biomanufacturing phenotype would significantly improve the efficiency of the cell line development process.
Protein productivity is dependent on various pathways that reflect the physiological state of the cell. Thus, a variety of cell engineering techniques targeting apoptosis,Citation3–6 metabolic pathways,Citation7,Citation8 protein synthesis machineryCitation9,Citation10 and secretory capacityCitation11,Citation12 have been used to generate new CHO cell lines with robust and improved protein production phenotypes. However, the benefits of engineering individual target genes or pathways are not consistently observed in different cell lines and it is highly likely that the generation of an optimal cell line will require intervention in multiple cellular pathways.
As an alternative approach to genetic engineering, various adaptation strategies have been used to improve the functionality of CHO cells. Exploiting the ability of CHO cells to adapt to different culture conditions, host cells with superior characteristics were isolated by evolving cells in the presence of physical or chemical stresses that can select for desired properties. Bort et al. have described a method in which CHO cells were sequentially cultured in medium containing reduced levels of glutamine, which resulted in evolved cells with the desirable bioprocessing characteristic of growing in glutamine-free medium.Citation13 Prentice and coworkers selected DG44 host cells for their ability to survive in fed-batch bioreactor conditions, leading to increased peak cell density and the ability to grow in the absence of growth factors.Citation14 Isolation of cell populations capable of enhanced hypothermic growth while maintaining high‐specific productivity was described by Sunley and colleagues.Citation15 Improved subcloning performance and enhanced growth behavior were reported using single-cell sorting as the evolutionary pressure.Citation16 Adaptation of an IgG-producing CHO cell line to endoplasmic reticulum (ER) stress by continuous culturing under increasing concentration of tunicamycin resulted in higher productivity due to increased ER capacity.Citation17 Recently, Mistry et al. described evolution of CHO host cells in the presence of hydrogen peroxide to generate oxidative stress-resistant host cells that showed improved expression of difficult-to-express (DTE) proteins.Citation18
Mitochondria, the powerhouse of the cell, have been the prime focus for evolutionary studies in a number of species.Citation19 Dhiman et al. investigated the genetic and epigenetic variations across mitochondrial- and nuclear-encoded genes involved in energy metabolism of CHO cells and identified phenotype‐specific biomarkers that distinguish cells with high productivity.Citation20 Previously, we determined a positive correlation between recombinant protein production and the mitochondrial membrane potential (MMP) status of the producer cells, and that cell sorting based on an optimal MMP staining intensity selectively enriches for higher producing clones from heterogeneous transfectant pools.Citation21 We have also shown that CHO host cells display a broad range of MMP reflecting their natural diversity,Citation21 while a study by Kelly et al. indicated that mitochondrial heteroplasmy in CHO cells could contribute to the clonal variation observed for productivity.Citation22 These observations raise the possibility that high MMP properties contributed by the progenitor host cells may provide a more homogeneous cellular environment needed for high levels of recombinant protein production. Therefore, we reasoned that enriching the heterogeneous CHO host population for high MMP cells may improve the frequency of creating high-producing cell lines following transfection.
Here, we show a straightforward yet innovative method to isolate a host cell subpopulation that exhibits superior capability for protein production. The CHO host cells were stained with an MMP-specific fluorescent dye and enriched for high MMP using fluorescence-activated cell sorting (FACS). We found significant improvement in the growth properties, productivity, product quality, lactate metabolism, and subcloning performance of the transfectant non-clonal pools and recombinant clones generated from the MMP-enriched host. In order to investigate the mechanisms underlying the improved performance of these cells, a comparative proteomic study was performed. Since the mitochondrial proteome comprises nearly a thousand proteins, most of which are imported from the cytosol,Citation23 it is conceivable that the functions of mitochondria are dependent on communication between the cytosol and different mitochondrial compartments.Citation24 Therefore, a large-scale quantitative proteomic survey involving multiplexing and high-resolution mass spectrometry (MS) was performed with multiple biological replicates to confidently identify subtle changes between parental CHO and MMP-enriched hosts, thereby pinpointing cellular pathways important to increased antibody production.Citation25 The proteomic data together with Western blot analysis demonstrated alteration of several mitochondrial and ER-associated proteins having functional attributes that can affect the biomanufacturing capability of a host.
Materials and methods
Cell culture and stable transfections
A suspension-adapted, proprietary CHO cell line derived from CHO-K1 and a glutamine synthetase selection system was used. Stable transfectant pools were generated by nucleofection of linearized expression plasmids and then selected and maintained in proprietary medium supplemented with 75 µM methionine sulfoximine (Sigma-Aldrich, MO), and 50 mg/L dextran sulfate (Sigma-Aldrich). Suspension cell cultures were grown at 120 rpm on an orbital shaking platform in a humidified incubator set at 37°C and 6% CO2. Cells were passaged every 3–4 days. Measurement of viable cell density and viability was accomplished using Trypan Blue and a ViCell automated cell counter (Beckman Coulter, CA).
Fed-batch culture at small scale
Antibody production was evaluated by fed-batch culture in 125-mL Erlenmeyer flasks or 96-deep well (96DW) plates. The production cultures grew at 35.5°C in a humidified 6% CO2 atmosphere for 14 days unless otherwise mentioned. Shaker speed was maintained at 120 rpm for flasks and 350 rpm for 96DW. Cell density and viability were monitored during cultivation in flasks, but not for the 96DW cultures. Proprietary feed was added periodically to the production cultures. Antibody titers in the culture supernatant were determined using Protein A biosensors in an Octet QK384 (Pall ForteBio, Fremont, CA) for 96DW and by HPLC (Agilent Technologies, CA) for flask cultures.
Fed-batch culture in bioreactors
The producer cells were cultured in duplicate 3 L glass stirred-tank bioreactors in fed-batch as previously described.Citation26 Cells were cultured under conditions representative of large-scale manufacturing processes. Temperature of 35.5°C, 300 rpm agitation rate, 50% dissolved oxygen and 7.0 ± 0.1 pH were monitored and regulated using DASGIP controller software (Eppendorf, Germany). Proprietary feed was added to each bioreactor periodically during the run. Fresh cell samples were collected every day for subsequent process analysis and biochemical assays. Offline pH, gases (pCO2 and pO2), lactate, and glucose levels were analyzed using a RAPIDPOINT 500 Blood Gas Analyzer (Siemens, PA). Viable cell density and cell viability were determined using a ViCell. Osmolality and ammonium were measured using a Flex2 (Nova Biomedical, MA). Antibody levels from each bioreactor were quantified using Protein A binding on an HPLC.
Flow cytometric analysis of mitochondrial membrane potential
Status of cellular MMP was analyzed using the dual fluorescent emission dye Mito-ID (Enzo Life Sciences, NY). Cells were stained with Mito-ID dye according to the manufacturer’s directions. Briefly, 1 × 10⁶ cells were harvested by centrifugation at 300 × g for 5 min, washed with a 1x Mito-ID assay solution and resuspended in Mito-ID detection reagent at a concentration of 1 × 10⁶ cells/mL. The cells were stained for 30 min in the dark at room temperature and analyzed using a BD Symphony cytometer (BD Biosciences, CA). The 488 nm laser was used for excitation, and 525/50 and 582/15 filters were used to acquire green and orange emitted fluorescence, respectively. Bivariate plots of green versus orange fluorescence as well as univariate histogram plots of orange fluorescence were used to analyze MMP. The orange fluorescent population represents energized cells with active MMP. Data analysis was performed using FlowJo software (BD Biosciences).
Cell sorting
Bulk cell sorting based on MMP for host enrichment and single-cell deposition for recombinant clone generation were performed using an Influx cell sorter (BD Biosciences) as described previously.Citation21 For the bulk sort, 5 × 10⁷ cells were harvested by centrifugation. The cells were washed and stained with Mito-ID dye as described above. Based on orange fluorescence intensity, 2 × 10⁶ cells from gated fractions were deposited in 5 mL collection tubes containing culture medium. The sorted cells were centrifuged, resuspended in 10 mL fresh culture medium, and plated in a T-75 flask. Following subculture and expansion, the sorted cells were stained with Mito-ID, and the subpopulation displaying the peak intensity of MMP staining was isolated using FACS by deposition of five cells per well into individual wells of 96-well plates. For single-cell cloning, 1 × 10⁶ cells were sorted by depositing one cell per well into individual wells of 384-well plates containing conditioned medium.Citation27 All plates were incubated at 37°C in a humidified atmosphere with 6% CO2 for outgrowth.
Colony outgrowth measurement
Confluence per well in 384-well plates was measured using a Cellavista imager (Synentec, Germany) and results analyzed using Nyone software (Synentec, Germany).
Aggregate analysis
The fed-batch culture products were captured by analytical Protein A column (POROS A, Thermo Fisher Scientific, MA) using an Agilent 1260 HPLC (Agilent, CA) equipped with a fraction collector. Phosphate-buffered saline (PBS) was used for the capturing step, and acidified PBS (with 0.1% phosphoric acid) was used for elution. The purified bispecific antibodies were then analyzed by size-exclusion chromatography (SEC) for aggregation levels using an ACQUITY UPLC SEC-200 column (Waters, MA) on the same Agilent 1260 HPLC. The SEC mobile phase was 0.1 M sodium phosphate, 0.1 M sodium sulfate pH 6.8. The flow rate was set at 0.3 mL/min and the separation was monitored at 280 nm.
Peptide mapping
Purified protein products were denatured and reduced at 37°C for 30 min with buffer containing guanidine hydrochloride and dithiothreitol. Samples were then alkylated by iodoacetamide at room temperature in the dark for 30 min. Buffer exchange was performed for each sample with microdialysis cassettes. After buffer exchange, trypsin was added to samples for digestion at the mass ratio of 1:12 (trypsin:protein). The samples were incubated at 37°C for 4 h with trypsin before being quenched by trifluoroacetic acid. Acquity ultraperformance liquid chromatography (UPLC) (Waters) coupled with a Fusion mass spectrometer (Thermo Fisher Scientific) were used for peptide separation and mass measurement. Byos (Protein Metrics, San Carlos, CA) software was used for database searching and post translational modification quantification.
Determination of mitochondrial mass
Mitochondrial mass was determined using NAO (Thermo Fisher Scientific, MA), a dye that binds to the inner mitochondrial membrane independent of the membrane potential.Citation28 Cells were incubated at a concentration of 1 × 10⁶ cells/mL with 500 nM NAO for 10 min in the dark at room temperature, washed twice with cold PBS, and immediately analyzed on a BD Symphony cytometer using a 488 nm laser for excitation and a 525/50 filter for emission. Data analysis was performed using FlowJo software.
Confocal microscopy
All fluorescent images were taken on a LSM880 Airyscanner confocal microscope (Carl Zeiss Inc., Germany). Using 40 × 1.2NA Water objective, z-stack images of Mito-ID-stained cells were acquired from 30 optical sections spaced 0.4 µm apart. Track one used the 488 nm laser with a 495–550 nm emission filter, while track two used a 561 nm laser with a 570–620 nm emission filter.
Intracellular staining for antibody expression level
Intracellular expression of the heavy and light chains of antibody molecules was determined by staining cells with fluorescently labeled antibodies specific for heavy or light chains. Briefly, the cells were centrifuged, washed with FACS buffer (1% fetal bovine serum in PBS), and fixed with Fixation Medium A (Thermo Fisher Scientific) for 15 min at room temperature. Next, the cells were washed with FACS buffer and stained for 15 min at room temperature with the staining solution composed of goat anti-human IgG (Fc)-Alexa Fluor 488 (Cat# H10120, Thermo Fisher Scientific) and goat anti-human kappa-APC (Cat# 316510) or lambda-APC (Cat# 316610) (Biolegend, CA) in Permeabilization Medium B (Thermo Fisher Scientific). The stained cells were washed and resuspended in FACS buffer before analyzing in a BD Symphony cytometer for the APC and AF488 double-positive population. Data analysis was performed using FlowJo software.
Flow cytometric analysis of intracellular ROS, mitochondrial superoxide and apoptosis
Relative intracellular changes in ROS, mitochondrial superoxide, and apoptosis in bioreactor fed-batch cell samples were detected using flow cytometry according to manufacturer’s instruction and as previously described.Citation29,Citation30 Briefly, 1 × 10⁶ cells were harvested from bioreactors by centrifugation at 300 × g for 5 min. Cells were washed with either HBSS for ROS and mitochondrial superoxide or 1x antibody binding buffer for apoptosis. Cells were then stained with either CellRox Green (Thermo Fisher Scientific), or MitoSox Red (Thermo Fisher Scientific) or AnnexinV-APC plus propidium iodide (BD Biosciences) for 20 min at room temperature in the dark. Stained cells were analyzed using BD Symphony cytometer. Data analysis was performed using FlowJo software.
Western blotting
Mitochondria were isolated using a Mitochondria Isolation Kit (ThermoFisher Scientific, MA) following the manufacturer’s instructions. Protein extracts were prepared by lysing whole cells and isolated mitochondria in RIPA buffer (ThermoFisher) containing Halt Protease and Phosphatase Inhibitor Cocktail (ThermoFisher), followed by protein concentration measurement using a Pierce BCA assay kit (ThermoFisher). Western blot analysis was performed using a WES system (Protein Simple, CA) with a 12–230 kDa (25 well cartridge) separation module. All samples were diluted to a final loading concentration of 0.4 μg/μL and equal amounts of total protein (2 μg) were loaded for each sample. The instrument settings included separation at 375 V for 25 min, blocking for 30 min, primary and secondary antibody incubation 30 min each and chemiluminescence detection for 15 min. The primary antibodies used were rabbit anti-GAS7 (Cat# ab168370), PINK1 (Cat# ab23707), beta-actin (Cat# ab8227) purchased from Abcam, MA, Mfn2 (Cat# PA5-79666) and mGPDH (Cat# PA5-93093) purchased from ThermoFisher, phospho-Mfn2 (Cat# ABC963) purchased from EMD Millipore, MA, phospho-Ser65-Parkin (Cat# orb312554) purchased from Biorbyt, MO, PERK (Cat# 3192), BiP (Cat# 3183), PDI (Cat# 3501) purchased from Cell Signaling Technology, MA and mouse anti-succinate dehydrogenase subunit A (SDHA) (Cat# ab14715) purchased from Abcam. Horseradish peroxidase-conjugated goat anti-rabbit (Cat# ab6721) and goat anti-mouse (Cat# ab6789) purchased from Abcam were used as secondary antibodies. Beta-actin and SDHA were used as loading controls.
Statistical analysis
Data are presented as mean ± SD. Comparisons of mean differences between groups were made by unpaired two-tailed Student’s t-test unless otherwise stated. A probability level of p < 0.05 was considered to be statistically significant.
Proteomic analysis
Preparation of proteomic samples: CHO and MMP-enriched host cells were lysed and trypsin digested using S-TRAP as previously described.Citation31,Citation32 Peptides were labeled with 6-plex TMT (Thermo Fisher Scientific) according to manufacturer’s instructions (Figure S7 and Supplementary Methods).
LC-MS/MS analysis: Data-dependent acquisition analyses were carried out on a Q-Exactive HF-X mass spectrometer as previously described.Citation31,Citation33
Data analysis: Tandem mass spectrometry data were searched against Uniprot Cricetulus griseus database (Oct 2020) containing 56,400 protein sequences including common laboratory contaminants using Mascot 2.7.0.0 search engine (Matrixscience.com) integrated in Proteome Discoverer (v 2.4, Thermo Scientific) software. The search criteria used were the same as described in previous report.Citation34
Bioinformatics analysis
Raw protein abundance values were normalized to the median intensity of each TMT channel. Differential abundance analysis was performed using the Limma Bioconductor package (R version 3.6.0).Citation35 The p-values were adjusted via the Benjamini–Hochberg method. The volcano plot was created with the ggplot2 R package (R version 3.6.0).Citation36 Pathway enrichment analysis was performed using Ingenuity Pathway Analysis (IPA) software (Qiagen).
Sequence alignment and machine learning
Every protein sequence in the Chinese hamster proteome was aligned against every protein sequence in the mouse proteome using the pairwise2 module from the Biopython package (Python version 3.7.4).Citation37 A logistic regression model was developed to predict functional homology based on percent sequence identity. The model was trained and cross-validated using the scikit-learn Python module (Python version 3.7.4).Citation38 The trained model was used to assign homologs to each CHO protein (Supplementary Methods).
Results
Generation of a novel CHO host cell line by MMP enrichment
Leveraging the flow cytometric staining method for monitoring MMP in living cells and using our previously described method of MMP-based cell sorting,Citation21 we isolated a high MMP subpopulation from CHO host cells stained with Mito-ID, an MMP dye. Two rounds of sorting by FACS were performed () to ensure stable enrichment of the host population exhibiting high MMP. In the first step, the subpopulation displaying the peak intensity of MMP staining was isolated by bulk sorting, and the resulting cells were subcultured for 2 weeks. Following recovery, evaluation of the MMP capacity of the sorted cells showed partial enrichment of the high MMP population (68% in the sorted cells compared to 29% in the original host cells, ). The likelihood of a phenotypic drift due to the heterogeneity of the sorted population, prompted us to execute a second round of sorting into a 96-well plate. As before, the subpopulation displaying the peak intensity of MMP staining was gated and isolated by depositing five cells per well in a 96-well plate (). After 2 weeks, 72 wells with colonies that had reached >20% confluence were scaled-up into wells of a 96DW plate and expanded for 1 week. Evaluation of the 72 cultures displayed varied MMP status ranging between 40% and 96% (Supplementary Figure S1). Eleven cultures exhibiting >92% homogeneity of the high MMP phenotype (Supplementary Figure S1) were pooled together to generate the MMP-enriched host cell (). Confocal microscopic imaging of the Mito-ID-stained parental CHO and MMP-enriched hosts validated their respective MMP phenotypes as indicated by low and high intensity of orange fluorescence, respectivelyCitation21 (). Furthermore, to determine if the MMP enrichment resulted from a difference in the number of mitochondria within each cell, we stained the parental CHO and MMP-enriched hosts with nonyl acridine orange (NAO) dye to measure mitochondrial mass.Citation28 Flow cytometric analysis revealed no difference in mitochondrial mass per cell among the two host types ().
Figure 1. Generation of an MMP-enriched host. (a) Process of enrichment for a high MMP subpopulation using fluorescence-activated cell sorting (FACS). The dotted box in the histogram plots represents the sorted population. (b) Bivariate plots of green (x-axis) versus orange fluorescence (y-axis) and univariate histogram plots of orange fluorescence depicting Mito-ID dye staining pattern of parental CHO and MMP-enriched hosts. (c) Two representative confocal microscopic images for each of Mito-ID dye-stained parental CHO and MMP-enriched hosts. The orange fluorescence in the cells denotes the energized mitochondria. The process of enrichment of high MMP subpopulation with flow cytometry plots and confocal microscopy images of parental CHO and MMP-enriched hosts validating their MMP phenotypes as indicated by low and high intensity of orange fluorescence of Mito-ID dye, respectively.
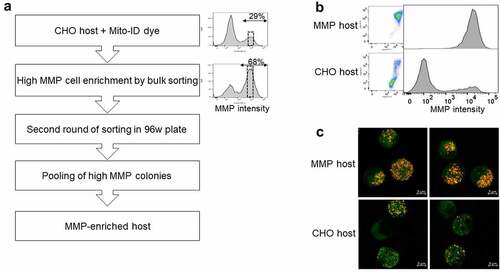
Figure 2. Phenotype of MMP-enriched host. (a) Histogram plots of mitochondrial mass determined by nonyl acridine orange (NAO) staining followed by flow cytometric analysis. (b) Flow cytometric analysis of the stability of the MMP trait of the MMP-enriched host over generations. Bivariate plots of green (x-axis) versus orange fluorescence (y-axis) and univariate histogram plots of orange fluorescence depicting Mito-ID dye staining pattern. PDL: Population doubling level. (c) Flow cytometric analysis of the MMP trait of the parental CHO and MMP-enriched hosts on days 3 (PDL 10 for CHO and 11 for MMP), 5 (PDL 12 for CHO and 14 for MMP) and 7 (PDL 14 for CHO and 16 for MMP) following subculture. Flow cytometric analyses of mitochondrial mass of parental CHO and MMP-enriched hosts and stability of the high MMP trait of MMP host cells over 109 generations and following subculture.
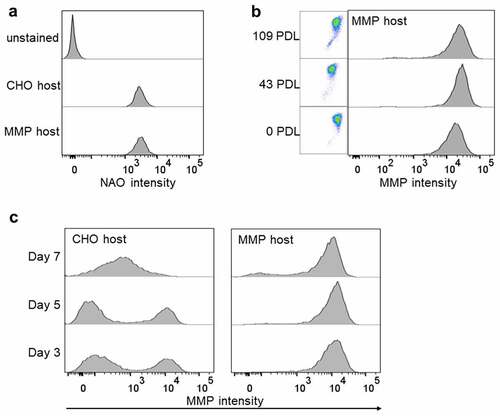
To determine the stability of the high MMP trait, the enriched host was continuously expanded for 109 generations or population doubling levels (PDL) and their MMP status was evaluated using Mito-ID staining. We found that the enriched host population, even after extended culture, maintained a homogeneous, high MMP phenotype similar to that of the original pool of enriched colonies (99% at 0 PDL to 95% at 109 PDL, ), suggesting that our enrichment strategy is fundamentally effective in creating a phenotypically stable host cell line. Interestingly, although it is well documented that the inherent plasticity of the CHO nuclear and mitochondrial genome results in continuous genetic and phenotypic drifts in cultured CHO cells with recombinant production load,Citation39,Citation40 it may be possible that host cells with no production load have a more stable genome and, hence, are less likely to undergo phenotypic drift. The status of MMP at different growth phases of culture was also elucidated by measuring MMP staining intensity at days 3, 5 and 7 following subculture. We found that the MMP-enriched host maintained the high MMP phenotype irrespective of the day of culture (), further confirming the consistency of this host phenotype. On the other hand, the parental CHO host displayed a shift in its MMP status at day 7 (), reflecting their phenotypic variability during growth cycle.
Superior performance of an MMP-enriched host in stable transfectant pools
To evaluate the performance of the enriched host, the parental CHO host and the MMP-enriched host were transfected with expression plasmids encoding three different molecules: an easy-to-express mAb (ETE) and two DTE bispecific antibodies (DTE1 and DTE2). The resulting stable transfectant pools were evaluated for fed-batch productivity in shake flasks. For all three molecules, the MMP pools displayed higher integral of viable cells (IVC) () and maintained higher viability than the parental CHO pools (). For ETE, MMP-pools had a 1.9-fold increase in final titer compared to CHO pools (; 2.13 vs. 4.12 g/L, p = .04). The MMP pools also demonstrated a 2.2 and 2.1-fold increase in titer for DTE1 (; 0.58 vs. 1.26 g/L, p < .0001) and DTE2 (; 1.43 vs. 3.01 g/L, p = .0005), respectively, compared to the CHO pools. While the specific productivities of ETE and DTE1 remained unchanged between the CHO and MMP pools (), a significant increase in specific productivity was observed for DTE2 pools derived from MMP-enriched host (, 11.9 vs. 20.5 pg/cell/d, p = .0034).
Figure 3. Fed-batch culture characteristics of stable transfectant pools generated from parental CHO and MMP-enriched hosts. Three molecules with varying degrees of difficulty in expression (ETE, DTE1 and DTE2) were chosen. (a–c) Integral of viable cell density (IVC) of the pools. (d–f) Viability of the pools. (g–i) Harvest titer of the pools. (j–l) Specific productivity (Qp) of the pools. Data represent mean ± standard deviation (SD) (n = 4). *p < .05 by two-tailed Student’s t-test. The integral of viable cell density, viability, harvest titer and specific productivity of the pools in fed-batch culture showing improved performance of the MMP host-derived pools.
To determine the metabolite turnover during the fed-batch process, we measured the glucose consumption and lactate production (pg per cell per day) of the pools throughout the culture period. Although glucose consumption was comparable between the MMP and the CHO pools for all three molecules (), lactate production was found to be lower in the MMP pool cultures than the corresponding CHO pools (), suggesting a link between higher mitochondrial activity and improved lactate metabolism. Previously, Zagari et al. also described a positive correlation between high mitochondrial membrane potential and lactate consumption rate in CHO cells, pointing to a central role of mitochondria on lactate metabolism.Citation41
Figure 4. Metabolic profile of pools expressing ETE, DTE1 and DTE2 in fed-batch cultures. (a–c) Glucose consumption, (d–f) lactate production. Data represent mean ± SD (n = 4). Glucose consumption and lactate production of the pools in fed-batch culture showing reduced lactate production by the MMP host-derived pools.
Intracellular heavy chain (HC) and light chain (LC) protein expression in the pools were investigated to assess whether differences in the percentage distribution of expressing populations could be the cause of the difference in productivity observed between the two hosts. For ETE, the analysis revealed similar expression of HC and LC in both hosts, with 95% HC+LC+ for the CHO and 96% for the MMP-enriched host (Supplementary Figure S2). For DTE1, the CHO host had a slightly smaller HC+LC+ population compared to the MMP-enriched host (Supplementary Figure S2, 83% vs. 92%) and for DTE2, both hosts exhibit similar expression of HC and LC, with 94% HC+LC+ for the CHO (Supplementary Figure S2) and 97% for the MMP-enriched host. Therefore, the significant difference in productivity observed between the two hosts is not due to difference in homogeneity of the expressing populations. Furthermore, a comparison of the MMP status of the pools generated from CHO and MMP-enriched host revealed that high MMP phenotype of the host is profoundly maintained in the stable transfectant pools (), thereby affirming the stability and heritability of the MMP phenotype in the MMP-enriched host.
Figure 5. Representative flow cytometry histogram plots of MMP status of the parental CHO and MMP-enriched host-derived stable pools determined by Mito-ID staining. Flow cytometry plots of the MMP status of the parental CHO and MMP host-derived pools showing that high MMP phenotype of the host is maintained in the pools.
Evaluation of the MMP-enriched host in the cell line development process
Generation of clonal manufacturing cell lines is a crucial step toward ensuring reproducible cell culture performance and generating consistent product quality for biopharmaceuticals. To determine the suitability and applicability of this MMP-enriched host for successful biomanufacturing, we evaluated the performance of clones isolated from the stable pools, focusing on the high aggregate-prone, DTE proteins because any improvements have greater potential impacts and benefits for productivity and product quality compared to ETE molecules. First, we used FACS to deposit single cells into 384-well plates from the pools for the DTE1 and DTE2 transfectants generated from the parental CHO and MMP-enriched hosts. Then, the clones were expanded and evaluated in an automated small-scale productivity and product quality screen in a 96DW format.Citation42 We observed a remarkable improvement in 384-well outgrowth of the clones isolated from the MMP-enriched pools of both molecules compared with the parental CHO host (16% vs. 29% for DTE1 and 16% vs. 26% for DTE2) (). In addition, 96DW titer evaluation revealed a significant increase in the average clonal titer achieved for DTE1 (p = .0016) and DTE2 (p = .0088) generated from the MMP-enriched host compared to the parental host (). The distribution of the titer values indicates an increased frequency of higher producing clones being generated from the MMP-enriched host. We note that the average titer of the MMP clones expressing DTE2 () is lower than the pool titer (). This reduction is likely a reflection of the differing cell growth profiles in the two fed-batch culture systems used, shake flask for the pools and 96DW for the clones (data not shown). Although absolute titer values may not be predictive, the high throughput, small-scale 96DW screening method can be reliably used for identifying and ranking the top producer clones.Citation42 Purified product quality analysis of the fed-batch culture supernatants revealed a significant reduction (p = .004) in the content of high-molecular-weight species (HMWS) in the DTE2 clones generated from MMP-enriched host, with no difference observed for the DTE1 clones ().
Figure 6. Characterization of parental CHO and MMP-enriched host derived clones expressing difficult-to-express molecules (DTE1 and DTE2). (a) Colony outgrowth in 384-well plates 16 day after single cell sorting. (b, c) Harvest titer of the clones after 13 day in fed-batch culture. Each data point represents an individual antibody expressing clone. (d, e) Aggregate levels determined by high-molecular-weight species (HMWS) product analysis. Data in d and e represent mean ± SD (n = 6). ***p = .0016, **p = .004, *p = .0088 by two-tailed Student’s t-test. Colony outgrowth in 384-well plates, clone titers in 96DW fed-batch culture and product aggregate levels showing MMP host-derived clones have improved outgrowth and average titer.
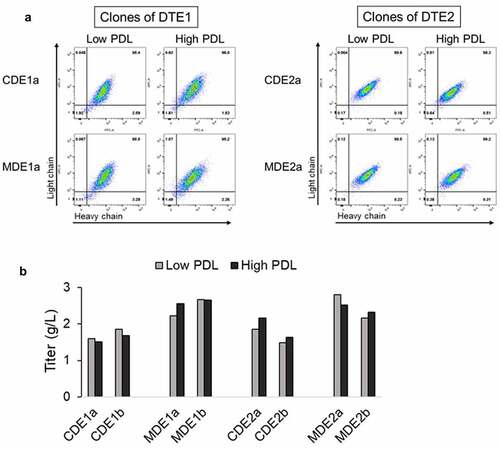
While it is unlikely that high MMP would introduce phenotypic instability into the expressor population beyond what is normally observed, we examined the phenotypic stability of the two highest producing clones for DTE1 and DTE2 by analyzing the intracellular antibody expression and fed-batch titers over 55 PDL. Clones expressing DTE1 and DTE2 derived from parental CHO host (CDE1a, CDE1b and CDE2a, CDE2b, respectively) and MMP-enriched host (MDE1a, MDE1b and MDE2a, MDE2b, respectively) were propagated for 55 PDL. Intracellular expression of light and heavy chains and shake flask fed-batch antibody titers were assessed after 20 (low PDL) and 55 (high PDL) generations in culture. All clones demonstrated consistent intracellular antibody expression () and secreted antibody productivity () irrespective of the PDL number.
Figure 7. Phenotypic stability of parental CHO and MMP-enriched host derived clones after 20 and 55 PDL. (a) Representative flow cytometry plots depicting intracellular transgene expression pattern of the clones expressing DTE1 and DTE2 at low (20) and high (55) PDL. (b) DTE1 and DTE2 expression titers at low and high PDL were determined for the selected clones by 14-day fed-batch culture in shake flasks. Intracellular expression of light and heavy chain and fed-batch titer at low and high PDL of the selected clones expressing DTE1 and DTE2 depicting consistent intracellular antibody expression and secreted antibody productivity irrespective of the PDL number.
Evaluation of the performance of the MMP-enriched clones in a bioreactor environment
To better understand the improved biomanufacturing capability of the MMP host-derived clones over the parental CHO clones, CDE1a, CDE2a, MDE1a and MDE2a clones were cultured for 14 days in 3-L bioreactors under fed-batch conditions representative of large-scale manufacturing processes. Our data demonstrated that MMP host-derived clones MDE1a and MDE2a had a 1.6-fold (2.5 vs. 4.1 g/L, p < .05) and a 1.4-fold (2.7 vs. 3.8 g/L, p < .04) increase in titer, respectively, compared to the corresponding CHO clones (). Similarly, a significant increase in specific productivity was observed for the clones generated from the MMP-enriched host (8.1 pg/cell/d for CDE1a vs. 15.2 pg/cell/d for MDE1a, p < .04 and 9.2 pg/cell/d for CDE2a vs. 14.1pg/cell/d for MDE2a, p < .05) (). While the cell growth pattern (), viability () and glucose consumption () remained similar between the CHO and MMP clones, a more favorable lactate profile was observed for both the MMP clones during the course of the bioreactor run (). The parental CHO clones displayed higher lactate production together with an end-of-run lactate spike (), which reflects a reduced mitochondrial oxidative capacity associated with reduced recombinant protein production in these clones.Citation41 No difference was observed in ammonium level or osmolality between the CHO and MMP clones (Supplementary Figure S3A-D) for the duration of the run. Purified product quality analysis of the bioreactor culture supernatants revealed no significant difference in HMWS content between the MMP and CHO clones (Supplementary Figure S3E-F). Although we observed a significant reduction in HMWS in the MMP host-derived DTE2 clones at the small-scale culture (), it is conceivable that reduced aggregate levels may not be a general benefit of the MMP-enriched host. Nevertheless, taken together the results demonstrate that the cell lines generated from the MMP-enriched host outperformed the parental CHO host at several fundamental stages of the cell line development process.
Figure 8. Evaluation of bioreactor fed-batch cell culture performance for parental CHO clones (CDE1a and CDE2a) and MMP-enriched clones (MDE1a and MDE2a) expressing DTE1 and DTE2. (a, b) Day 14 titers. (c,d) Specific productivity (Qp). (e,f) Viable cell density (VCD). (g,h) Viability. (i,j) Glucose consumed. (k,l) Lactate produced. Data represent mean ± SD (n = 2). *p < .05 by two-tailed Student’s t-test. The titer, specific productivity, viable cell density, viability, glucose consumption and lactate production of the selected clones expressing DTE1 and DTE2 in bioreactor fed-batch culture demonstrating improved performance of the MMP host-derived clones.
Higher MMP has been associated with increased production of reactive oxygen species (ROS), which can have damaging effects on DNA, protein, and lipid.Citation43 The methionine and tryptophan residues of proteins are susceptible to oxidative damage from ROS and these modifications can affect the biological activity of mAbs. To determine if high MMP had any effect on the oxidation of methionine and tryptophan residues, which are common degradation pathways for mAbs, we performed peptide mapping analysis of DTE1 and DTE2 proteins purified from bioreactor cultures. Our results indicate no difference in oxidation of methionine and tryptophan residues in DTE1 and DTE2 produced by either MMP or CHO clones (Supplementary Table 1A and 1B). In addition, we assessed relative changes in intracellular ROS and mitochondrial superoxide levels by flow cytometry in live cells collected at days 3, 7 and 11 of the bioreactor run. Our results showed no significant differences in ROS (Supplementary Figure S4) or mitochondrial superoxide levels (Supplementary Figure S5) between the CHO and MMP host-derived clones expressing DTE1 or DTE2. In addition, no significant differences in the number of apoptotic cells were observed between the clone types during the bioreactor run (Supplementary Figure S6).
Proteomics analysis
In order to establish a comprehensive understanding of the differences in phenotype of the parental CHO and MMP-enriched hosts, we compared their cellular proteomic profiles. Quantitative proteomics using 24 liquid chromatography (LC)-MS/MS analyses derived from the fractionation of multiplexed tandem mass tag (TMT)-labeled protein digests of CHO and MMP-enriched cells resulted in identification of nearly 8,400 protein groups, which is one of the highest number of CHO cell protein profiles reported to date.Citation44 Among the proteins identified, 90% were quantitated using isobaric labeling methods (Supplementary Table 2). One challenge we encountered is that the Chinese hamster proteome is not as well annotated as the proteome of model organisms. Therefore, to improve the annotation, we matched proteins in the Chinese hamster and mouse proteomes by their UniProt protein descriptions. For proteins that could not be matched, we calculated the percent sequence identity of CHO-mouse protein pairs and developed a logistic regression model to distinguish homologs from non-homologs. We validated our model via 10-fold cross validation, and the model achieved an accuracy of over 97% on both the training and validation datasets. The complete list of CHO-mouse protein homologs we identified using our model can be found in Supplementary Table 3.
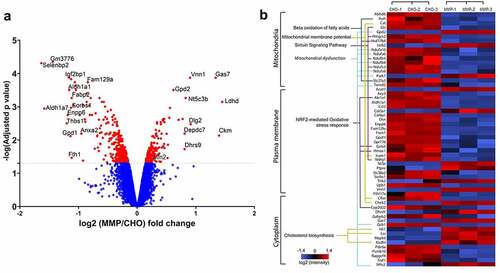
The abundance levels of the proteins involved in mitochondrial function were analyzed and compared between the parental CHO and MMP-enriched hosts. The biological datasets were compared to calculate the “fold-change” and significance by an analysis of variance and the results were graphed as volcano plots (). Here, a protein was considered to be differentially abundant if its fold-change was greater than 1.5 and adjusted p-value was less than 0.05. Compared to parental CHO cells, 12 proteins were significantly upregulated and 44 proteins were significantly downregulated in the MMP-enriched cells (). Biological functions associated with the differentially expressed proteins were determined using the functional feature of the Ingenuity pathway analysis (IPA) ( and supplementary Table 4). The proteomic dataset from each host type was further annotated using Uniprot GO annotation, which includes cellular localization and molecular and biological function. Nearly 1000 mitochondrial-associated proteins were found (Supplementary Table 5). The IPA revealed that several of these proteins are involved in the regulation of transmembrane potential, depolarization, maintenance of morphology, organization and fusion of mitochondria. The heatmap of differentially expressed proteins from this subset are shown in .
Figure 9. (a) Volcano plot showing the expression profile of proteins in parental CHO and MMP-enriched host cells. Dotted line represents the adjusted p value cutoff of 5% false discovery rate (FDR) for quantitation of proteins. Some of the proteins are labeled using their predicted mouse homolog genes. (b) Heat map of differentially expressed proteins was plotted using Perseus software.Citation45 Z-score (the mean of each row subtracted from each value, and the result is divided by the standard deviation) was calculated using the log2 abundances. The proteins were grouped based on their localization and important functional classes obtained from Ingenuity pathway software (Qiagen). Triplicate data from CHO and MMP-enriched hosts are shown. Volcano plot showing the expression profile of proteins in parental CHO and MMP-enriched host cells and heat map of differentially expressed proteins grouped based on their localization and important functional classes.
Select findings of the proteomic assays were confirmed by Western blotting analysis, focusing on three pathways, namely mitofusin-2 (Mfn2), growth arrest-specific protein 7 (GAS7) and mitochondrial glycerol-3-phosphate dehydrogenase (mGPDH or GPD2) pathways that are involved in mitochondrial function and were found to be upregulated in the MMP-enriched host () and transfectant pools (). Mfn2 plays multiple roles in maintaining a healthy mitochondrial network and, hence, ensuring proper energetic and metabolic cellular performance. Mfn2 mediates mitochondrial fusion,Citation46,Citation47 regulates physical contact between mitochondria and ER,Citation48–50 and maintains mitochondrial quality control by eliminating damaged mitochondria via PINK1/p-Parkin mediated mitophagy.Citation51–53 In addition, GAS7 is known to modulate PINK1 function in the regulation of mitochondrial dynamics and metabolism.Citation54 Indeed, we observed increased expression of p-Mfn2, PINK1 and p-Parkin together with Mfn2 and GAS7 in the MMP-enriched host. Furthermore, several studies have indicated the role of Mfn2 as an ER stress regulatory protein and an upstream modulator of PERK.Citation55,Citation56 Ablation of Mfn2 in various cell types has resulted in an upregulation of ER chaperone proteins both at baseline and under ER stress conditions.Citation56 Therefore, we evaluated the parental CHO and MMP-enriched host-derived pools for expression of PERK and ER chaperone proteins, BiP and PDI using Western blot analysis. We observed reduced levels of PERK, BiP and PDI in the MMP-enriched host-derived pools (), which is consistent with the inhibitory role of elevated Mfn2 on ER stress reported in other cell types. Finally, mGPDH, an integral component of mammalian respiratory chain, connects mitochondrial and cytosolic processes and plays a critical role in oxidative phosphorylation, lipid metabolism, and maintenance of mitochondrial membrane potential of a cell.Citation57 Thus, it is possible that upregulation of mGPDH is another mechanism by which the physiological capacity of the MMP-enriched host cells is improved, enabling them to deliver superior protein producing pools and clones. Taken together, these results allowed us to gain more insights into the mechanism of the generation of a “fitter” host cell and provide underlying molecular processes of host cell influence on production performance.
Figure 10. Western blot analysis of mitochondria and ER-associated proteins. (a) Whole cell lysates and mitochondrial lysates of parental CHO and MMP-enriched host cells were analyzed for proteins involved in mitochondrial function and high MMP phenotype. (b and c) Whole cell lysates of stable pools generated from parental CHO and MMP-enriched hosts were analyzed for mitochondrial and ER-stress proteins. Beta-actin and succinate dehydrogenase subunit A were used as loading controls. Western blot analysis of the lysates of host cells and pools demonstrating upregulation of proteins associated with mitochondrial functions and downregulation of ER-stress related proteins in MMP-enriched host cells and pools.
Discussion
The growing demand for therapeutic proteins continuously promotes the development of technologies to increase the production of high-quality recombinant proteins in CHO expression systems. Although there has been substantial improvement in the yield of CHO cell-based production processes in recent years,Citation58–60 the demands of the ever-expanding highly competitive market still require cells to be more highly productive and to be grown in bioreactors at higher cell densities. In this study, a simple yet innovative approach, based on the selection of a cell population with high MMP, led to the establishment of a novel host that inherently exhibits superior attributes for biomanufacturing.
The MMP-enriched host displayed remarkably improved and consistent production capability for three model antibodies examined in this study. Higher IVC, enhanced viability and increased productivity with lower lactate level have been observed in the pools generated from the MMP-enriched host. Furthermore, the high MMP phenotype of the host cell line was found to be retained in the recombinant producer pools, indicating that the MMP trait is stable and heritable. Therefore, the MMP-enriched host provides a unique tool for generation of highly productive, stable, homogeneous pool populations that will enable enhanced early-phase material supply for preclinical toxicology studies and process development activities, thereby potentially accelerating the timelines to the clinic.Citation61 Although regulatory requirements demand clonal cell lines for clinical manufacturing of biologics, use of stable pools for material generation to support early development and non-clinical studies is gaining popularity.Citation62–64
The clones isolated from the MMP-enriched host-derived pools demonstrated improved outgrowth in 384-well plates, enrichment of high producer population, improved bioreactor performance and consistent phenotypic stability over many generations. In particular, increased volumetric and specific productivities for two industrially relevant DTE molecules together with their improved lactate profile demonstrated by the MMP clones in bioreactors suggest that the MMP-enriched host is better equipped to deal with the challenges of developability and manufacture of DTE biotherapeutics. Moreover, given these remarkable improvements in cellular performance, this novel host can serve as a cost-effective and high-throughput tool for the cell line development process for production of recombinant proteins of various molecular formats.
Mitochondria play a dominant role in energy production via the oxidative phosphorylation process in the electron transport chain present in the mitochondrial membrane and the functional significance of MMP is multifaceted. Broadly, MMP is an indicator of mitochondrial function and energy metabolism. Apart from being an essential component in the process of energy storage during oxidative phosphorylation,Citation65,Citation66 MMP plays a key role in mitochondrial homeostasis through selective elimination of dysfunctional mitochondria.Citation43 It is also a driving force for transport of ions (other than H+) and proteins, which are necessary for healthy mitochondrial functioning.Citation67 Moreover, MMP provides the driving force for ATP synthesis in mitochondria. Due to their enormous energy demand, cells in the production phase require enhanced mitochondrial function to meet their energy need. Thus, it is not surprising to see the producer cells with high MMP and increased mitochondrial activity demonstrating better performance in fed-batch cultures. Although at high MMP the mitochondrial respiratory chain becomes a significant producer of ROS and maintaining excessively high mitochondrial MMP is known to be harmful to mitochondria and consequently to the cell,Citation43 we have not observed any detrimental effect of higher MMP on cell health or production performance for clones derived from the MMP-enriched host. Intracellular levels of ROS and superoxide along with the numbers of apoptotic cells were similar for the parental CHO and MMP-enriched clones in a bioreactor fed-batch environment. Furthermore, there were comparable oxidation levels of methionine and tryptophan residues in the purified products expressed by clones from both hosts. We believe, following two rounds of FACS selection, the high MMP trait of the enriched host cells represents the optimal MMP status required for improved cell function.
To obtain a deeper understanding of the MMP-enriched host phenotype and to gain better insight into host cell biology in relation to biotherapeutics production, we performed a comparative proteomic analysis of the MMP-enriched host and the parental CHO host. After CHO-mouse protein homologs were determined, three pathways were identified that were modulated in the high MMP phenotype, and the key proteins involved in these pathways were validated by Western blot analysis. Here we report that the MMP-enriched host has upregulated expression of the Mfn2, PINK1 and p-Parkin proteins. Mfn2 is known to play multiple decisive roles in mitochondrial function, implicating its impact on mitochondrial homeostasis. Mfn2 has been extensively linked to mitochondrial quality control, mainly attributed to its crucial role in mitophagy, with PINK1 and p-Parkin central to the surveillance mechanism.Citation68,Citation69 In this pathway, PINK1 accumulates on defective mitochondria, elicits the translocation of Parkin from the cytosol and mediates the clearance of damaged mitochondria.Citation68–70 Therefore, upregulation of Mfn2 in MMP-enriched cells, in spite of equivalent mitochondrial mass compared to parental CHO cells, may indicate a higher turnover of mitochondria and, consequently, improved mitochondrial function in this new host.
A novel role of mouse GAS7 as a positive regulator of PINK1-Parkin-Mfn2-mediated mitochondrial dynamics and mitophagy was reported by Bhupana et al.Citation54 Interestingly, our proteomic analysis demonstrated an elevated level of GAS7 in the MMP-enriched host and transfectant pools, suggesting a novel functional significance of these proteins in CHO cells that has not been reported to date. Considerable evidence suggests Mfn2 depletion leads to reduced MMP, increased mitochondrial proton leakage, and impairment of fatty acid metabolism and oxidative phosphorylation.Citation71–74 In addition, Mfn2 forms complexes that are capable of tethering mitochondria to ER,Citation48–50 a structural feature essential for mitochondrial energy metabolism, maintenance of intracellular calcium homeostasisCitation75,Citation76 and regulation of ER stress response.Citation56,Citation77,Citation78 Mfn2 ablation has been shown to induce ER stress in different models, from mouse tissuesCitation55,Citation56,Citation78 to Drosophila.Citation77 In particular, the work of Munoz et al. reported the induction of unfolded protein response (UPR) mediators in Mfn2-deficient mouse embryonic fibroblasts under basal or ER stress conditions and described the role of Mfn2 as an upstream modulator of PERK.Citation55 In our study, we observed reduced levels of PERK and the chaperone proteins BiP and PDI in the MMP host-derived pools, indicating that higher levels of Mfn2 expression are consistent with the maintenance of ER homeostasis with favorable UPR activation and alleviation of ER stress, which most likely contributes to the increased productivity of the pools and clones, particularly for DTE proteins. We believe that the MMP-enriched host has multifaceted protection against mitochondrial dysfunction and ER stress and thereby provides a more favorable intracellular environment for protein production than the parental CHO host.
mGPDH, an integral component of mitochondrial respiratory chain and glycerophosphate shuttle, was found to be upregulated in the MMP-enriched host and transfectant pools. Although specific roles of mGPDH in CHO cells have not been defined yet, its function at the crossroads of glycolysis, oxidative phosphorylation, and fatty acid metabolism in mammalian tissues is well documented.Citation57 As the rate-limiting component of the glycerophosphate shuttle, mGPDH connects mitochondrial and cytosolic processes and plays a significant role in cellular bioenergetics. Recent findings suggest a role for mGPDH in the regulation of cell growth and mitochondrial metabolism in different types of cancer where mGPDH overexpression was found to be associated with increased growth and oxidative phosphorylation rate.Citation79,Citation80 Thus, we believe that the high mGPDH phenotype of the MMP-enriched host may have contributed to the increased IVC and enhanced viability of transfectant pools in fed-batch cultures. The consistency of the protein markers observed between the MMP-enriched host cells and the transfectant pools indicate that the FACS-mediated enrichment has enabled the high MMP host to achieve homogeneity and phenotypic stability for the high MMP phenotype.
In conclusion, here we present an innovative approach to create a novel MMP-enriched CHO host exhibiting improved functional attributes that affect biomanufacturing processes. We provide insights into fundamental mechanisms influenced by high MMP in the intracellular environment and demonstrate the importance of host MMP in recombinant antibody production performance. Our findings indicate that the MMP-enriched host achieved a “fitter” phenotype that contributes to the significant improvement in its production capability. We believe this host will serve as an efficient tool for successful product development programs in the biomanufacturing platform and potentially lead to a reduction in the cost of goods sold.
Abbreviations
Supplemental Material
Download Zip (4.8 MB)Acknowledgments
We thank Clare Lovelady, Lina Li, and Bijay Khanal for providing the expression plasmids. We thank Pam Hawley-Nelson for helpful discussions. The work was supported by the AZ Gaithersburg Flow Cytometry Core. We thank Jonathan Boyd for confocal imaging.
Disclosure statement
The authors work for AstraZeneca and own AstraZeneca stock.
Supplementary Material
Supplemental data for this article can be accessed on the publisher’s website.
Additional information
Funding
References
- Davies SL, Lovelady CS, Grainger RK, Racher AJ, Young RJ, James DC. Functional heterogeneity and heritability in CHO cell populations. Biotechnol Bioeng. 2013;110(1):260–16. doi:10.1002/bit.24621.
- O’Callaghan PM, Berthelot ME, Young RJ, Graham JW, Racher AJ, Aldana D. Diversity in host clone performance within a Chinese hamster ovary cell line. Biotechnol Prog. 2015;31(5):1187–200. doi:10.1002/btpr.2097.
- Cost GJ, Freyvert Y, Vafiadis A, Santiago Y, Miller JC, Rebar E, Collingwood TN, Snowden A, Gregory PD. BAK and BAX deletion using zinc-finger nucleases yields apoptosis-resistant CHO cells. Biotechnol Bioeng. 2010;105(2):330–40. doi:10.1002/bit.22541.
- Fussenegger M, Fassnacht D, Schwartz R, Zanghi JA, Graf M, Bailey JE, Pörtner R. Regulated overexpression of the survival factor bcl-2 in CHO cells increases viable cell density in batch culture and decreases DNA release in extended fixed-bed cultivation. Cytotechnology. 2000;32(1):45–61. doi:10.1023/A:1008168522385.
- Majors BS, Betenbaugh MJ, Pederson NE, Chiang GG. Mcl-1 overexpression leads to higher viabilities and increased production of humanized monoclonal antibody in Chinese hamster ovary cells. Biotechnol Prog. 2009;25(4):1161–68. doi:10.1002/btpr.192.
- Misaghi S, Qu Y, Snowden A, Chang J, Snedecor B. Resilient immortals, characterizing and utilizing bax/bak deficient Chinese hamster ovary (CHO) cells for high titer antibody production. Biotechnol Prog. 2013;29(3):727–37. doi:10.1002/btpr.1722.
- Gupta SK, Srivastava SK, Sharma A, Nalage VH, Salvi D, Kushwaha H, Chitnis NB, Shukla P. Metabolic engineering of CHO cells for the development of a robust protein production platform. PLoS One. 2017;12(8):e0181455. doi:10.1371/journal.pone.0181455.
- Toussaint C, Henry O, Durocher Y. Metabolic engineering of CHO cells to alter lactate metabolism during fed-batch cultures. J Biotechnol. 2016;217:122–31. doi:10.1016/j.jbiotec.2015.11.010.
- Dreesen IA, Fussenegger M. Ectopic expression of human mTOR increases viability, robustness, cell size, proliferation, and antibody production of Chinese hamster ovary cells. Biotechnol Bioeng. 2011;108(4):853–66. doi:10.1002/bit.22990.
- Pybus LP, Dean G, West NR, Smith A, Daramola O, Field R, Wilkinson SJ, James DC. Model-directed engineering of “difficult-to-express” monoclonal antibody production by Chinese hamster ovary cells. Biotechnol Bioeng. 2014;111(2):372–85. doi:10.1002/bit.25116.
- Le Fourn V, Girod PA, Buceta M, Regamey A, Mermod N. CHO cell engineering to prevent polypeptide aggregation and improve therapeutic protein secretion. Metab Eng. 2014;21:91–102. doi:10.1016/j.ymben.2012.12.003.
- Peng RW, Abellan E, Fussenegger M. Differential effect of exocytic SNAREs on the production of recombinant proteins in mammalian cells. Biotechnol Bioeng. 2011;108(3):611–20. doi:10.1002/bit.22986.
- Bort JA, Stern B, Borth N. CHO-K1 host cells adapted to growth in glutamine-free medium by FACS-assisted evolution. Biotechnol J. 2010;5(10):1090–97. doi:10.1002/biot.201000095.
- Prentice HL, Ehrenfels BN, Sisk WP. Improving performance of mammalian cells in fed-batch processes through “bioreactor evolution”. Biotechnol Prog. 2007;23(2):458–64. doi:10.1021/bp060296y.
- Sunley K, Tharmalingam T, Butler M. CHO cells adapted to hypothermic growth produce high yields of recombinant beta-interferon. Biotechnol Prog. 2008;24(4):898–906. doi:10.1002/btpr.9.
- Weinguny M, Klanert G, Eisenhut P, Jonsson A, Ivansson D, Lövgren A, Borth N. Directed evolution approach to enhance efficiency and speed of outgrowth during single cell subcloning of Chinese hamster ovary cells. Comput Struct Biotechnol J. 2020;18:1320–29. doi:10.1016/j.csbj.2020.05.020.
- Chandrawanshi V, Kulkarni R, Prabhu A, Mehra S. Enhancing titers and productivity of rCHO clones with a combination of an optimized fed-batch process and ER-stress adaptation. J Biotechnol. 2020;311:49–58. doi:10.1016/j.jbiotec.2020.02.008.
- Mistry RK, Kelsall E, Sou SN, Barker H, Jenns M, Willis K, Zurlo F, Hatton D, Gibson SJ. A novel hydrogen peroxide evolved CHO host can improve the expression of difficult to express bispecific antibodies. Biotechnol Bioeng. 2021;(6). doi:10.1002/bit.27744.
- Desalle R, Schierwater B, Hadrys H. MtDNA: the small workhorse of evolutionary studies. Front Biosci (Landmark Ed). 2017;22(5):873–87. doi:10.2741/4522.
- Dhiman H, Gerstl MP, Ruckerbauer D, Hanscho M, Himmelbauer H, Clarke C, Barron N, Zanghellini J, Borth N. Genetic and epigenetic variation across genes involved in energy metabolism and mitochondria of Chinese hamster ovary cell lines. Biotechnol J. 2019;14(7):e1800681. doi:10.1002/biot.201800681.
- Chakrabarti L, Mathew A, Li L, Han S, Klover J, Albanetti T, Hawley-Nelson P. Mitochondrial membrane potential identifies cells with high recombinant protein productivity. J Immunol Methods. 2019;464:31–39. doi:10.1016/j.jim.2018.10.007.
- Kelly PS, Clarke C, Costello A, Monger C, Meiller J, Dhiman H, Borth N, Betenbaugh MJ, Clynes M, Barron N. Ultra-deep next generation mitochondrial genome sequencing reveals widespread heteroplasmy in Chinese hamster ovary cells. Metab Eng. 2017;41:11–22. doi:10.1016/j.ymben.2017.02.001.
- Mootha VK, Bunkenborg J, Olsen JV, Hjerrild M, Wisniewski JR, Stahl E, Bolouri MS, Ray HN, Sihag S, Kamal M, Patterson N, et al. Integrated analysis of protein composition, tissue diversity, and gene regulation in mouse mitochondria. Cell. 2003;115(5):629–40. doi:10.1016/s0092-8674(03)00926-7.
- Wasilewski M, Chojnacka K, Chacinska A. Protein trafficking at the crossroads to mitochondria. Biochim Biophys Acta Mol Cell Res. 2017;1864(1):125–37. doi:10.1016/j.bbamcr.2016.10.019.
- Nusinow DP, Szpyt J, Ghandi M, Rose CM, McDonald III ER, Kalocsay M, Jané-Valbuena J, Gelfand E, Schweppe DK, Jedrychowski M, Golji J, et al. Quantitative proteomics of the cancer cell line encyclopedia. Cell. 2020;180(2):387–402 e316. doi:10.1016/j.cell.2019.12.023.
- Handlogten MW, Lee‐O’Brien A, Roy G, Levitskaya SV, Venkat R, Singh S, Ahuja S. Intracellular response to process optimization and impact on productivity and product aggregates for a high-titer CHO cell process. Biotechnol Bioeng. 2018;115(1):126–38. doi:10.1002/bit.26460.
- Evans K, Albanetti T, Venkat R, Schoner R, Savery J, Miro‐Quesada G, Rajan B, Groves C. Assurance of monoclonality in one round of cloning through cell sorting for single cell deposition coupled with high resolution cell imaging. Biotechnol Prog. 2015;31(5):1172–78. doi:10.1002/btpr.2145.
- Maftah A, Petit JM, Ratinaud MH, Julien R. 10-N nonyl-acridine orange: a fluorescent probe which stains mitochondria independently of their energetic state. Biochem Biophys Res Commun. 1989;164(1):185–90. doi:10.1016/0006-291X(89)91700-2.
- Mukhopadhyay P, Rajesh M, Haskó G, Hawkins BJ, Madesh M, Pacher P. Simultaneous detection of apoptosis and mitochondrial superoxide production in live cells by flow cytometry and confocal microscopy. Nat Protoc. 2007;2(9):2295–301. doi:10.1038/nprot.2007.327.
- Zhang Y, Yan W, Collins MA, Bednar F, Rakshit S, Zetter BR, Stanger BZ, Chung I, Rhim AD, Di Magliano MP. Interleukin-6 is required for pancreatic cancer progression by promoting MAPK signaling activation and oxidative stress resistance. Cancer Res. 2013;73(20):6359–74. doi:10.1158/0008-5472.CAN-13-1558-T.
- Cazares LH, Chaerkady R, Samuel Weng SH, Boo CC, Cimbro R, Hsu HE, Rajan S, Dall’Acqua W, Clarke L, Ren K, McTamney P, et al. Development of a parallel reaction monitoring mass spectrometry assay for the detection of SARS-CoV-2 spike glycoprotein and nucleoprotein. Anal Chem. 2020;92(20):13813–21. doi:10.1021/acs.analchem.0c02288.
- HaileMariam M, Eguez RV, Singh H, Bekele S, Ameni G, Pieper R, Yu Y. S-Trap, an ultrafast sample-preparation approach for shotgun proteomics. J Proteome Res. 2018;17(9):2917–24. doi:10.1021/acs.jproteome.8b00505.
- Kalli A, Smith GT, Sweredoski MJ, Hess S. Evaluation and optimization of mass spectrometric settings during data-dependent acquisition mode: focus on LTQ-Orbitrap mass analyzers. J Proteome Res. 2013;12(7):3071–86. doi:10.1021/pr3011588.
- Mao S, Chaerkady R, Yu W, D’Angelo G, Garcia A, Chen H, Barrett AM, Phipps S, Fleming R, Hess S, Koopmann JO, et al. Resistance to pyrrolobenzodiazepine dimers is associated with SLFN11 downregulation and can be reversed through inhibition of ATR. Mol Cancer Ther. 2021;20(3):541–52. doi:10.1158/1535-7163.MCT-20-0351.
- Ritchie ME, Phipson B, Wu DI, Hu Y, Law CW, Shi W, Smyth GK. limma powers differential expression analyses for RNA-sequencing and microarray studies. Nucleic Acids Res. 2015;43(7):e47. doi:10.1093/nar/gkv007.
- Hadley W. in ggplot2. Springer; 2016.
- Cock PJ, Antao T, Chang JT, Chapman BA, Cox CJ, Dalke A, Friedberg I, Hamelryck T, Kauff F, Wilczynski B, De Hoon MJ, et al. Biopython: freely available python tools for computational molecular biology and bioinformatics. Bioinformatics. 2009;25(11):1422–23. doi:10.1093/bioinformatics/btp163.
- Fabian PG, Varoquaux A, Gramfort V, Bertrand M, Al OGE. J Mach Learn Res. 2011;12: 2825–30. (ed Mikio Braun).
- Pilbrough W, Munro TP, Gray P. Intraclonal protein expression heterogeneity in recombinant CHO cells. PLoS One. 2009;4(12):e8432. doi:10.1371/journal.pone.0008432.
- Tharmalingam T, Barkhordarian H, Tejeda N, Daris K, Yaghmour S, Yam P, Lu F, Goudar C, Munro T, Stevens J. Characterization of phenotypic and genotypic diversity in subclones derived from a clonal cell line. Biotechnol Prog. 2018;34(3):613–23. doi:10.1002/btpr.2666.
- Zagari F, Jordan M, Stettler M, Broly H, Wurm FM. Lactate metabolism shift in CHO cell culture: the role of mitochondrial oxidative activity. N Biotechnol. 2013;30(2):238–45. doi:10.1016/j.nbt.2012.05.021.
- Wang B, Albanetti T, Miro‐Quesada G, Flack L, Li L, Klover J, Burson K, Evans K, Ivory W, Bowen M, Schoner R, et al. High-throughput screening of antibody-expressing CHO clones using an automated shaken deep-well system. Biotechnol Prog. 2018;34(6):1460–71. doi:10.1002/btpr.2721.
- Zorova LD, Popkov VA, Plotnikov EY, Silachev DN, Pevzner IB, Jankauskas SS, Babenko VA, Zorov SD, Balakireva AV, Juhaszova M, Sollott SJ, et al. Mitochondrial membrane potential. Anal Biochem. 2018;552:50–59. doi:10.1016/j.ab.2017.07.009.
- Li S, Cha SW, Heffner K, Hizal DB, Bowen MA, Chaerkady R, Cole RN, Tejwani V, Kaushik P, Henry M, Meleady P, et al. Proteogenomic annotation of Chinese hamsters reveals extensive novel translation events and endogenous retroviral elements. J Proteome Res. 2019;18(6):2433–45. doi:10.1021/acs.jproteome.8b00935.
- Tyanova S, Temu T, Cox J. The maxQuant computational platform for mass spectrometry-based shotgun proteomics. Nat Protoc. 2016;11(12):2301–19. doi:10.1038/nprot.2016.136.
- Daumke O, Roux A. Mitochondrial homeostasis: how do dimers of mitofusins mediate mitochondrial fusion? Curr Biol. 2017;27(9):R353–R356. doi:10.1016/j.cub.2017.03.024.
- Franco A, Kitsis RN, Fleischer JA, Gavathiotis E, Kornfeld OS, Gong G, Biris N, Benz A, Qvit N, Donnelly SK, Chen Y, et al. Correcting mitochondrial fusion by manipulating mitofusin conformations. Nature. 2016;540(7631):74–79. doi:10.1038/nature20156.
- Basso V, Marchesan E, Peggion C, Chakraborty J, von Stockum S, Giacomello M, Ottolini D, Debattisti V, Caicci F, Tasca E, Pegoraro V, et al. Regulation of ER-mitochondria contacts by parkin via Mfn2. Pharmacol Res. 2018;138:43–56. doi:10.1016/j.phrs.2018.09.006.
- de Brito OM, Scorrano L. Mitofusin 2 tethers endoplasmic reticulum to mitochondria. Nature. 2008;456(7222):605–10. doi:10.1038/nature07534.
- Naon D, Zaninello M, Giacomello M, Varanita T, Grespi F, Lakshminaranayan S, Serafini A, Semenzato M, Herkenne S, Hernández-Alvarez MI, Zorzano A, et al. Critical reappraisal confirms that mitofusin 2 is an endoplasmic reticulum-mitochondria tether. Proc Natl Acad Sci U S A. 2016;113(40):11249–54. doi:10.1073/pnas.1606786113.
- Harper JW, Ordureau A, Heo JM. Building and decoding ubiquitin chains for mitophagy. Nat Rev Mol Cell Biol. 2018;19(2):93–108. doi:10.1038/nrm.2017.129.
- Pfanner N, Warscheid B, Wiedemann N. Mitochondrial proteins: from biogenesis to functional networks. Nat Rev Mol Cell Biol. 2019;20(5):267–84. doi:10.1038/s41580-018-0092-0.
- Pickles S, Vigie P, Youle RJ. Mitophagy and quality control mechanisms in mitochondrial maintenance. Curr Biol. 2018;28(4):R170–R185. doi:10.1016/j.cub.2018.01.004.
- Bhupana JN, Huang BT, Liou GG, Calkins MJ, Lin-Chao S. Gas7 knockout affects PINK1 expression and mitochondrial dynamics in mouse cortical neurons. FASEB Bioadv. 2020;2(3):166–81. doi:10.1096/fba.2019-00091.
- Munoz JP, Ivanova S, Sánchez‐Wandelmer J, Martínez‐Cristóbal P, Noguera E, Sancho A, Díaz‐Ramos A, Hernández‐Alvarez MI, Sebastián D, Mauvezin C, Palacín M, et al. Mfn2 modulates the UPR and mitochondrial function via repression of PERK. EMBO J. 2013;32(17):2348–61. doi:10.1038/emboj.2013.168.
- Ngoh GA, Papanicolaou KN, Walsh K. Loss of mitofusin 2 promotes endoplasmic reticulum stress. J Biol Chem. 2012;287(24):20321–32. doi:10.1074/jbc.M112.359174.
- Mracek T, Drahota Z, Houstek J. The function and the role of the mitochondrial glycerol-3-phosphate dehydrogenase in mammalian tissues. Biochim Biophys Acta. 2013;1827(3):401–10. doi:10.1016/j.bbabio.2012.11.014.
- Birch JR, Racher AJ. Antibody production. Adv Drug Deliv Rev. 2006;58(5–6):671–85. doi:10.1016/j.addr.2005.12.006.
- Cacciatore JJ, Chasin LA, Leonard EF. Gene amplification and vector engineering to achieve rapid and high-level therapeutic protein production using the Dhfr-based CHO cell selection system. Biotechnol Adv. 2010;28(6):673–81. doi:10.1016/j.biotechadv.2010.04.003.
- Zhu J, Hatton D. New mammalian expression systems. Adv Biochem Eng Biotechnol. 2017. doi:10.1007/10_2016_55.
- Kelley B. Developing therapeutic monoclonal antibodies at pandemic pace. Nat Biotechnol. 2020;38(5):540–45. doi:10.1038/s41587-020-0512-5.
- Bolisetty P, Tremml G, Xu S, Khetan A. Enabling speed to clinic for monoclonal antibody programs using a pool of clones for IND-enabling toxicity studies. MAbs. 2020;12(1):1763727. doi:10.1080/19420862.2020.1763727.
- Fan L, Rizzi G, Bierilo K, Tian J, Yee JC, Russell R, Das TK. Comparative study of therapeutic antibody candidates derived from mini-pool and clonal cell lines. Biotechnol Prog. 2017;33(6):1456–62. doi:10.1002/btpr.2477.
- Munro TP, Le K, Le H, Zhang L, Stevens J, Soice N, Benchaar SA, Hong RW, Goudar CT. Accelerating patient access to novel biologics using stable pool-derived product for non-clinical studies and single clone-derived product for clinical studies. Biotechnol Prog. 2017;33(6):1476–82. doi:10.1002/btpr.2572.
- Kadenbach B. Intrinsic and extrinsic uncoupling of oxidative phosphorylation. Biochim Biophys Acta. 2003;1604(2):77–94. doi:10.1016/S0005-2728(03)00027-6.
- Chen LB. Mitochondrial membrane potential in living cells. Annu Rev Cell Biol. 1988;4(1):155–81. doi:10.1146/annurev.cb.04.110188.001103.
- Spinelli JB, Haigis MC. The multifaceted contributions of mitochondria to cellular metabolism. Nat Cell Biol. 2018;20(7):745–54. doi:10.1038/s41556-018-0124-1.
- Chen Y, Dorn GW 2nd. PINK1-phosphorylated mitofusin 2 is a parkin receptor for culling damaged mitochondria. Science. 2013;340(6131):471–75. doi:10.1126/science.1231031.
- Durcan TM, Fon EA. The three ‘P’s of mitophagy: PARKIN, PINK1, and post-translational modifications. Genes Dev. 2015;29:989–99. doi:10.1101/gad.262758.115.
- McLelland GL, Goiran T, Yi W, Dorval G, Chen CX, Lauinger ND, Krahn AI, Valimehr S, Rakovic A, Rouiller I, Durcan TM, et al. Mfn2 ubiquitination by PINK1/parkin gates the p97-dependent release of ER from mitochondria to drive mitophagy. Elife. 2018;7. doi:10.7554/eLife.32866.
- Bach D, Pich S, Soriano FX, Vega N, Baumgartner B, Oriola J, Daugaard JR, Lloberas J, Camps M, Zierath JR, Rabasa-Lhoret R, et al. Mitofusin-2 determines mitochondrial network architecture and mitochondrial metabolism. A novel regulatory mechanism altered in obesity. J Biol Chem. 2003;278(19):17190–97. doi:10.1074/jbc.M212754200.
- Chen H, Chomyn A, Chan DC. Disruption of fusion results in mitochondrial heterogeneity and dysfunction. J Biol Chem. 2005;280(28):26185–92. doi:10.1074/jbc.M503062200.
- Mourier A, Motori E, Brandt T, Lagouge M, Atanassov I, Galinier A, Rappl G, Brodesser S, Hultenby K, Dieterich C, Larsson NG, et al. Mitofusin 2 is required to maintain mitochondrial coenzyme Q levels. J Cell Biol. 2015;208(4):429–42. doi:10.1083/jcb.201411100.
- Pich S, Bach D, Briones P, Liesa M, Camps M, Testar X, Palacín M, Zorzano A. The Charcot-Marie-tooth type 2A gene product, Mfn2, up-regulates fuel oxidation through expression of OXPHOS system. Hum Mol Genet. 2005;14(11):1405–15. doi:10.1093/hmg/ddi149.
- Rizzuto R, Pinton P, Carrington W, Fay FS, Fogarty KE, Lifshitz LM, Tuft RA, Pozzan T. Close contacts with the endoplasmic reticulum as determinants of mitochondrial Ca2+ responses. Science. 1998;280:1763–66. doi:10.1126/science.280.5370.1763.
- Szabadkai G, Bianchi K, Várnai P, De Stefani D, Wieckowski MR, Cavagna D, Nagy AI, Balla T, Rizzuto R. Chaperone-mediated coupling of endoplasmic reticulum and mitochondrial Ca2+ channels. J Cell Biol. 2006;175(6):901–11. doi:10.1083/jcb.200608073.
- Debattisti V, Pendin D, Ziviani E, Daga A, Scorrano L. Reduction of endoplasmic reticulum stress attenuates the defects caused by drosophila mitofusin depletion. J Cell Biol. 2014;204(3):303–12. doi:10.1083/jcb.201306121.
- Sebastian D, Hernández-Alvarez MI, Segalés J, Sorianello E, Muñoz JP, Sala D, Waget A, Liesa M, Paz JC, Gopalacharyulu P, Orešič M, et al. Mitofusin 2 (Mfn2) links mitochondrial and endoplasmic reticulum function with insulin signaling and is essential for normal glucose homeostasis. Proc Natl Acad Sci U S A. 2012;109(14):5523–28. doi:10.1073/pnas.1108220109.
- Pecinova A, Alán L, Brázdová A, Vrbacký M, Pecina P, Drahota Z, Houštěk J, Mráček T. Role of mitochondrial glycerol-3-Phosphate dehydrogenase in metabolic adaptations of prostate cancer. Cells. 2020;9(8). doi:10.3390/cells9081764.
- Thakur S, Daley B, Gaskins K, Vasko VV, Boufraqech M, Patel D, Sourbier C, Reece J, Cheng SY, Kebebew E, Agarwal S, et al. Metformin targets mitochondrial glycerophosphate dehydrogenase to control rate of oxidative phosphorylation and growth of thyroid cancer in vitro and in vivo. Clin Cancer Res. 2018;24(16):4030–43. doi:10.1158/1078-0432.CCR-17-3167.