
ABSTRACT
Anti-drug antibodies (ADA) can limit the efficacy and safety of therapeutic antibodies. However, determining the exact nature of ADA interactions with the target drug via epitope mapping is challenging due to the polyclonal nature of the IgG response. Here, we demonstrate successful proof-of-concept for the application of hydroxyl radical footprinting (HRF)-mass spectrometry for epitope mapping of ADAs obtained from goats that were administered a knob-into-hole bispecific antibody (BsAb1). Subsequently, we performed epitope mapping of ADAs obtained from cynomolgus (cyno) monkeys that were administered BsAb1 as we described in a recently published paper. Herein, we provide the first data to demonstrate the feasibility of using HRF for ADA epitope mapping, and show that both goat and cyno-derived ADAs specifically target the complementary-determining regions in both arms of BsAb1, suggesting that the ADA epitopes on BsAb1 may be species-independent.
The administration of a biotherapeutic drug can lead to an unwanted immune response and the production of anti-drug antibodies (ADAs), which can diminish drug efficacy, affect drug pharmacokinetics, and cause possible adverse events, including anaphylaxis.Citation1–3 Therapeutic antibodies (i.e., monoclonal (mAbs) and related proteins, such as bispecific antibodies (BsAbs)), are attractive biotherapeutics due to their high specificity and generally low immunogenicity risk. However, even some humanized and fully human mAbs have been shown to elicit immunogenic responses.Citation1,Citation2,Citation4–6 Hence, the monitoring of ADAs is routinely performed during nonclinical and clinical studies of therapeutic antibodies, and is expected from health authorities during drug development.
In our companion study,Citation7 we used an integrated approach to determine the cause of the strong immunogenic response observed during clinical trials of a bispecific antibody (BsAb1). BsAb1 is a full-length, humanized IgG4 bispecific antibody that blocks the activity of soluble targets A and B (Anti-A/B). BsAb1 is produced in two separate E. coli cell culture processes, followed by in vitro assembly using knobs-into-holes technology.Citation8 The clinical development of BsAb1 was terminated, in part due to the observation of a high incidence of ADAs.Citation9 Interestingly, the two monovalent parental mAbs (Anti-A/A and Anti-B/B, standard antibodies) derived from Chinese hamster ovary (CHO) cells, exhibited low rates of ADA formation in clinical trials (data not shown). The notable difference between the CHO-derived standard parent mAbs and the E. coli-derived BsAb1 molecule include anti-B variable domains from parental IgG1 grafted onto the IgG4 framework of BsAb1, 4 knob-into-hole mutations in the CH3 domains of BsAb1, and a lack of N-linked glycans due to E. coli expression of BsAb1. Thus, understanding this unexpected immune response is paramount for the future development of E. coli-derived bispecific antibody modality.
Our previous work investigated the cause of immunogenicity with an in vivo study of cynomolgus (cyno) monkeys using BsAb1 (Anti-A/B) and three highly similar bispecific antibodies, differing only in their content and positioning of anti-A and anti-B antigen-binding fragment (Fab) arms (Anti-A/A, Anti-B/B, Anti-B/A).Citation7 This work showed that the molecules that included Arm-B elicited strong immune responses, whereas the molecule lacking Arm-B (i.e., Anti-A/A) elicited little or no response. Thus, the assumption drawn was that the Fab of the anti-B arm of BsAb1, was necessary for the cyno ADA response. However, the exact binding interactions between the ADAs and BsAb1 remained unclear. We were thus interested in epitope mapping of cyno-derived ADAs to understand the nature of the epitope interaction on BsAb1.
There are many technologies available for epitope mapping, including peptide array, electron microscopy, crystallography, and mutagenesis (reviewed by Nilvebrant et al.Citation10). However, each of these technologies has disadvantages, such as cost, throughput, protein amount/purity requirements, and ability to detect conformational vs. linear epitopes. Bottom-up mass spectrometry (MS) technologies using covalent and non-covalent labeling have shown promise for deciphering protein–protein interactions and are able to circumvent some of the inherent challenges described by other epitope mapping technologies.Citation11–13 One of the emerging MS-based technologies for epitope mapping is hydroxyl radical footprinting (HRF)-MS, a technology that uses hydroxyl radicals to label the side chains of solvent-exposed amino acids.Citation14 The high affinity, specificity, and large surface area of antibody-antigen complexes are ideal for epitope mapping using HRF.Citation13,Citation15,Citation16 However, identifying the difference between a binding site and a conformational change is difficult for all bottom-up MS technologies.
Epitope mapping ADAs is challenging due to their polyclonal nature. A typical ADA response consists of multiple antibodies that bind different epitopes on the same antigen. Therefore, using bottom-up technologies to determine binding site(s) is extremely difficult and has only recently been demonstrated using hydrogen-deuterium exchange-mass spectrometry (HDX-MS).Citation17 To our knowledge, epitope mapping of ADAs using HRF has not been shown. In addition, the affinity purification of ADAs from serum can significantly influence the final ADA population depending on the selection process.
In this study, we first performed a proof-of-concept study using ADAs derived from the immunization of goats against BsAb1, to determine the feasibility of epitope mapping ADAs using HRF. Upon successful demonstration, we then repeated the workflow with the ADAs from the cyno that produced the highest titer ADA response against BsAb1 as observed in the companion study.Citation7 Below we describe the workflow for the epitope mapping of the ADAs, and show that the cyno-derived ADAs specifically target the complementary-detereming regions (CDRs) from both Arm-A and Arm-B of BsAb1.
The epitope mapping workflow was as follows: Purified ADAs from goat and cyno were mixed with BsAb1 to facilitate ADA-BsAb1 complex formation, separated using size-exclusion chromatography (SE-HPLC), and subjected to HRF analysis. SE-HPLC not only enables enrichment of the complexes but also provides buffer exchange into a suitable buffer (phosphate) for HRF analysis. The HRF technology used in this study was Fast Photochemical Oxidation of Proteins (FPOP), a bench-top technology ideally suited for epitope mapping and characterizing protein–protein interactions.Citation18,Citation19 HDX-MS is a well-established technique used in industry for epitope mapping, but as with all bottom-up MS technology, there are certain limitations, including the time-dependent labeling requirements, pH-dependent labeling effects, and deglycosylation challenges. FPOP can circumvent some of these challenges due to the stable addition of the hydroxyl radical.Citation20 However, the combination of both of these technologies may provide the most comprehensive understanding of protein–protein interactions.Citation21–23
The amount of hydroxyl radical labeling (% modification) that occurs is dependent on the intrinsic reactivity and solvent-accessible surface area (SASA) for each residue.Citation24,Citation25 Quantitating the hydroxyl radical labeling for every given peptide provides a detailed, region-specific footprint of the solvent accessibility of the protein. Determining the binding interface between ADA and target (e.g., epitope mapping) can be achieved by comparing the oxidative footprints of the unbound BsAb1 and ADA-bound BsAb1. Specifically, BsAb1 regions with a statistical decrease in labeling (decrease in SASA) in the ADA-bound state, relative to the unbound state, provide evidence for direct ADA binding interactions. However, conformational changes that occur from binding can lead to both decreased and increased labeling (increase in SASA). Therefore, changes in SASA are not always indicative of the binding site.
The successful epitope mapping of polyclonal ADAs in these studies required three important aspects: 1) high tryptic mapping sequence coverage of the antigen, 2) fractionation of the fully bound ADA-target complexes, and 3) determination of the potential sequence overlap between the ADAs and the BsAb1. We achieved these three aspects by demonstrating >80% sequence coverage for the BsAb1, utilizing SE-HPLC to fractionate and purify the ADA complexes, and screening of the unbound ADA tryptic digestion against the BsAb1 sequence database. Interference from goat ADA-derived peptides was not a concern due to insufficient sequence identity between goat IgG and the humanized BsAb1 framework. However, we expected the cyno ADAs to share some sequence overlap with the humanized BsAb1 framework. As seen in Figures S1 and S2, there is sequence overlap between the cyno ADAs and BsAb1 in both the light chain (LC) and heavy chain (HC) constant regions. There was also some unexpected sequence overlap with HC-CDR3 of BsAb1 Arm-B, but it was unclear if this was a false positive, as no sequence overlap is expected within the CDRs (Figure S2). The peptides showing overlap between cyno ADA and BsAb1 were excluded from the oxidative footprint analysis for the cyno ADA epitope mapping to avoid confounding the results.
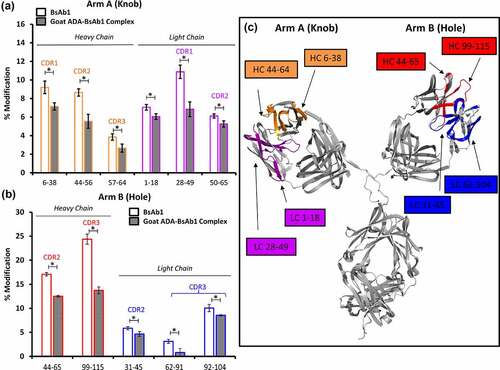
As indicated, the initial proof-of-concept studies were performed with purified goat-derived ADAs immunized against BsAb1 antigen-binding regions (see methods section). This was intended to simplify the identification of the potential ADA binding sites by focusing on the variable domains, thereby providing a positive control. The goat ADA-BsAb1 complexes were generated by mixing the goat ADAs in a 2:1 molar excess to the BsAb1 (to ensure full occupancy), then the material was separated using SE-HPLC (Figure S3). Given the polyclonal nature of the ADA and the bispecific nature of BsAb1, it was not surprising to observe multiple peaks in the chromatogram as a result of ADA-BsAb1 complexes. The complexes and unbound BsAb1 were subsequently subjected to HRF analysis. Comparison of the full oxidative footprints between the unbound and ADA-bound BsAb1 provides direct evidence for interactions at the HC and LC CDRs of both Arm-A and Arm-B (Figure S4, Figure S5) of BsAb1. These data were subsequently plotted on a homology model of BsAb1 for visualization ().
Figure 1. Structural analysis of Goat ADA-BsAb1 Complex by HRF. Bar graph comparing the oxidative labeling footprint of selected tryptic peptides in the unbound and bound states for both arm A (a) and arm B (b) of BsAb1. Full oxidative footprints are shown in Figure S4 & S5. (c) Mapping of the HRF data onto the molecular model. *Denotes practically significant changes in % modification.
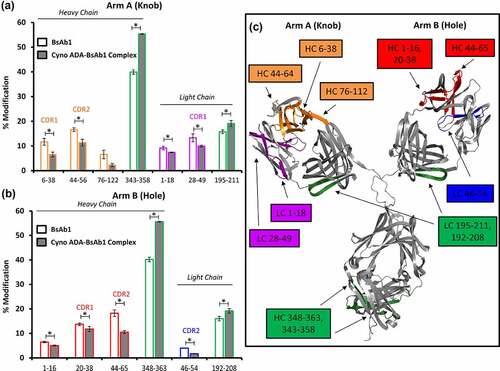
After successfully demonstrating the use of HRF for epitope mapping of goat-derived ADAs targeting the antigen-binding regions, a similar workflow was performed for the cyno-derived ADAs. In this case, the cyno ADAs were affinity purified against the full-length BsAb1 without negative selection against the IgG constant regions (see methods section). This enabled a relatively unbiased analysis of the potential ADA epitopes on the entire BsAb1 molecular surface. The cyno ADA-BsAb1 complexes were analyzed following the same procedures as the goat ADA-BsAb1 complexes, and they demonstrated a similar SE-HPLC profile (data not shown). Peptides with identical sequence derived from cyno ADA and BsAb1 were removed from the analysis, and therefore there were fewer peptides to consider for the mapping of cyno ADAs as compared with the goat ADA study. The oxidative footprint of cyno ADA-bound BsAb1 demonstrated binding at the HC and LC CDRs of both Arm-A and Arm-B of BsAb1 (Figure S6, Figure S7). There was no evidence of ADA binding epitopes on the humanized IgG4 bispecific knobs-into-holes framework. However, there were two regions showing increased hydroxyl radical labeling (increased SASA) in the cyno ADA-bound BsAb1, which could indicate remote conformational changes elicited by ADA binding ().
Figure 2. Structural analysis of Cyno ADA-BsAb1 Complex by HRF. Bar graph comparing the oxidative labeling footprint of selected tryptic peptides in the unbound and bound states for both arm A (a) and arm B (b) of BsAb1. Full oxidative footprints are shown in Figure S6 & S7. (c) Mapping of the HRF data onto the molecular model. *Denotes practically significant changes in % Modification.
Our previously published companion study provided evidence that the Anti-B arm of BsAb1 was necessary for a strong cyno ADA response.Citation7 However, in this work, we demonstrate that cyno ADAs target the CDRs in both Anti-A and Anti-B arms of BsAb1. To understand the population of ADAs that target the Arm-A vs. Arm-B, we used the three other bispecific antibody variants to determine how much immune-complex is formed when mixed with the cyno-derived BsAb1 ADAs. SE-HPLC analysis of the different immune-complexes generated from the four bispecific variants (Anti-A/B, Anti-B/A, Anti-A/A, Anti-B/B) showed that the Anti-A/A variant produced the least amount of immune-complex compared with the variants containing the Anti-B arm (data not shown). While quantitative abundance was not determined, these data indicated that the ADAs against the Arm-A were lower in abundance or lower in affinity than the ADAs targeting Arm-B.
Therefore, we likely observed ADA epitopes on Arm-A simply due to enrichment of low abundance immune-complexes for HRF analysis. Targeting of both Arm-A and Arm-B was observed for both goat and cyno ADAs, suggesting that the targeting of CDRs may be a species-independent phenomenon. Although ADA binding epitopes were identified here, additional work to identify the T cell epitopes necessary to produce a mature ADA response using MHC-associated peptide proteomics (MAPPS) and other assays will be required to enable a better understanding of the root causes of BsAb1 immunogenicity.
This report demonstrates the feasibility of using HRF for epitope mapping of ADAs. While successful in the current studies, epitope mapping of human patient ADAs will pose substantial challenges due to the limited quantities, their polyclonal nature, and potential sequence identity with the administered biotherapeutics. Addressing these challenges will depend on both the nature of the administered biotherapeutics and the associated immune-complexes, as well as improved analytical tools for enrichment and analysis. The strategy presented here for epitope mapping of ADAs provides a novel framework for improving our understanding of biotherapeutic-derived immunogenicity.
Materials and methods
The in vivo study was conducted at Genentech, South San Francisco, in accordance with the IACUC, the USDA Animal Welfare Act and the Guide for the Care and Use of Laboratory Animals.
Antisera generation
A female Nubian goat was hyperimmunized via subcutaneous administration of 1 mg of BsAb1 on Day 0 (Genentech, South San Francisco, CA). The animal was subsequently boosted four times (on Days 14, 28, 42, 56) with 1 mg of BsAb1 subcutaneously, and on Day 65, the animal was bled. The bleed was processed to isolate the antisera fraction, which was used as a starting material for affinity purification of goat ADAs directed against BsAb1. The cyno ADAs were generated as previously described.Citation7
Purification of goat ADA from goat serum
Goat ADAs were purified by total IgG isolation, negative selection, and positive selection. All steps were performed using an ÄKTApurifier FPLC (GE Healthcare, Piscataway, NJ).
For negative selection, polyclonal hu IgG (Jackson ImmunoResearch, West Grove, PA. Catalog number: 009–000-003) and IgG4 isotype rhuMAb (Genentech, South San Francisco, CA), 5 mL HiTrap® (GE Healthcare, Piscataway, NJ) affinity columns were constructed per the manufacturer’s instructions. For each column, approximately 50 mg of antibody was immobilized. For positive selection, a BsAb1 5 mL HiTrap® affinity column was constructed (approximately 50 mg was immobilized).
Total goat IgG was isolated from goat anti-BsAb1 antisera via saturated ammonium sulfate precipitation. Next, the goat IgG was passed over polyclonal hu IgG and IgG4 rhuMAb affinity columns connected in series (negative selection). Finally, the flow-through from the negative selection step was passed over the BsAb1 affinity column, and goat anti-BsAb1 CDR polyclonal antibodies were recovered via elution with 100 mM acetic acid pH 2.8 (positive selection). The eluate was neutralized using 1 M Tris pH 8.0 and dialyzed extensively against phosphate-buffered saline (PBS) pH 7.4.
Purification of cyno ADA from cyno serum
To purify the possible ADA from cynos treated with BsAb1, frozen serum samples (4 mL) were thawed and centrifuged at 3000 x g for 4 min and the supernatant was purified through two 0.2-micron filters before loading onto two tandem affinity columns at a flow rate of 0.1 mL/min. The first affinity column was an anti-human IgG affinity resin prepared with sheep anti-human IgG (The Binding Site, Birmingham, UK, AU003.M) bound to Actigel ALD resin (Sterogene, 40–60 um particle size) to bind and remove any remaining free human BsAb1. The second column was prepared from full-length BsAb1 in a similar manner using the Actigel resin to bind any cyno ADAs present in the serum that were directed to BsAb1. The tandem columns were extensively washed with PBS until the A280 absorbance reached baseline. Thereafter, the two columns were separated, and each eluted with 0.1 M acetic acid containing 0.15 M NaCl. After elution, each column was re-equilibrated with PBS for subsequent rounds of purification from additional cyno samples. Fractions from the starting serum and peaks eluted with acetic acid were analyzed by non-reducing SDS-PAGE and mass spectrometry to confirm the nature of the eluted sample. Both analyses confirmed purification of BsAb1 from the sheep anti-human column and a heterogeneous mix of antibody masses eluted from the BsAb1 column.
ADA-BsAb1 complex preparation
Goat ADA-BsAb1 complexes were prepared in PBS buffer at a 2:1 ratio of excess ADAs and incubated for 1 h at room temperature before analysis. Cyno ADA-BsAb1 complexes were prepared in PBS buffer at a 2:1 ratio to promote ADA binding toward BsAb1 and were incubated for 1 h at room temperature before analysis.
Size-Exclusion High-Performance Liquid Chromatography
SE-HPLC was performed on Agilent 1200 Series HPLC instruments (Agilent Technologies, Santa Clara, CA) with Chromeleon version 7.2 software (Thermo Fischer Dionex, Waltham, MA). ADA, BsAb1, and ADA-BsAb1 complex samples were flowed through a TSKgel G3000SWxl column (Tosoh Bioscience, Tokyo, Japan) at 0.5 mL/min. The mobile phase consisted of 0.2 M potassium phosphate/0.25 M potassium chloride pH 6.2. Column temperature was maintained at ambient temperature, and absorbance was monitored at 280 nm. Fractionated ADA-BsAb1 complexes were collected in 1.5 mL microcentrifuge tubes (Eppendorf, Hamburg, Germany).
Hydroxyl radical footprinting
Fractionated BsAb1 and ADA-BsAb1 complexes were subjected to labeling as previously described.Citation16 Briefly, a high-power laser was focused on a glass capillary to irradiate the sample. Two syringes, one containing the protein samples combined with arginine (used to help control the amount of hydroxyl labeling) and another containing hydrogen peroxide, converged on a T-mixer just before the point of laser irradiation. This T-mixer allowed the solution to mix at a 2:1 (protein:hydrogen peroxide) volume ratio. After irradiation, the samples were delivered in-line to a sample tube containing methionine and catalase to quench the labeling reaction. Three laser-irradiated samples were obtained in addition to a no-laser control sample. Percent oxidation is presented as the mean of triplicate runs after subtraction of the “no laser” background oxidation control. Error bars represent the 95% confidence limits for the mean. The difference in percent oxidation levels of two samples is considered to be practically significant when the corresponding error bars do not overlap.
Peptide mapping and mass spectrometry analysis
Hydroxyl radical labeled protein samples were digested as previously described.Citation16 Briefly, the proteins were reduced with 6 M guanidine-HCl and 10 mM dithiothreitol (DTT) at 45°C for 10 min, alkylated with 25 mM iodoacetamide at room temperature for 5 min, and quenched with 50 mM DTT at room temperature. The resulting samples were then desalted using NAP-5 columns (GE Healthcare, Chicago, Illinois), digested with trypsin at 37°C overnight, and quenched with 100% of formic acid. Tryptic peptide separation was performed using a Waters H-Class UPLC system (Waters Corporation, Milford, MA) with a Waters Acquity UPLC CSH130 C-18 column (1.7-μm, 2.1 mm × 150 mm). The flow rate at 0.3 mL/min and the column temperature was set to 77°C. Mobile phases consisted of 0.1% formic acid in water (A) and 0.1% formic acid in acetonitrile (B). The gradient was 0% to 35% B in 42 min. MS analysis was carried out with a ThermoFisher QExactive Orbitrap MS operating in positive mode, performing MS2 scans on the top-10 most abundant peaks in data-dependent acquisition mode in the m/z range 350–2000 at a resolving power of 35,000. MS data treatment was performed using Byonic and Byologic Footprint Software Suites (Protein Metrics, Inc., Cupertino, California) for peak identification and quantitation of percent oxidation for each peptide, respectively. Percent oxidation is presented as the average of triplicate runs after subtracting the no-laser background oxidation control. Error bars represent the statistical analysis performed using a single sample t-test with a 95% confidence interval.
Supplemental Material
Download Zip (895.6 KB)Disclosure statement
No potential conflict of interest was reported by the author(s).
Supplementary material
Supplemental data for this article can be accessed on the publisher’s website
Additional information
Funding
References
- Boehncke W-H, Brembilla NC. Immunogenicity of biologic therapies: causes and consequences. Expert Rev Clin Immunol. 2018;14(6):513–6. doi:10.1080/1744666X.2018.1468753.
- Garcês S, Demengeot J. The immunogenicity of biologic therapies. Curr Probl Dermatol. 2017;53:37–48.
- Sethu S, Govindappa K, Alhaidari M, Pirmohamed M, Park K, Sathish J. Immunogenicity to biologics: mechanisms, prediction and reduction. Arch Immunol Ther Exp (Warsz). 2012;60(5):331–44. doi:10.1007/s00005-012-0189-7.
- Strand V, Balsa A, Al-Saleh J, Barile-Fabris L, Horiuchi T, Takeuchi T, Lula S, Hawes C, Kola B, Marshall L, et al. Immunogenicity of biologics in chronic inflammatory diseases: a systematic review. BioDrugs. 2017;31(4):299–316. doi:10.1007/s40259-017-0231-8.
- van Schouwenburg PA, van de Stadt LA, de Jong RN, van Buren EEL, Kruithof S, de Groot E, Hart M, van Ham SM, Rispens T, Aarden L, et al. Adalimumab elicits a restricted anti-idiotypic antibody response in autoimmune patients resulting in functional neutralisation. Ann Rheum Dis. 2013;72(1):104. doi:10.1136/annrheumdis-2012-201445.
- Harding FA, Stickler MM, Razo J, DuBridge RB. The immunogenicity of humanized and fully human antibodies: residual immunogenicity resides in the CDR regions. MAbs. 2010;2(3):256–65. doi:10.4161/mabs.2.3.11641.
- Cohen S, Chung S, Spiess C, Lundin V, Stefanich E, Laing ST, Clark V, Brumm J, Zhou Y, Huang C, et al. An integrated approach for characterizing immunogenic responses toward a bispecific antibody. MAbs. 2021;13(1):1944017. doi:10.1080/19420862.2021.1944017.
- Ridgway JBB, Presta LG, Carter P. ‘Knobs-into-holes’ engineering of antibody CH3 domains for heavy chain heterodimerization. Protein Engineering, Design and Selection. 1996;9(7):617–21. doi:10.1093/protein/9.7.617.
- Peng K, Siradze K, Fischer SK. Characterization of robust immune responses to a bispecific antibody, a novel class of antibody therapeutics. Bioanalysis. 2021;13(4):239–52. doi:10.4155/bio-2020-0281.
- Nilvebrant J, Rockberg J. An introduction to epitope mapping. Methods Mol Biol. 2018;1785:1–10.
- Zhang H, Cui W, Gross ML. Mass spectrometry for the biophysical characterization of therapeutic monoclonal antibodies. FEBS Lett. 2014;588(2):308–17. doi:10.1016/j.febslet.2013.11.027.
- Limpikirati P, Liu T, Vachet RW. Covalent labeling-mass spectrometry with non-specific reagents for studying protein structure and interactions. Methods. 2018;144:79–93. doi:10.1016/j.ymeth.2018.04.002.
- Zhang Y, Wecksler AT, Molina P, Deperalta G, Gross ML. Mapping the binding interface of VEGF and a monoclonal antibody Fab-1 fragment with Fast Photochemical Oxidation of Proteins (FPOP) and mass spectrometry. J Am Soc Mass Spectrom. 2017;28(5):850–58. doi:10.1007/s13361-017-1601-7.
- Wang L, Chance MR. Structural mass spectrometry of proteins using hydroxyl radical based protein footprinting. Anal Chem. 2011;83(19):7234–41. doi:10.1021/ac200567u.
- Yan Y, Chen G, Wei H, Huang RY, Mo J, Rempel DL, Tymiak AA, Gross ML. Fast photochemical oxidation of proteins (FPOP) maps the epitope of EGFR binding to adnectin. J Am Soc Mass Spectrom. 2014;25(12):2084–92. doi:10.1007/s13361-014-0993-x.
- Lin M, Krawitz D, Callahan MD, Deperalta G, Wecksler AT. Characterization of ELISA antibody-antigen interaction using footprinting-mass spectrometry and negative staining transmission electron microscopy. J Am Soc Mass Spectrom. 2018;29(5):961–71. doi:10.1007/s13361-017-1883-9.
- Ständer S,R, Grauslund L, Scarselli M, Norais N, Rand K. Epitope mapping of polyclonal antibodies by Hydrogen–Deuterium Exchange Mass Spectrometry (HDX-MS). Anal Chem. 2021;93(34):11669–78. doi:10.1021/acs.analchem.1c00696.
- Li J, Chen G. The use of fast photochemical oxidation of proteins coupled with mass spectrometry in protein therapeutics discovery and development. Drug Discov Today. 2019;24(3):829–34. doi:10.1016/j.drudis.2018.12.008.
- Liu XR, Rempel DL, Gross ML. Protein higher-order-structure determination by fast photochemical oxidation of proteins and mass spectrometry analysis. Nat Protoc. 2020;15(12):3942–70. doi:10.1038/s41596-020-0396-3.
- Johnson DT, Di Stefano LH, Jones LM. Fast photochemical oxidation of proteins (FPOP): a powerful mass spectrometry-based structural proteomics tool. J Biol Chem. 2019;294(32):11969–79. doi:10.1074/jbc.REV119.006218.
- Cornwell O, Radford SE, Ashcroft AE, Ault JR. Comparing hydrogen deuterium exchange and fast photochemical oxidation of proteins: a structural characterisation of wild-type and ΔN6 β2-microglobulin. J Am Soc Mass Spectrom. 2018;29(12):2413–26. doi:10.1007/s13361-018-2067-y.
- Li KS, Schaper Bergman ET, Beno BR, Huang RY, Deyanova E, Chen G, Gross ML. Hydrogen-deuterium exchange and hydroxyl radical footprinting for mapping hydrophobic interactions of human bromodomain with a small molecule inhibitor. J Am Soc Mass Spectrom. 2019;30(12):2795–804. doi:10.1007/s13361-019-02316-1.
- Shi L, Liu T, Gross ML, Huang Y. Recognition of human IgG1 by Fcγ receptors: structural insights from hydrogen–deuterium exchange and fast photochemical oxidation of proteins coupled with mass spectrometry. Biochemistry. 2019;58(8):1074–80. doi:10.1021/acs.biochem.8b01048.
- Charvatova O, Foley BL, Bern MW, Sharp JS, Orlando R, Woods RJ. Quantifying protein interface footprinting by hydroxyl radical oxidation and molecular dynamics simulation: application to galectin-1. J Am Soc Mass Spectrom. 2008;19(11):1692–705. doi:10.1016/j.jasms.2008.07.013.
- Xie B, Sood A, Woods RJ, Sharp JS. Quantitative protein topography measurements by high resolution hydroxyl radical protein footprinting enable accurate molecular model selection. Sci Rep. 2017;7(1):4552. doi:10.1038/s41598-017-04689-3.