
ABSTRACT
The interaction between IgG and Fc gamma receptor IIIa (FcγRIIIa) is essential for mediating immune responses. Recent studies have shown that the antigen binding fragment (Fab) and Fc are involved in IgG-FcγRIII interactions. Here, we conducted bio-layer interferometry (BLI) and isothermal titration calorimetry to measure the kinetic and thermodynamic parameters that define the role of Fab in forming the IgG-FcγRIII complex using several marketed therapeutic antibodies. Moreover, hydrogen/deuterium exchange mass spectrometry (HDX-MS) and crosslinking mass spectrometry (XL-MS) were used to clarify the interaction sites and structural changes upon formation of these IgG-FcγRIII complexes. The results showed that Fab in IgG facilitates the interaction via slower dissociation and a larger enthalpy gain. However, a larger entropy loss led to only a marginal change in the equilibrium dissociation constant. Combined HDX-MS and XL-MS analysis revealed that the CL domain of Fab in IgG was in close proximity to FcγRIIIa, indicating that this domain specifically interacts with the extracellular membrane-distal domain (D1) and membrane-proximal domain (D2) of FcγRIIIa. Together with previous studies, these results demonstrate that IgG-FcγRIII interactions are predominantly mediated by the binding of Fc to D2, and the Fab-FcγRIII interaction stabilizes complex formation. These interaction schemes were essentially fucosylation-independent, with Fc-D2 interactions enhanced by afucosylation and the contribution of Fab slightly reduced. Furthermore, the influence of antigen binding on IgG-FcγRIII interactions was also investigated. Combined BLI and HDX-MS results indicate that structural alterations in Fab caused by antigen binding facilitate stabilization of IgG-FcγRIII interactions. This report provides a comprehensive understanding of the interaction between IgG and FcγRIII.
Introduction
Immunoglobulin G (IgG) plays an important role in the immune response by mediating antibody effector functions such as antibody-dependent cellular cytotoxicity (ADCC) and complement-dependent cytotoxicity (CDC) through the recognition of specific antigens and interaction with Fc gamma receptors (FcγRs) and complement proteins. The IgG-FcγRIIIa interaction is essential for triggering ADCC. FcγRIIIa is expressed primarily on natural killer (NK) cells and consists of two extracellular domains: the membrane-distal domain (D1) and membrane-proximal domain (D2).Citation1 IgG interaction with FcγRIIIa has been considered to only involve the Fc portion of IgG, thus promoting research on glycoengineering of glycans attached to the CH2 domain or the introduction of mutations into the Fc portion to enhance ADCC activity.Citation2–8 For example, IgGs with a low fucosylation level, such as mogamulizumab and obinutuzumab, lead to enhanced ADCC activity mainly because of the higher affinity of IgG toward FcγRIIIa. Moreover, recent studies suggest that IgG-FcγRIIIa interactions are related to adverse effects and immunogenicity because the FcγRIIIa-mediated cell signaling pathway can be activated by immune complexes, antibody aggregates or antibody-silicone oil droplet complexes that contain Fc portions of IgG.Citation9–11 Thus, a detailed understanding of the IgG-FcγRIIIa interaction is important for characterizing basic immunology and discovering and developing antibody drugs with higher efficacy and safety.
Crystal structures of the Fc of IgG antibodies and the FcγRIII complex have been reported. These structures have shown that the Fc portion of IgG and the D2 in FcγRIII interact,Citation12–20 but the complete interaction interface between the whole IgG (i.e., both Fab and Fc portions) and FcγRIII remains unknown. More recently, we showed that the Fab portion contributed to IgG-FcγRIIIa interactions by comparing the dwell time between IgG1s and the corresponding Fc fragments on immobilized FcγRIIIa molecules using high-speed atomic force microscopy (HS-AFM) and by conducting hydrogen/deuterium exchange mass spectroscopy (HDX-MS) for structural analysis using an anti-hepatitis A virus IgG1 antibody (PMF37).Citation21 Moreover, Shi et al.Citation22 recently reported that Fab interacts with FcγRIII, and other groups reported the interaction of Fab with FcγRIII by molecular dynamics (MD) simulations.Citation23,Citation24 Thus, Fab plays a role in IgG-FcγRIII interactions, but the spatial arrangement of IgG and FcγRIII is unclear because inconsistent results were presented among these recent studies, and the thermodynamic implications of Fab involvement in the interaction remain unresolved. Moreover, the effect of changes in the glycosylation pattern of IgG and antigen-binding to IgG on Fab-FcγRIII interactions require clarification.
Thus, we conducted and report here a comprehensive analysis of IgG-FcγRIII interactions using several marketed therapeutic antibodies with two different glycosylation. Kinetic and thermodynamic analyses were performed using bio-layer interferometry (BLI) and isothermal titration calorimetry (ITC). Structural analysis was carried out using HDX-MS and crosslinking mass spectrometry (XL-MS) to uncover the spatial arrangement of IgG and FcγRIII and interaction sites and structural changes upon formation of the complexes. As a result, we identified that two sites in Fabs participate in the IgG-FcγRIIIa interaction, and the inconsistency among previous studies is explained by a difference in the analytical methods used in each study. This report enabled us to comprehensively understand the interaction of IgG with FcγRIII, including the effect of fucosylation of IgG and antigen-binding to IgG on Fab-FcγRIII interactions.
Results
Thermodynamic and kinetic analysis of the IgG1-FcγRIIIa interaction
ITC is a robust technique to obtain thermodynamic parameters (Gibb’s energy change, ∆G; enthalpy change, ∆H; entropy change, ∆S) and the equilibrium dissociation constant (KD) associated with intermolecular interactions. Thermodynamic parameters driving the interactions between IgG and FcγRIIIa and between Fc and FcγRIIIa were compared by conducting ITC measurements using four IgG1s (rituximab: Rtx; adalimumab: Ada; trastuzumab: Trz; mogamulizumab: Mog) and the Fcs prepared from the respective IgG1s (IgG1-Fcs). All interactions between IgG1s and FcγRIIIa, and IgG1-Fcs and FcγRIIIa are driven by enthalpy, indicating non-covalent interactions such as hydrogen-bonding and electrostatic and van der Waals interactions are involved in the formation of the complexes (), S1).
Figure 1. Comparison of thermodynamic and kinetic parameters of IgG1-FcγRIIIa with that of IgG1-Fcs-FcγRIIIa obtained by (a) ITC and (b) BLI.
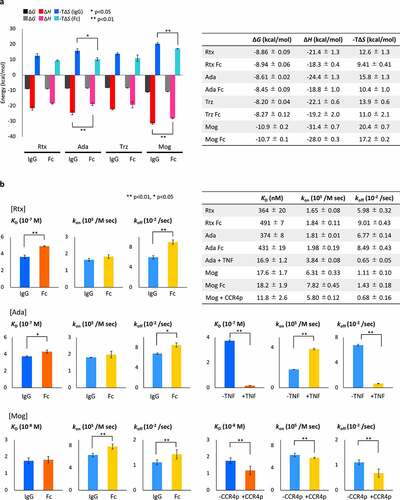
Although no significant difference of ∆G values was observed for the interactions between IgG1-FcγRIIIa and IgG1-Fc-FcγRIIIa for all IgG1s, Ada and Mog IgG1s showed significantly larger gains of enthalpy and larger losses of entropy when compared with their corresponding IgG1-Fcs. Rtx and Trz IgG1s showed larger gains of ∆H and larger losses of ∆S when compared with their corresponding IgG1-Fcs; however, the difference was statistically insignificant. The results indicate that the favorable ∆H of the IgG1-FcγRIIIa interaction, which originates from the formation of additional intermolecular interactions when compared with the corresponding IgG1-Fc-FcγRIIIa complexes, was compromised by the unfavorable ∆S, presumably because of the loss of flexibility to IgG1 upon interaction with FcγRIIIa. Interaction of Mog with FcγRIIIa caused larger changes of ∆G when compared with those of Rtx, Ada and Trz, which was ascribed to the larger gain of ∆H and is consistent with a previous report.Citation4
The effect of afucosylation of IgG on kinetic parameters of the IgG-FcγRIIIa interaction was investigated by evaluating three IgG1s, the fucosylated antibodies Rtx and Ada, and the afucosylated antibody Mog, using an orthogonal method, BLI. Biotinylated FcγRIIIa was immobilized on the sensor via biotin-streptavidin interactions to assess intermolecular interactions using Rtx, Ada and Mog and the corresponding IgG1-Fcs. Mog showed an over 20 times lower KD toward FcγRIIIa than Rtx or Ada because of the 4-fold or 3.5-fold larger association rate constant (kon) and 5-fold or 6-fold smaller dissociation rate constant (koff) (), S2). The results are consistent with a previous study showing an enhanced kon by fucose depletion.Citation4
Rearrangement of residues surrounding the N-glycan in the CH2 moiety of IgGs has been proposed as the molecular mechanism underlying the change in the affinity of IgGs toward FcγRIIIa.Citation25 Intact Rtx, Ada and Mog showed smaller koff values than their respective IgG1-Fcs, which is consistent with our previous HS-AFM results where dwell times of IgG1-Fc on FcγRIIIa were remarkably reduced when compared with those of intact IgG1s.Citation21 Kinetic analysis in solution using the KinITC method also revealed that koff values for some of the IgG1s are slightly smaller than those of the corresponding IgG1-Fcs (Figure S3).Citation26,Citation27 Mog yielded an insignificant difference in KD when compared with that of IgG1-Fc because the smaller koff for IgG1 versus Fc was compensated by the larger kon for IgG1 versus Fc.
We also investigated the influence of antigen binding to IgG on kinetic parameters of the IgG-FcγRIIIa interactions for Ada and Mog in the presence of their antigens, tumor necrosis factor (TNF) and CC chemokine receptor 4 peptide (CCR4p), respectively. In the presence of the antigens, both Ada and Mog showed significantly smaller koff values toward FcγRIIIa than those obtained without the antigens. For Ada, it is plausible that an avidity effect was responsible for the smaller koff because TNF can potentially bind two Ada molecules,Citation9 even though our native-MS confirmed that Ada mainly formed a 1:2 complex with TNF at the same concentration as HDX-MS analysis (Figure S4). However, the results of Ada and Mog indicate that antigen binding stabilizes the formation of IgG-FcγRIIIa complexes via slower dissociation rates when IgG binds to their antigens. Notably, kon increased when Ada binds to TNF, indicating that FcγRIIIa can access the binding sites on IgG without steric hindrance even when IgG binds to a trimeric protein antigen.
HDX-MS analysis of fucosylated and afucosylated IgGs
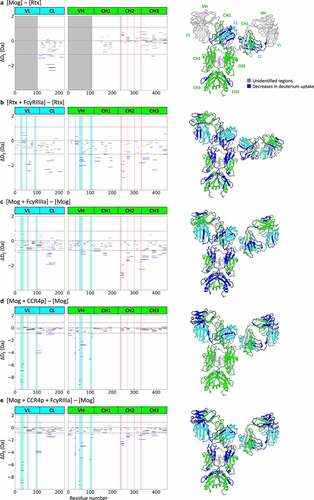
As expected, both BLI and ITC analyses demonstrated an enhanced binding affinity to FcγRIIIa for afucosylated IgG1 when compared with that of fucosylated IgG1s. Thus, the effect of fucosylation on the higher-order structure of IgGs was examined by HDX-MS using Rtx (fucosylated IgG1) and Mog (afucosylated IgG1). We calculated the accumulated deuteration difference across all HDX labeling times (ΔDΣ) on each peptide and considered differences greater or smaller than the value calculated by the t-test using the pooled standard deviations from comparing samples as significant (Tables S1–S5).Citation28 The 143 peptides monitored for deuteration had coverage of 80.8% with common peptides for the fourth framework of variable regions and the constant regions of Rtx and Mog. Unexpectedly, no significant differences in deuterium uptake were observed around the sites attached by N-glycan. Nonetheless, significant decreases in deuterium uptake were observed in Mog when compared with that of Rtx at regions distal from the glycosylation sites: E110–V120, I122–V137, K154–T183 and V201–C219 in the constant light (CL) chain and I379–N392 in the constant heavy chain 3 (CH3) domain ()).
Figure 2. HDX-MS analysis of IgG. Left panels show cumulative differences in HDX comparing (a) Mog with Rtx, (b) Rtx with Rtx binding to FcγRIIIa, (c) Mog with Mog binding to FcγRIIIa, (d) Mog with Mog binding to CCR4p and (e) Mog with Mog binding to CCR4p and FcγRIIIa. The blue-shaded regions represent the CDR based on abYsis (http://www.abysis.org/), the red-shaded regions represent the reported binding sites by Sondermann et al.,Citation12 and dashed lines represent the criteria of significant difference. The right panel shows the mapping of HDX-MS results onto homology models of Mog (a, c, d and e) and Rtx (b). Structural segments that showed decreases in deuterium uptake are shown in blue, unidentified regions in light gray, the light chain in cyan and the heavy chain in green. The homology models were built by Discovery Studio (Dassault Systèmes) using the crystal structure of the human anti-human immunodeficiency virus-1 gp120 IgG1 (PDB ID: 1HZHCitation29) as the template.
HDX-MS analysis of IgG1s in IgG1-FcγRIIIa and antigen-IgG1-FcγRIIIa interactions
The structural impact of fucosylation on the binding pattern of IgG to FcγRIIIa was further examined by comparing deuterium uptake of Rtx and Mog when free and bound to FcγRIIIa. In addition, we performed HDX-MS analysis of the antigen-IgG1-FcγRIIIa complex to reveal the effects of antigen-binding on the interaction with FcγRIIIa. In this analysis, Mog was selected because this IgG1 has a sufficiently high affinity to FcγRIIIa to perform HDX-MS under conditions where the population of the IgG1-FcγRIIIa complex can be maintained in the presence or absence of CCR4p.
Deuterium uptake of Rtx was monitored for 178 peptides commonly observed in the free and FcγRIIIa-bound state with a coverage of 84.8% for the light and heavy chains. Significant decreases in the deuterium uptake upon binding to FcγRIIIa were observed for A54–T73 in VL, Q154–T171 and V195–C213 in CL, A50–Y60 in VH, Y94–D105, V119–L146, N163–L178 and Y184–T201 in CH1, L239–M256 and V266–W281 in CH2, Y323–V352 in CH2-CH3 and I381–L402 and H433–G450 in CH3 ()).
For Mog, 227 peptides are common for all four states: free Mog, the Mog-FcγRIIIa binary complex, the CCR4p-Mog binary complex and the CCR4p-Mog-FcγRIIIa ternary complex, were identified with a coverage of 91.9% for the light and heavy chains. Comparison of free Mog with that of the Mog-FcγRIIIa complex revealed significant decreases in deuterium uptake for P12–C23 in VL, K154–T183 in CL, Y57–Y80 in VH, V115–L147 and S159–L176 in CH1, L237–M254 and V265–W279 in CH2, Y321–V350 in CH2-CH3 and W383–F406, F407–F425 and F425–G448 in CH3 ()). The binding of CCR4p to Mog resulted in a reduction in the deuterium uptake of peptides in or close to the complementary determining regions (CDR), R24–Y37 and Q95–A117 in VL and E1–S17, F27–S35, V48–T56, Y57–Y80 and Y94–F104 in VH. As for L141–T177 in CL, while no conformational change was detected in the crystal structure of the IgG-Fab-antigen complex,Citation30 less protection against deuteration was confirmed in this study ()). Antigen binding to IgG has been reported to induce allosteric conformational changes in the Fc portion.Citation31,Citation32 These changes may promote the binding of IgG to FcγRIIIa; however, no changes in the deuterium uptake were detected in the Fc portion for our HDX-MS analysis. In the presence of CCR4p, binding of FcγRIIIa to Mog yielded significant decreases in deuterium uptake, and the sites that showed decreases were essentially similar to those in Mog when CCR4p was absent ()).
Then, we examined the structural impact of binding a larger antigen than CCR4p to IgG on IgG-FcγRIIIa interactions using Ada, FcγRIIIa and TNF. For Ada, 198 peptides were common for all states: free Ada, the Ada-FcγRIIIa binary complex and the TNF-Ada binary complex, with a coverage of 86.6% for the light and heavy chains. Significant decreases in deuterium uptake upon binding to FcγRIIIa were observed for L47–F71 in VL, I117–S131 and K149–T178 in CL, L4–L18, F27–Y32, W36–E46 and I51–L79 in VH, V117–L146, N163–L178 and Y184–L197 in CH1, L239–L255, V266–W281 and Y282–T303 in CH2 and Y323–V352 in CH2-CH3 and I381–L402 and H437–K451 in CH3 (Figure S5(a)). The binding of TNF to Ada reduced deuterium uptake of peptides in or close to the CDR, L47–F71 in VL and E1–S17, F27–Y32, I51–D62, S63–L79 and L102–L108 in VH. In addition, significant decreases in the deuterium uptake were also observed for segments that are not part of the CDR: I117–S131 and L136–E161 in CL, V117–L146, N163–L178 and Y184–L197 in CH1, Y282–T303 in CH2, T311–V352 in CH2-CH3 and I381–L402 in CH3 (Figure S5(b)).
HDX-MS analysis of FcγRIIIa in IgG1-FcγRIIIa and antigen-IgG1-FcγRIIIa interactions
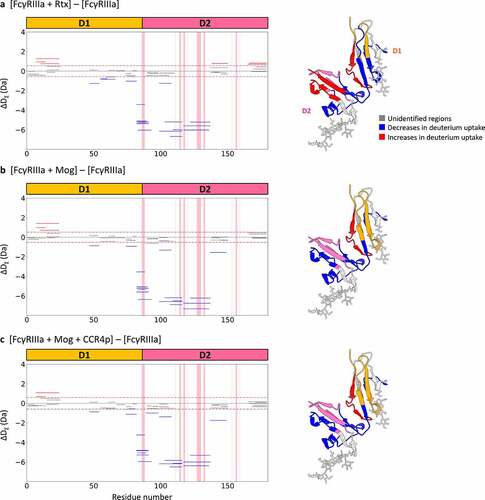
Fifty-eight peptides with a coverage of 80.5% of the total sequence were commonly detected in all states when differences in deuterium uptake of FcγRIIIa were examined. Upon binding to Rtx, significant decreases in deuterium uptake were detected in the peptides, I47–Y54, F55–E66 and S74–L82 in D1, E83–A93 in D1-D2 and R107–L116 and H117–D136 in D2, whereas V7–T24 in D1 and Y138–Y150 and V166–H179 in D2 exhibited an increase in deuterium uptake ()). Similarly, upon binding to Mog, reduced deuterium uptake was detected for I47–Y54 and S74–L82 in D1, E83–A93 in D1-D2 and R107–L116, H117–D136 and F137–S149 in D2, whereas V7–T24 in D1 showed an increase in deuterium incorporation ()). Bindings of Mog-CCR4p to FcγRIIIa resulted in significant decreases in deuterium uptake for almost the same regions as the binding state with Mog ()).
Figure 3. HDX-MS analysis of FcγRIIIa. Left panels show cumulative differences in HDX comparing (a) FcγRIIIa with FcγRIIIa binding to Rtx, (b) FcγRIIIa with FcγRIIIa binding to Mog and (c) FcγRIIIa with FcγRIIIa binding to the CCR4p-Mog complex. The red-shaded regions represent the reported binding sites by Sondermann et al.,Citation12 and dashed lines represent the criteria of significant difference. The right panel shows the mapping of HDX-MS results onto a crystal structure of FcγRIIIa extracted from the Fc-FcγRIIIa complex (PDB ID: 3AY4Citation14). Structural segments that showed decreases in deuterium uptake are shown in blue, increases in red, unidentified regions in light gray, D1 in Orange and D2 in pink.
Crosslinking (XL) analysis and protein–protein docking of the IgG1-FcγRIIIa complex
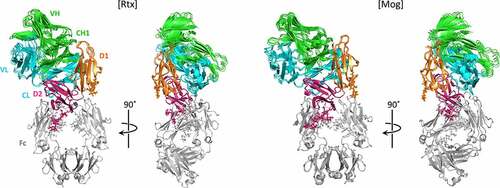
We performed XL-MS analysis for the Rtx-FcγRIIIa complex and Mog-FcγRIIIa complex using disuccinimidyl glutarate (DSG) as the XL reagent to examine the spatial arrangement of IgG-Fab in the IgG-FcγRIIIa complex. In total, 23 and 11 intermolecular crosslinks were identified for the Rtx-Fab-FcγRIIIa complex and Mog-Fab-FcγRIIIa complex, respectively (Tables S6, S7). Subsequently, protein–protein docking models were generated using HADDOCK and the XL-MS data for Rtx-Fab and Fc-FcγRIIIa and Mog-Fab and Fc-FcγRIIIa.Citation33,Citation34 Considering the flexibility of the hinge region,Citation35,Citation36 we decided not to use crystal structures of the whole IgG for the generation of the docking model. As a result, 199 structures were classified into one cluster for the Rtx-Fab-Fc-FcγRIIIa complex, and 147 structures were classified into seven clusters for the Mog-Fab-Fc-FcγRIIIa complex. shows the four best solutions from the lowest energy cluster for the Rtx-Fab-Fc-FcγRIIIa complex and Mog-Fab-Fc-FcγRIIIa complex. Both Rtx-Fab and Mog-Fab were positioned to bring the CL domain closer to FcγRIIIa, indicating that Fab was located close to FcγRIIIa in the same arrangement that the CL domain was facing FcγRIIIa, regardless of the fucosylation status under the crosslinking conditions used in this experiment.
Figure 4. Superposition of the four best solutions from the lowest energy clusters of Rtx-Fab-Fc-FcγRIIIa (left) and Mog-Fab-Fc-FcγRIIIa (right). The light chains of Fab are shown in cyan, the heavy chains of Fab in green, the Fc in light gray, D1 of FcγRIIIa in Orange and D2 of FcγRIIIa in pink.
Discussion
The interaction of IgG with FcγR had previously been widely considered to be mediated through only the Fc portion, and early structural analysis of the IgG1-Fc-FcγRIII complex revealed that the top of the CH2 domain and a part of the hinge region form the binding sites for D2 of FcγRIII. Recent findings based on experimental data from our and other groups and simulation studies on IgG-FcγRIII interactions in solution indicate that both the Fab and Fc portions are involved in the formation of the IgG1-FcγRIII complex.Citation21–24,Citation37 However, the spatial arrangement of IgG to FcγRIII and the thermodynamic parameters defining the participation of Fab in this interaction have remained unresolved. In this study, two MS methods, HDX-MS and XL-MS, and two biophysical methods, ITC and BLI, were used to acquire structural information and to determine thermodynamic and kinetic parameters of the interactions, respectively. The results revealed the structural, thermodynamic and kinetic contributions of Fab in the formation of the IgG-FcγRIIIa complex.
Detailed analysis of the HDX-MS results, as shown in , for Rtx or Mog binding to FcγRIIIa revealed significant decreases in deuterium exchange at the binding sites, which had been identified by crystal structure analysis and are included in L239–M256 and V266–W281 in CH2 and Y323–V352 in CH2-CH3 for Rtx (corresponding sites in Mog: L237–M254, V265–W279 and Y321–V350, respectively). Moreover, a decrease in deuterium exchange was also observed at Q154 – T171 in CL, V119–L146 and N163–L178 in CH1 of Fab and I381–L402 and H433–G450 in CH3 of Fc (corresponding sites in Mog: K154–T183 in CL and V115–L147 and S159–L176 in CH1 and W383–F406 and F425–G448 in CH3, respectively), which are distal from the binding sites in CH2. Our previous HDX-MS analysis also detected these segments using a fucosylated IgG1, PMF37, indicating that Fab contributes to the interaction with FcγRIIIa and allosteric conformational changes occurred upon binding to FcγRIIIa, regardless of the presence or absence of the fucose moiety at CH2. The changes in the segment V157–L164 in CH1 or the peptide containing these residues in the presence of FcγRIIIa were also detected by Houde et al.Citation37 using HDX-MS and Shi et al.Citation22 and Sun et al.Citation23 using hydroxyl radical footprinting (HRF).
As shown in , examination of the HDX results of FcγRIIIa revealed that segments including or close to the reported binding sites in the crystal structures, S74–L82, E83–A93 in D1-D2 and R107–L116 and H117–D136 in D2, showed a reduction in deuterium uptake upon binding to both Rtx and Mog. In addition, observed decreases in deuterium incorporation were commonly detected for I47–Y54 in D1 upon binding to IgG1s, suggesting FcγRIIIa interacts with IgG1 through D1 and D2. The involvement of this segment in the IgG-FcγRIIIa interaction was also found in our previous HDX-MS measurement using PMF37 and is consistent with proposed binding sites based on MD simulations.Citation21,Citation23,Citation24 Interestingly, V7–T24 in D1 commonly showed an increase in deuterium uptake upon binding to both Rtx and Mog, suggesting conformational changes at the D1-D2 interface cause a slight opening of FcγRIIIa upon binding to IgGs.
Structural differences in IgGs were also confirmed by HDX-MS analysis. Fucose depletion on the carbohydrate moieties of the CH2 domain has been reported to induce local conformational changes around glycosylation sites.Citation25,Citation38 These conformational changes stabilize the orientation of the aromatic ring of Y296, which is sandwiched between the N162 glycan and K128 in D2 of FcγRIIIa.Citation18 Such conformational changes to IgGs enhance binding affinity to FcγRIIIa and ADCC activity.Citation2,Citation4 Rtx is a fucosylated IgG1, whereas Mog is an afucosylated IgG1. Interestingly, FcγRIIIa binding reduced deuterium exchange of V195–C213 in CL and Y184–T201 in CH1 for only Rtx. F55–E66 in D1 was protected significantly only when complexed with Rtx, whereas F137–S149 in D2 was protected significantly only in complex with Mog. Comparison of the HDX-MS results between Rtx-FcγRIIIa and Mog-FcγRIIIa indicates that more protected segments in Rtx-FcγRIIIa are Fab of Rtx and D1 of FcγRIIIa, whereas those in Mog-FcγRIIIa were found to be D2 of FcγRIIIa, suggesting that afucosylation enhances Fc-D2 interactions with a slight loss of Fab binding to D1.
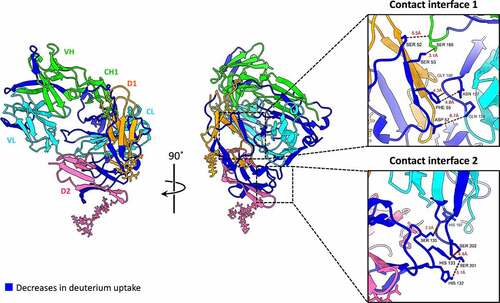
Because HDX-MS and HRF cannot provide information about the spatial arrangement of IgG and FcγRIIIa in the IgG-FcγRIIIa complex, we carried out XL-MS analyses of the IgG1-FcγRIIIa complexes. shows the mapping of the HDX-MS data of Rtx onto the Rtx-Fab-FcγRIIIa structure in the obtained docking model, which was built using constraints derived from the XL-MS results. Regions in Rtx-Fab located in close proximity to FcγRIIIa showed clear decreases in deuterium incorporation. In the modeled structures of Rtx-Fab-FcγRIIIa, two segments in the Fab portion and one region in D1 and D2 were identified as main binding sites: contact interface 1 contains residues located in or close to the protected segments Q154–T171 in CL and N163–L178 in CH1 and I47–Y54 and F55–E66 in D1, and contact interface 2 contains residues located in or close to the protected segments V195–T213 in CL and H117–D136 in D2. The distances of Q154:D57, G156:F55 and N157:F55 in CL-D1, S180:S52 and S180:S53 in CH1-D1, and H197:S135, S201:H132 and S202:H133 in CL-D2 are all within the range of 2–7 Å, supporting the participation of these amino acids in Fab-FcγRIIIa interactions. Although Fab of Mog showed a smaller number of regions with reduced deuteration incorporation when compared with that of Rtx, in the modeled structures of Mog-Fab-FcγRIIIa, K154–T183 in CL was in close proximity to I47–Y54 in D1, suggesting a similar interaction pattern of Fab in Rtx and Mog with FcγRIIIa regardless of the glycosylation moiety. However, it is difficult to reconcile the commonly protected segments in CH1, V119–L146 and N163–L178 (corresponding sites in Mog are V115–L147 and S159–L176) based on the modeled structure generated using the crosslinking constraints.
Figure 5. Mapping the HDX-MS results onto the obtained model for Fab-FcγRIIIa extracted from the best solution of the Rtx-Fab-Fc-FcγRIIIa complex. Structural segments with decreases in deuterium uptake are shown in blue, the light chains of Fab in cyan, the heavy chains of Fab in green, D1 of FcγRIIIa in Orange and D2 of FcγRIIIa in pink. The expanded views show contact interfaces 1 and 2 between Fab and FcγRIIIa.
The decreases in deuterium uptake of the segments in the CH1 domain may represent another interacting region with FcγRIIIa. This possibility is supported by previous MD simulation studies,Citation23,Citation24 which showed that the CH1 domain of IgG1 interacts with FcγRIIIa. We postulate that the absence of the modeled structure where the segments in CH1 of IgG1 is in close proximity to FcγRIIIa originates from the technical limitation of the method. In other words, the crosslinks of CL-FcγRIIIa are preferentially used as constraints because there is no spatial arrangement of Fab and FcγRIIIa that satisfies the crosslinks of both CH1-FcγRIIIa and CL-FcγRIIIa, and the number of crosslinks of CL-FcγRIIIa identified by XL-MS is larger than that of CH1-FcγRIIIa. Thus, we hypothesize that two patterns of Fab-FcγRIIIa interactions exist. However, detecting these interactions depends on the methods used, namely CL-FcγRIIIa interactions were observed by XL-MS analysis, MD simulations captured CH1-FcγRIIIa interactions, and HDX-MS evaluated both interactions.
We detected conformational changes to IgG by HDX-MS that are associated with binding to FcγRIIIa. Segments I381–L402 and H433–G450 in CH3 (corresponding sites in Mog are W383-F406 and F425–G448) were clearly protected, but these segments are most likely not directly interacting with FcγRIIIa when considering the reported crystal structures and our docking model generated using the XL-MS results.
Latypov et al.Citation39 demonstrated that unfolding of CH2 domains induced by acidic stress precedes CH3 unfolding and that eventually, two salt bridges between K248 in CH2 and E380 in CH3 and between K338 in CH2 and E430 in CH3 are disrupted because of the partial denaturation caused by the protonation of acidic residues E380 and E430 in CH3 (corresponding sites in Rtx: K252 (CH2), K344 (CH2), E384 (CH3) and E434 (CH3); and in Mog: K250 (CH2), K342 (CH2), E382 (CH3) and E432 (CH3), respectively). Additionally, our recent HDX-MS study revealed that heat-stressed IgG showed increases in deuterium exchange at two sites in the Fc portion (site 1: F235–M252 in CH2; site 2: S424–G446 in CH3) caused by the propagation of structural changes at site 1 to site 2.Citation40 Examination of the HDX-MS data showed that deuterium exchange for L239–M256 in CH2, I381–L402 and H433–G450 in CH3 (corresponding sites in Mog: L237–M254, W383–F406 and F425–G448, respectively) decreased when IgG was bound to FcγRIIIa, suggesting that structural changes to the CH2 domain induced similar conformational changes in CH3.
Interestingly, the protected segments Y323–V352 in CH2-CH3 and H433–G450 in CH3 (corresponding sites in Mog are Y321-V350 and F425–G448) include amino acids responsible for enhancing hexamerization, according to mutational analyses by Diebolder et al.Citation41 and Wang et al.,Citation42 where a triple mutant, E345R, E430G and S440Y (corresponding sites in Rtx: E349, E434 and S444; in Mog: E347, E432 and S442, respectively), showed higher C1q recruiting activity than wild-type because hexamerization ability was enhanced. Taken together, these observations suggest that a CH3 conformational change propagated from CH2 in IgG after binding to FcγRIIIa on immune cells enhances IgG clusterization on the cell surface.
We also examined structural alterations to IgG induced by antigen binding. Previously, Sela-Culang et al.Citation30 reported that antigen binding causes a structural change to the first loop in the CH1 domain (CH1_1 loop) based on comparing X-ray crystal structures of IgGs in the free-state and those in the antigen bound state. Importantly, it was proposed that the binding of large antigens such as proteins causes relatively large structural changes to the CH1_1 loop, whereas the binding of small antigens such as peptides causes only minor structural changes. This finding was partly confirmed recently by Qaraghuli et al.Citation43 This study showed that structural alternations of the constant regions in the Fab domain can be classified into three groups, depending on the antigen primary/higher-order structure. In addition, Sun et al.Citation44 reported that the peptide including the CH1_1 loop (residues 148–210) showed increased solvent accessibility upon binding to antigen by using HRF, which also supports the concept that movement of the CH1-1 loop arises from antigen binding.
In line with these previous studies, our HDX-MS data showed that binding to antigens caused a change in the deuterium uptake behavior of the Fab portion. The region in the CL domain with reduced deuterium uptake following Ada binding to TNF is almost the same region detected following Mog binding to CCR4p. In contrast, a region in CH1 of Ada with reduced deuterium uptake upon binding to TNF was not detected when Mog interacts with CCR4p. In detail, changes to I117–S131 and L136–E161 in CL caused by binding to TNF were also observed by binding to CCR4p (corresponding sites in Mog: L141–T177), whereas no changes to V117–L146, N163–L178 and Y184–L197 in CH1 were detected upon binding to CCR4p. These segments in CH1 of Ada that showed a decrease in deuterium uptake include the CH1_1 loop and other loops in the CH1 domain. HRF experiments have revealed that these segments have greater solvent accessibility upon binding to an antigen.Citation44 These results indicate that Ada binding to TNF causes structural changes to the CH1_1 loop and other parts of the CH1 domain. In contrast, binding to CCR4p caused no structural change to the CH1_1 loop. The difference in this CH1_1 loop conformational change may arise from the difference between TNF, which is a protein antigen, and CCR4p, which is a peptide antigen and is consistent with the previous report by Sela-Culang et al.Citation30 Importantly, the segments that showed a decrease in deuterium uptake in both CL and the CH1 domain of Ada also showed a decrease in deuterium uptake upon binding to FcγRIIIa. The segment with a decrease in deuterium uptake upon Mog binding to CCR4p also showed a decrease in deuterium uptake upon binding to FcγRIIIa.
Considering that koff of Ada to FcγRIIIa decreased significantly in the presence of TNF, our study has revealed that binding of TNF to Ada leads to structural changes in CL and the CH1 domains, thereby adopting a conformation in Ada that facilitates the formation of the stable TNF-Ada-FcγRIIIa complex. The significant but marginal decrease in koff of CCR4 bound Mog to FcγRIIIa when compared with that of free Mog to FcγRIIIa corresponds to the observed structural changes only in the CL domain for CCR4-Mog interactions, as measured by HDX-MS. In addition, the decrease in deuterium uptake in CH2 and CH3 domains of Ada upon binding to TNF suggests that TNF binding causes structural alterations to Fc, leading to the stabilization of the TNF-IgG-FcγRIIIa complex.
Finally, the IgG-FcγRIIIa interactions are discussed from kinetic and thermodynamic viewpoints. According to the results of BLI, both kon and koff of IgG1 were smaller than the corresponding values determined for Fc binding to FcγRIIIa, showing that IgG1 associates with and dissociates from FcγRIIIa at lower rates. However, the advantage in koff for IgG1 is compensated by the disadvantage in kon, resulting in apparently no change in KD values. Previous studies reported that the difference in koff affects the potency of IgG-mediated effector functions. For example, IgG with a slower koff for antigens increased ADCC and CDC activities because of their ability to be retained on the target cell.Citation45–47 Therefore, the lower koff for FcγRIIIa in the presence of the Fab portion suggests that Fab is not only an antigen recognition module but also modulates effector functions through kinetic stabilization of IgG-FcγRIIIa interactions that promote the formation of immune complexes and subsequent activation of FcγRIIIa. According to the ITC results, |ΔH| of the interaction between IgG1 and FcγRIIIa was larger than that of the IgG1-Fc-FcγRIIIa interaction, which is advantageous for binding. However, T|ΔS| of the IgG1 and FcγRIIIa interaction was larger than that for the IgG1-Fc-FcγRIIIa interaction, resulting in no significant change in ΔG. More flexible structures of IgG1 in the free state due to the presence of Fab portions than IgG1-Fcs may be responsible for these observed thermodynamic parameters.
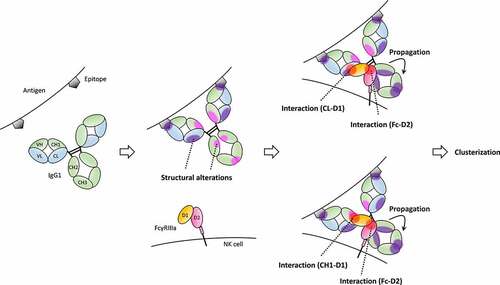
Taking our HDX-MS and XL-MS analyses together with other previous reports, we present a detailed binding model in . Initially, antigen-binding leads to structural alterations in IgG and Fab and Fc adopt slightly open conformations that facilitate FcγRIII binding. Structural alterations caused by antigen-binding differ among antigens, i.e., binding of antigen type A such as CCR4p induces structural changes in the CL domain. In contrast, binding of antigen type B such as TNF induces structural changes in the CH1, CH2 and CH3 in addition to CL. FcγRIII then binds to both Fab and Fc portions of IgG, which induces structural changes to the Fc portion, propagating from CH2 to CH3. There are two patterns of Fab-FcγRIII interactions, namely CL-FcγRIII interactions and CH1-FcγRIII interactions, which were detected by different analysis methods, i.e., HDX-MS, XL-MS and MD simulations. IgG-FcγRIII interactions are mediated mainly by the binding of Fc to D2, and Fab-FcγRIII interactions kinetically stabilize complex formation. In addition, antigen-binding to IgG causes structural alterations in the Fab portion that facilitates the formation of the antigen-IgG-FcγRIIIa complex. The extent of stabilization of the IgG-FcγRIIIa interaction in the ternary complex is dependent on the structure of the bound antigen. Such stable interactions and conformational changes to the Fc portion associated with FcγRIII-binding may lead to clusterization of the IgG-FcγRIII complex on the cell surface.
Figure 6. Proposed binding model based on our HDX-MS and XL-MS analyses with previous reports.Citation21–24,Citation37 The light chains of IgG are shown in blue, the heavy chains of IgG in green, D1 of FcγRIIIa in Orange, D2 of FcγRIIIa in pink and antigens in dark gray. Antigen-binding to IgG causes structural alterations in CL (purple-filled circles). In addition, structural alterations to CH1, CH2 and CH3 (magenta-filled circles) in addition to CL were also caused by antigen-binding depending on antigen types. Then, IgG interacts with FcγRIII through both Fab and Fc. Fab has two different patterns of interaction with FcγRIII, CL-FcγRIII and CH1-FcγRIII interactions. IgG-FcγRIII interaction is associated with structural changes to Fc that propagate from CH2 to CH3 to mediate clusterization of the IgG-FcγRIII complex on the cell surface.
This new binding model proposed in this study and derived from structural, kinetic and thermodynamic data provides new insights into IgG-FcγRIII interactions, which indicates that therapeutic antibodies are still attractive candidates that can be improved for better efficacy and safety.
Materials and methods
Sample preparation
Rituximab (Rtx), an anti-CD20 mouse/human chimeric IgG1, and trastuzumab (Trz), an anti-HER2 humanized IgG1, were purchased from Chugai Pharmaceutical Co., Ltd. Adalimumab (Ada), an anti-TNF human IgG1, was purchased from Eisai Co., Ltd. Mogamulizumab (Mog), an anti-CCR4 humanized IgG1, was purchased from Kyowa Kirin Co., Ltd. CCR4 peptides (CCR4p), the target antigen of Mog, were purchased from Science Peptide. Human soluble TNF was prepared as described in our previous study.Citation9 Human soluble FcγRIIIa, the recombinant glycoprotein with a C-terminal hexahistidine tag and two N-glycosylation sites at N43 and N160, was produced according to described methods.Citation21
Purification of IgG1 was performed by cation-exchange chromatography on a HiTrap SP HP column (GE Healthcare) to remove surfactant, which was equilibrated with 10 mM acetate buffer (Fujifilm Wako Pure Chemical Corp., 017–00256) (pH 5.0). Under these buffer conditions, IgG1 was captured on the column. The column was then washed with a buffer containing 100 mM phosphate (Fujifilm Wako Pure Chemical Corp., 192–02815 and 196–02835) (pH 8.0) and 400 mM NaCl (Fujifilm Wako Pure Chemical Corp., 191–01165) to elute IgG1 from the column.
Fcs of all IgG1s were obtained by described methods with minor modifications.Citation21 The papain digestion was carried out in the presence of cysteine at 37°C for 4 h using an activated enzyme (0.1 mg/mL papain) (Sigma-Aldrich, P3125-100 MG) in 100 mM phosphate buffer (pH 6.5) and 100 mM L-cysteine (Sigma-Aldrich, C7477-25 G) to IgG1 ratio of 1:100. IgG1s were dissolved with 100 mM phosphate buffer (pH 6.5) to 10 mg/mL (Ada, Rtx and Trz) or 2.5 mg/mL (Mog). The digestion was terminated by adding N-ethylmaleimide (Tokyo Chemical Industry Co. Ltd., E0136) to a final concentration of 30 mM. Acquisition of Fc from the digested protein was performed by size exclusion chromatography using a HiLoad Superdex 200 pg column (GE Healthcare) equilibrated with 50 mM Tris-HCl buffer (pH 9.0) (Nacalai Tesque Inc., 35,406–75) and connected to an AKTAprime plus (GE Healthcare) to separate papain and the mixture of Fab and Fcs. Separation of Fc and Fabs was performed by anion-exchange chromatography (HS-AFM) using a HiTrap Q HP column (GE Healthcare) that was equilibrated with 20 mM Tris-HCl buffer (pH 8.5) and then washed with 20 mM Tris-HCl (pH 8.5) and 1 M NaCl buffer.
Purified FcγRIIIa, Rtx, Ada, Mog, their Fcs, CCR4p and TNF were dialyzed against 10-fold diluted phosphate-buffered saline (PBS) (10×, pH 7.4) (Thermo Fisher Scientific, Inc., 70,011–044) at 4°C overnight. In contrast, Trz was dialyzed against 20 mM Tris-HCl (pH 8.0), 150 mM NaCl and 0.005% polysorbate 20 at 4°C overnight. Protein samples were concentrated to their optimal concentrations for each measurement by ultrafiltration using Amicon Ultra Centrifugal filter devices (Merck).
Isothermal titration calorimetry
The dialyzed IgG or Fc solution (8 μM) (Ada, Trz and Rtx) was loaded into the cell of an iTC200 (MicroCal LLC). The dialyzed Mog sample was loaded into the cell of a MicroCal PEAQ-ITC (Malvern Panalytical). The titration was started with an initial injection of 1 μL (Ada, Trz and Rtx) or 0.5 µL (Mog) of FcγRIIIa (100 μM), followed by 19 injections of 2 μL (Ada, Trz and Rtx) or 39 injections of 1 μL (Mog). Injections were made every 120 s at 298 K. The thermograms were analyzed using the NITPIC program (version 1.3.0, May 2019). The normalized peak area plots obtained from thermogram analysis were fitted with the A + B ⇄ AB interaction model using the SEDPHAT program (version 15.2, December 2018). KinITC analysis was performed by AFFINImeter (https://www.affinimeter.com/, Version 1.2.3., Software for Science Developments, Santiago de Compostela, Spain).Citation26,Citation27
Biolayer interferometry
High-throughput on an Octet HTX system (Sartorius) can address up to 96 samples in parallel, and High Precision Streptavidin (SAX) biosensors were used for BLI measurements. Before each assay, SAX biosensor tips were pre-wetted in 200 µL buffer for at least 10 min. The measurements were performed at 30°C. In the first assay step, a baseline was established using HBS-P+ buffer (Cytiva, BR100827; 0.01 HEPES, 0.15 M NaCl and 0.05% (v/v) Surfactant P20) for 90s, followed by the capture of the biotinylated FcγRIIIa. Then, a second baseline was acquired using HBS-P+, followed by the association and dissociation of IgG1 samples. The dilution series of IgG1 and IgG1-Fc were two-fold of 2000 nM for Rtx and Ada or 250 nM for Mog. The affinity of Ada or Mog toward FcγRIIIa in the presence of antigens was evaluated by adding 1 µM TNF to the 250 nM Ada sample or 500 nM CCR4p to the 250 nM Mog sample. The regeneration step was conducted using 1 M MgCl2 (Fujifilm Wako Pure Chemical Corp., 136–03995) after the cycle, and the same samples were measured three times (n = 3).
Hydrogen/deuterium exchange mass spectrometry
HDX-MS measurements were performed with an automated HDx3 system (LEAP Technologies) set up with the syringe chiller. The protein solutions were diluted 10-fold with deuterated PBS (pD 7.4). Deuterated samples were incubated at 20°C for various reaction periods (41, 60, 180, 600, 3,600 or 14,400 s). Accurate comparisons between different states by HDX-MS for all IgG1-FcγRIIIa and CCR4p-Mog-FcγRIIIa interaction experiments were achieved by carefully adjusting IgG1, FcγRIIIa, CCR4p and TNF concentrations using the KD values estimated from ITC measurements that give the values of protein–protein interactions in solution without immobilization or modification of proteins. For IgG1 analysis, we mixed IgG1, FcγRIIIa or specific antigens at these final concentrations: Rtx (0.7 μM) and FcγRIIIa (11.8 μM); Mog (0.7 μM) and FcγRIIIa (1.0 μM); Mog (0.7 μM) and CCR4p (1.0 μM); Mog (0.7 μM), FcγRIIIa (1.0 μM) and CCR4p (1.0 μM); Ada (0.7 μM) and FcγRIIIa (11.6 μM); and Ada (0.7 μM) and TNF (6.3 μM). For FcγRIIIa analysis, we mixed IgG1, FcγRIIIa or CCR4p at these final concentrations: Rtx (24.9 μM) and FcγRIIIa (4.9 μM); Mog (5.3 μM) and FcγRIIIa (4.9 μM); and Mog (5.3 μM), FcγRIIIa (4.9 μM) and CCR4p (5.4 μM).
The exchange reaction was quenched at 0°C by lowering the pH to 2.5 by mixing an equal volume of 200 mM sodium dihydrogen phosphate dihydrate (Fujifilm Wako Pure Chemical Corp., 19,202,815), 4 M guanidine hydrochloride (Fujifilm Wako Pure Chemical Corp., 070–01825) and 400 mM Tris (2-carboxyethyl) phosphine hydrochloride (Fujifilm Wako Pure Chemical Corp., 205–10,863) to the diluted protein samples. Quenched samples were digested online with the immobilized pepsin column, Enzymate BEH Pepsin Column (2.1 mm × 30 mm) (Waters Corp.). The digested peptides were then trapped and desalted with Acclaim PepMap300 C18 5 μm (1 × 15 mm) (Thermo Fisher Scientific, Inc.) and separated with Hypersil Gold (1 × 50 mm, 1.9 μm) (Thermo Fisher Scientific, Inc.). Those LC treatments were performed by using a Dionex Ultimate 3000 (Thermo Fisher Scientific, Inc.).
For digestion, trapping and desalting, the loading pump was set at 100 μL/min for 4 min with the aqueous phase adjusted to pH 2.5 using formic acid (Kanto Chemical Co., Inc., 16,233–96). For separation, the gradient pump was set to run a 9 min gradient from 8% to 30% with 100% acetonitrile in 0.1% formic acid (Kanto Chemical Co., Inc., 01922–63). For decreasing carry-over, the pepsin column was washed by using an automated system with two wash solutions reported previously.Citation48 In addition, all systems and lines were washed each time between sample measurements by injecting 2 M guanidine hydrochloride in 100 mM phosphate buffer (pH 2.5) and two 4 min gradients from 8% to 90% with 100% acetonitrile in 0.1% formic acid. Mass spectrometric analyses were performed using a Q Exactive HF-X (Thermo Fisher Scientific, Inc.) with the capillary temperature set to 275°C, a resolution of 120,000 and a mass range (m/z) of 220–2000. We checked back exchange by measuring deuterated cytochrome C (Sigma Aldrich, C7752-50 MG) for 43,200 s. The calculated back-exchange ratio using the identified 65 peptides was 41%, which is in the acceptable range recommended by Masson et al.Citation49
Peptide identification using non-deuterated samples was performed by Proteome Discoverer 2.4 (Thermo Fisher Scientific, Inc.). The HD-Examiner version 3.2.1 (Sierra Analytics) was used to calculate the HDX ratio of each identified peptide from the MS raw data files of all HDX experiments. The HDX measurement of each sample for each time point was performed in triplicate. The accumulated deuteration difference across all HDX labeling times (ΔDΣ) on each peptide was considered significant when the difference was greater or smaller than the calculated criteria. The criteria were set to 5-fold the calculated values, which were calculated by the t-test based on the pooled standard deviations of comparing two samples using an in-house python 3 script (Tables S1–S5, Figures S6–S10).Citation28 Structural visualizations were performed with UCSF ChimeraX version 1.2.Citation50,Citation51
Crosslinking mass spectrometry
DSG (Thermo Fisher Scientific, Inc., A35392), which was dissolved in dimethyl sulfoxide (DMSO) (Fujifilm Wako Pure Chemical Corp., 043–07216) to 500 mM and diluted using 20 mM HEPES (Thermo Fisher Scientific, Inc., 15630106), was added to 20 mM HEPES containing different IgG concentrations (2, 5, 7.5, 10, 20, 30, 40 μM). The concentration of DSG was 100-fold higher than the protein concentrations. SDS-PAGE was performed for all mixtures, which were incubated at room temperature for 30 min and added to 250 mM Tris-HCl to stop the reaction. As this control, inter-crosslinked IgGs were observed for 5 μM or more Rtx and 2 μM or more Mog, and SDS-PAGE samples were prepared using 20 mM HEPES containing Rtx (1 μM) and FcγRIIIa (3 μM), and Mog (1 μM) and FcγRIIIa (1.5 μM). These samples showed the formation of the crosslinked IgG-FcγRIIIa complex and a few inter-crosslinked IgGs (Figure S11). Therefore, we applied this condition for MS analysis.
After terminating the crosslink reactions, the mixtures were concentrated using a vacuum dryer and passed through Microbiospin columns (BioRad) to remove excess crosslinking reagents. Subsequently, each sample was concentrated and then denatured by adding 50 μL 8 M Urea (Sigma Aldrich, U0631-500 G) and 50 mM ammonium bicarbonate (ABC) (Fujifilm Wako Pure Chemical Corp., 018–21742). Samples were incubated with 50 mM dithiothreitol (Nacalai Tesque Inc., M1A5983) at 56°C for 1 h and then with 50 mM iodoacetamide (Fujifilm Wako Pure Chemical Corp., CAR7811) at room temperature and in darkness for 45 min. After dilution with 1 M Urea to a final ABC concentration of 50 mM, 10 μL of 100 μg/50 mM Trypsin/LysC acetic acid solution was added to the samples (Thermo Fisher Scientific, Inc., A40009) and incubated overnight at 37°C. The digested samples were then dried using a vacuum dryer and resuspended in 50 μL 5% DMSO/10% formic acid/85% H2O. The resuspended solutions were loaded onto the SCX Stage Tip (GL Science Inc.), washed with 20% acetonitrile/0.4% formic acid and eluted with 20, 50, 200, 500, and 1000 mM ammonium acetate (Sigma Aldrich, A2706-100ML). The eluted samples were dried using a vacuum dryer and resuspended in 5% DMSO/10% formic acid/85% H2O for injection into an LC-MS/MS system.
LC treatment was performed using the Easy-n LC1200 system (Thermo Fisher Scientific, Inc.). The trap column (0.075 × 20 mm, Thermo Fisher Scientific, Inc.) and the packed emitter column (0.075 × 150 mm, Nikkyo Technos Co., Ltd) were used for desalination and separation. Mobile phase A was water with 0.1% formic acid, and mobile phase B was water/acetonitrile (2/8) with 0.1% formic acid. LC conditions used for separation were 300 nL/min with a 40 min gradient of 5%–95% mobile phase B. Mass spectrometric analyses were performed using an Orbitrap Eclipse (Thermo Fisher Scientific, Inc.). Full MS scans were performed at an Ion Transfer Tube temperature of 305°C for Rtx samples or 300°C for Mog samples. The resolution was 60,000, the mass range (m/z) was 380–1600, and funnel RF level was 30. A subsequent ddMS/MS scan was performed by higher energy collisional dissociation with stepped collision energies 25% and 30% and resolution 30,000. Data analysis was performed using XlinkX installed in Proteome Discoverer 2.4 (Thermo Fisher Scientific, Inc.), and IgG-FcγRIIIa inter-crosslinks with a score higher than 20 were used for protein–protein docking.
Molecular docking based on restraints of XL-MS
Only a single crystal structure of IgG1 (PDB ID:1HZH) has been reported. However, previous and recent studies indicate variation in the location of Fab relative to Fc because of the flexible hinge regions of IgG1.Citation35,Citation36 Therefore, we used the Fab for protein–protein docking. The crystal structures of the Fab of Rtx (PDB ID: 4KAQ) and fucosylated Fc-FcγRIIIa (PDB ID: 3SGJ) were used as initial structures for generating the Rtx-Fab-Fc-FcγRIIIa model. For Mog-Fab-Fc-FcγRIIIa, the homology model of the Fab of Mog implemented in Discovery Studio version 20.1 (Dassault Systèmes) using the crystal structure of Rtx Fab (PDB ID: 4KAQ), and afucosylated Fc-FcγRIIIa (PDB ID: 3AY4) were chosen as the initial structures. The missing electron density of the FcγRIIIa receptor (i.e., residues G31–T40) in 3AY4 was supplemented using Alphafold2,Citation52 and the structure was energy minimized using the YASARA server.Citation53 Residues that may contribute to protein–protein interactions were selected by DisVis for the calculations based on the criteria that their percent solvent accessibility surface was 25% or more for Rtx, Mog and FcγRIIIa.Citation33,Citation54,Citation55 Crosslinking restraints were then selected by verification using DisVis for inter-crosslinks between Rtx-Fab and FcγRIIIa or Mog-Fab and FcγRIIIa. HADDOCK was used for docking with a maximum distance limitation of 24 Å (Nε-Nε distance) and the default analysis parameters.Citation33,Citation34,Citation56 Structural visualization was performed with PyMOL Molecular Graphics System, version 2.0 (Schrödinger, LLC).
Native mass spectrometry
Original buffers of Ada or TNF were exchanged to 150 mM ammonium acetate (Sigma-Aldrich, A2706) using a Bio-Spin 6 column with an Mw cut-off of 10 kDa (Bio-Rad Laboratories, Inc.). The mixture of Ada (0.7 μM) and TNF (6.3 μM) was prepared and incubated on ice for 20 min to characterize the binding stoichiometry of Ada-TNF complexes. Five-microliter samples were loaded into gold glass capillaries made in-house for nano-electrospray ionization. Mass spectrometric analyses were performed using a Q Exactive UHMR (Thermo Fisher Scientific, Inc.) in the positive ionization mode with a spray voltage of 1.5 kV, source DC offset of 100 V, HCD voltage of 40 V and trapping gas pressure setting of 7.0. The spectra were calibrated using 4 mg/mL cesium iodide and analyzed using BioPharma Finder software 3.2 (Thermo Fisher Scientific, Inc.).
Notes on Contributions
Y.Y. and S.U. conceived and designed the study. R.Y. and S.Y. expressed and purified FcγRIIIa. Y.Y. conducted HDX-MS experiments. Y.Y., N.W., M.S. and T.M. performed ITC experiments. N.W. performed BLI measurements. Y.Y., M.I., K.S. and D.H. performed XL-MS experiments. M.I. and S.Y. performed protein–protein docking. H.N. performed native-MS experiments. Y.Y, T.T., S.Y., K.K. and S.U. mainly drafted the manuscript.
Abbreviations
| IgG | = | immunoglobulin G |
| Fab | = | antigen binding fragment |
| ADCC | = | antibody-dependent cellular cytotoxicity |
| CDC | = | complement-dependent cytotoxicity |
| FcγR | = | Fc gamma receptor |
| NK cell | = | natural killer cell |
| D1 | = | membrane-distal domain of FcγRIIIa |
| D2 | = | membrane-proximal domain of FcγRIIIa |
| PMF37 | = | anti-hepatitis A virus IgG1 antibody |
| HDX-MS | = | hydrogen/deuterium exchange mass spectroscopy |
| MD simulations | = | molecular dynamics simulation |
| BLI | = | bio-layer interferometry |
| ITC | = | isothermal titration calorimetry |
| XL-MS | = | crosslinking mass spectrometry |
| Rtx | = | rituximab |
| Ada | = | adalimumab |
| Trz | = | trastuzumab |
| Mog | = | mogamulizumab |
| CCR4p | = | CC chemokine receptor 4 peptide |
| TNF | = | tumor necrosis factor |
| CDR | = | complementary-determining regions |
| CL | = | constant light chain |
| CH | = | constant heavy chain |
| DSG | = | disuccinimidyl glutarate |
| HRF | = | hydroxyl radical footprinting |
| PBS | = | phosphate-buffered saline |
| HS-AFM | = | high-speed atomic force microscopy |
Supplemental Material
Download MS Word (17.3 MB)Supplemental Material
Download Zip (5.2 MB)Acknowledgments
We thank Terry Zhang and Rosa Viner (Thermo Fisher Scientific, USA) and Yoshiki Nagashima and Shio Watanabe (Thermo Fisher Scientific, Japan) for their help with HDX-MS and XL-MS measurements, respectively. We also thank Jun Hasegawa (Osaka University) for support in protein modeling, Yuta Okamoto (Osaka University) for help with Ada-TNF interaction analysis, Yusuke Maruyama (Sartorius, Japan) for help with BLI measurements and Juan Sabin (Software 4 Science Developments, S.L., Spain) for support with KinITC analysis. We thank Janez Konc (The Chair of Pharmaceutical Chemistry, National Institute of Chemistry, Slovenia) for providing the PDB files of their MD simulation.Citation24 Molecular graphics and analysis were carried out with UCSF ChimeraX, which was developed by the Resource for Biocomputing, Visualization, and Informatics at the University of California, San Francisco, with support from National Institutes of Health R01-GM129325 and the Office of Cyber Infrastructure and Computational Biology, National Institute of Allergy, and Infectious Diseases. Moreover, we thank Yukiko Isono (Institute for Molecular Science) for help in protein expression and purification. We thank Edanz (https://jp.edanz.com/ac) for editing a draft of this manuscript.
Disclosure statement
No potential conflict of interest was reported by the author(s).
Supplementary material
Supplemental data for this article can be accessed on the publisher’s website.
Additional information
Funding
References
- Caaveiro JMM, Kiyoshi M, Tsumoto K. Structural analysis of Fc/FcγR complexes: a blueprint for antibody design. Immunol Rev. 2015;268(1):201–15. doi:10.1111/imr.12365. PMID: 26497522.
- Shields RL, Lai J, Keck R, O’Connell LY, Hong K, Gloria Meng Y, Weikert SHA, Presta LG. Lack of fucose on human IgG1 N-linked oligosaccharide improves binding to human FcγRIII and antibody-dependent cellular toxicity. J Biol Chem. 2002;277(30):26733–40. doi:10.1074/jbc.M202069200. PMID: 11986321.
- Shinkawa T, Nakamura K, Yamane N, Shoji-Hosaka E, Kanda Y, Sakurada M, Uchida K, Anazawa H, Satoh M, Yamasaki M, et al. The absence of fucose but not the presence of galactose or bisecting N-acetylglucosamine of human IgG1 complex-type oligosaccharides shows the critical role of enhancing antibody-dependent cellular cytotoxicity. J Biol Chem. 2003;278(5):3466–73. doi:10.1074/jbc.M210665200. PMID: 12427744.
- Okazaki A, Shoji-Hosaka E, Nakamura K, Wakitani M, Uchida K, Kakita S, Tsumoto K, Kumagai I, Shitara K. Fucose depletion from human IgG1 oligosaccharide enhances binding enthalpy and association rate between IgG1 and FcγRIIIa. J Mol Biol. 2004;336(5):1239–49. doi:10.1016/j.jmb.2004.01.007. PMID: 15037082.
- Subedi GP, Barb AW. The immunoglobulin G1 N-glycan composition affects binding to each low affinity Fc γ receptor. MAbs. 2016;8(8):1512–24. doi:10.1080/19420862.2016.1218586. PMID: 27492264.
- Dekkers G, Treffers L, Plomp R, Bentlage AEH, de Boer M, Koeleman CAM, Lissenberg-Thunnissen SN, Visser R, Brouwer M, Jy M, et al. Decoding the human immunoglobulin G-glycan repertoire reveals a spectrum of Fc-receptor- and complement-mediated-effector activities. Front Immunol. 2017;8:877. doi:10.3389/fimmu.2017.00877. PMID: 28824618.
- Shields RL, Namenuk AK, Hong K, Meng YG, Rae J, Briggs J, Xie D, Lai J, Stadlen A, Li B, et al. High resolution mapping of the binding site on human IgG1 for FcγRI, FcγRII, FcγRIII, and FcRn and design of IgG1 variants with improved binding to the FcγR. J Biol Chem. 2001;276(9):6591–604. doi:10.1074/jbc.M009483200. PMID: 11096108.
- Mimoto F, Igawa T, Kuramochi T, Katada H, Kadono S, Kamikawa T, Shida-Kawazoe M, Hattori K. Novel asymmetrically engineered antibody Fc variant with superior FcγR binding affinity and specificity compared with afucosylated Fc variant. MAbs. 2013;5(2):229–36. doi:10.4161/mabs.23452. PMID: 23406628.
- Krayukhina E, Noda M, Ishii K, Maruno T, Wakabayashi H, Tada M, Suzuki T, Ishii-Watabe A, Kato M, Uchiyama S. Analytical ultracentrifugation with fluorescence detection system reveals differences in complex formation between recombinant human TNF and different biological TNF antagonists in various environments. MAbs. 2017;9(4):664–79. doi:10.1080/19420862.2017.1297909. PMID: 28387583.
- Tada M, Aoyama M, Ishii-Watabe A. Fcγ receptor activation by human monoclonal antibody aggregates. J Pharm Sci. 2020;109(1):576–83. doi:10.1016/j.xphs.2019.10.046. PMID: 31676270.
- Krayukhina E, Yokoyama M, Hayashihara KK, Maruno T, Noda M, Watanabe H, Uchihashi T, Uchiyama S. An assessment of the ability of submicron- and micron-size silicone Oil Droplets in dropped prefillable syringes to invoke early- and late-stage immune responses. J Pharm Sci. 2019;108(7):2278–87. doi:10.1016/j.xphs.2019.02.002. PMID: 30790580.
- Sondermann P, Huber R, Oosthulzen V, Jacob U. The 3.2-Å crystal structure of the human IgG1 Fc fragment-FcγRIII complex. Nature. 2000;406(6793):267–73. doi:10.1038/35018508. PMID: 10917521.
- Radaev S, Motyka S, Fridman WH, Sautes-Fridman C, Sun PD. The structure of a human Type III Fcγ receptor in complex with Fc. J Biol Chem. 2001;276(19):16469–77. doi:10.1074/jbc.M100350200. PMID: 11297532.
- Mizushima T, Yagi H, Takemoto E, Shibata-Koyama M, Isoda Y, Iida S, Masuda K, Satoh M, Kato K. Structural basis for improved efficacy of therapeutic antibodies on defucosylation of their Fc glycans. Genes to Cells. 2011;16(11):1071–80. doi:10.1111/j.1365-2443.2011.01552.x. PMID: 22023369.
- Ferrara C, Grau S, Jäger C, Sondermann P, Brünker P, Waldhauer I, Hennig M, Ruf A, Rufer AC, Stihle M, et al. Unique carbohydrate-carbohydrate interactions are required for high affinity binding between FcγRIII and antibodies lacking core fucose. Proc Natl Acad Sci U S A. 2011;108(31):12669–74. doi:10.1073/pnas.1108455108. PMID: 21768335.
- Mimoto F, Kadono S, Katada H, Igawa T, Kamikawa T, Hattori K. Crystal structure of a novel asymmetrically engineered Fc variant with improved affinity for FcγRs. Mol Immunol. 2014;58(1):132–38. doi:10.1016/j.molimm.2013.11.017. PMID: 24334029.
- Ahmed AA, Keremane SR, Vielmetter J, Bjorkman PJ. Structural characterization of GASDALIE Fc bound to the activating Fc receptor FcγRIIIa. J Struct Biol. 2016;194(1):78–89. doi:10.1016/j.jsb.2016.02.001. PMID: 26850169.
- Sakae Y, Satoh T, Yagi H, Yanaka S, Yamaguchi T, Isoda Y, Iida S, Okamoto Y, Kato K. Conformational effects of N-glycan core fucosylation of immunoglobulin G Fc region on its interaction with Fcγ receptor IIIa. Sci Rep. 2017;7(1):1–10. doi:10.1038/s41598-017-13845-8. PMID: 29062024.
- Falconer DJ, Subedi GP, Marcella AM, Barb AW. Antibody fucosylation lowers the FcγRIIIa/CD16a affinity by limiting the conformations sampled by the N162-glycan. ACS Chem Biol. 2018;13(8):2179–89. doi:10.1021/acschembio.8b00342. PMID: 30016589.
- Kiyoshi M, Caaveiro JMM, Tada M, Tamura H, Tanaka T, Terao Y, Morante K, Harazono A, Hashii N, Shibata H, et al. Assessing the heterogeneity of the Fc-glycan of a therapeutic antibody using an engineered FcγReceptor IIIa-immobilized column. Sci Rep. 2018;8(1):3955. doi:10.1038/s41598-018-22199-8. PMID: 29500371.
- Yogo R, Yamaguchi Y, Watanabe H, Yagi H, Satoh T, Nakanishi M, Onitsuka M, Omasa T, Shimada M, Maruno T, et al. The Fab portion of immunoglobulin G contributes to its binding to Fcγ receptor III. Sci Rep. 2019;9(1):11957. doi:10.1038/s41598-019-48323-w. PMID: 31420591.
- Shi L, Liu T, Gross ML, Huang Y. Recognition of human IgG1 by Fcγ receptors: structural insights from hydrogen-deuterium exchange and fast photochemical oxidation of proteins coupled with mass spectrometry. Biochemistry. 2019;58(8):1074–80. doi:10.1021/acs.biochem.8b01048. PMID: 30666863.
- Sun Y, Izadi S, Callahan M, Deperalta G, Wecksler AT. Antibody–receptor interactions mediate antibody-dependent cellular cytotoxicity. J Biol Chem. 2021;297(1):100826. doi:10.1016/j.jbc.2021.100826. PMID: 34044019.
- Kralj S, Hodošček M, Podobnik B, Kunej T, Bren U, Janežič D, Konc J. Molecular dynamics simulations reveal interactions of an IgG1 antibody with selected Fc receptors. Front Chem. 2021;9:705931. doi:10.3389/fchem.2021.705931. PMID: 34277572.
- Matsumiya S, Yamaguchi Y, Saito JI, Nagano M, Sasakawa H, Otaki S, Satoh M, Shitara K, Kato K. Structural comparison of fucosylated and nonfucosylated Fc fragments of human immunoglobulin G1. J Mol Biol. 2007;368(3):767–79. doi:10.1016/j.jmb.2007.02.034. PMID: 17368483.
- Burnouf D, Ennifar E, Guedich S, Puffer B, Hoffmann G, Bec G, Disdier F, Baltzinger M, Dumas P. KinITC: a new method for obtaining joint thermodynamic and kinetic data by isothermal titration calorimetry. J Am Chem Soc. 2012;134(1):559–65. doi:10.1021/ja209057d. PMID: 22126339.
- Dumas P, Ennifar E, Da Veiga C, Bec G, Palau W, Di Primo C, Piñeiro A, Sabin J, Muñoz E, Rial J. Extending ITC to Kinetics with kinITC. Methods Enzymol. 2016;567:157–80. doi:10.1016/bs.mie.2015.08.026. PMID: 26794354.
- Weis DD. Recommendations for the propagation of uncertainty in hydrogen exchange-mass spectrometric measurements. J Am Soc Mass Spectrom. 2021;32(7):1610–17. doi:10.1021/jasms.0c00475. PMID: 33764776.
- Saphire EO, Parren PWHI, Pantophlet R, Zwick MB, Morris GM, Rudd PM, Dwek RA, Stanfield RL, Burton DR, and Wilson IA. Crystal structure of a neutralizing human IgG against HIV-1: a template for vaccine design. Science. 2001;293(5532):1155–59. doi:10.1126/science.1061692. PMID: 11498595.
- Sela-Culang I, Alon S, Ofran Y. A systematic comparison of free and bound antibodies reveals binding-related conformational changes. J Immunol. 2012;189(10):4890–99. doi:10.4049/jimmunol.1201493. PMID: 23066154.
- Zhao J, Nussinov R, Ma B. Antigen binding allosterically promotes Fc receptor recognition. MAbs. 2019;11(1):58–74. doi:10.1080/19420862.2018.1522178. PMID: 30212263.
- Orlandi C, Deredge D, Ray K, Gohain N, Tolbert W, DeVico AL, Wintrode P, Pazgier M, Lewis GK. Antigen-induced allosteric changes in a human IgG1 Fc increase low-affinity Fcγ receptor binding. Structure. 2020;28(5):516–527.e5. doi:10.1016/j.str.2020.03.001. PMID: 32209433.
- Honorato RV, Koukos PI, Jiménez-García B, Tsaregorodtsev A, Verlato M, Giachetti A, Rosato A, Bonvin AMJJ. Structural biology in the clouds: the WeNMR-EOSC ecosystem. Front Mol Biosci. 2021;8:72953. doi:10.3389/fmolb.2021.729513. PMID: 34395534.
- Van Zundert GCP, Rodrigues JPGLM, Trellet M, Schmitz C, Kastritis PL, Karaca E, Melquiond ASJ, Van Dijk M, De Vries SJ, Bonvin AMJJ. The HADDOCK2.2 web server: user-friendly integrative modeling of biomolecular complexes. J Mol Biol. 2016;428(4):720–25. doi:10.1016/j.jmb.2015.09.014. PMID: 26410586.
- Zhang X, Zhang L, Tong H, Peng B, Rames MJ, Zhang S, Ren G. 3D structural fluctuation of IgG1 antibody revealed by individual particle electron tomography. Sci Rep. 2015;5(1):09803. doi:10.1038/srep09803. PMID: 25940394.
- Jay J, Bray B, Qi Y, Igbinigie E, Wu H, Li J, Ren G. IgG Antibody 3D Structures and Dynamics. Antibodies. 2018;7(2):18. doi:10.3390/antib7020018. PMID: 31544870.
- Houde D, Peng Y, Berkowitz SA, Engen JR. Post-translational modifications differentially affect IgG1 conformation and receptor binding. Mol Cell Proteomics. 2010;9(8):1716–28. doi:10.1074/mcp.M900540-MCP200. PMID: 20103567.
- Yanaka S, Yogo R, Inoue R, Sugiyama M, Itoh SG, Okumura H, Miyanoiri Y, Yagi H, Satoh T, Yamaguchi T, et al. Dynamic views of the Fc region of immunoglobulin G provided by experimental and computational observations. Antibodies. 2019;8(3):39. doi:10.3390/antib8030039.
- Latypov RF, Hogan S, Lau H, Gadgil H, Liu D. Elucidation of acid-induced unfolding and aggregation of human immunoglobulin IgG1 and IgG2 Fc. J Biol Chem. 2012;287(2):1381–96. doi:10.1074/jbc.M111.297697. PMID: 22084250.
- Noda M, Ishii K, Yamauchi M, Oyama H, Tadokoro T, Maenaka K, Torisu T, Uchiyama S. Identification of IgG1 aggregation initiation region by hydrogen deuterium mass spectrometry. J Pharm Sci. 2019;108(7):2323–33. doi:10.1016/j.xphs.2019.02.023. PMID: 30851343.
- Diebolder CA, Beurskens FJ, De Jong RN, Koning RI, Strumane K, Lindorfer MA, Voorhorst M, Ugurlar D, Rosati S, Heck AJR, et al. Complement is activated by IgG hexamers assembled at the cell surface. Science (80-). 2014;343(6176):1260–63. doi:10.1126/science.1248943. PMID: 24626930.
- Wang G, de Jong RN, van den Bremer ETJ, Beurskens FJ, Labrijn AF, Ugurlar D, Gros P, Schuurman J, Parren PWHI, Heck AJR. Molecular basis of assembly and activation of complement component C1 in complex with immunoglobulin G1 and antigen. Mol Cell. 2016;63(1):135–45. doi:10.1016/j.molcel.2016.05.016. PMID: 27320199.
- Al Qaraghuli MM, Kubiak-Ossowska K, Ferro VA, Mulheran PA. Antibody-protein binding and conformational changes: identifying allosteric signalling pathways to engineer a better effector response. Sci Rep. 2020;10(1):1–10. doi:10.1038/s41598-020-70680-0. PMID: 32792612.
- Sun Y, Estevez A, Schlothauer T, Wecksler AT. Antigen physiochemical properties allosterically effect the IgG Fc-region and Fc neonatal receptor affinity. MAbs. 2020;12(1):1–9. doi:10.1080/19420862.2020.1802135. PMID: 32795110.
- Reusch U, Burkhardt C, Fucek I, Le Gall F, Le Gall M, Hoffmann K, Knackmuss SHJ, Kiprijanov S, Little M, Zhukovsky EA. A novel tetravalent bispecific TandAb (CD30/CD16A) efficiently recruits NK cells for the lysis of CD30 + tumor cells. MAbs. 2014;6(3):727–38. doi:10.4161/mabs.28591. PMID: 24670809.
- Zhao Q, Ahmed M, Tassev DV, Hasan A, Kuo TY, Guo HF, O’Reilly RJ, Cheung NKV. Affinity maturation of T-cell receptor-like antibodies for Wilms tumor 1 peptide greatly enhances therapeutic potential. Leukemia. 2015;29(11):2238–47. doi:10.1038/leu.2015.125. PMID: 25987253.
- Teeling JL, French RR, Cragg MS, Van Den Brakel J, Pluyter M, Huang H, Chan C, Parren PWHI, Hack CE, Dechant M, et al. Characterization of new human CD20 monoclonal antibodies with potent cytolytic activity against non-Hodgkin lymphomas. Blood. 2004;104(6):1793–800. doi:10.1182/blood-2004-01-0039. PMID: 15172969.
- Majumdar R, Manikwar P, Hickey JM, Arora J, Middaugh CR, Volkin DB, Weis DD. Minimizing carry-over in an online pepsin digestion system used for the H/D exchange mass spectrometric analysis of an IgG1 monoclonal antibody. J Am Soc Mass Spectrom. 2012;23(12):2140–48. doi:10.1007/s13361-012-0485-9. PMID: 22993047.
- Masson GR, Burke JE, Ahn NG, Anand GS, Borchers C, Brier S, Bou-Assaf GM, Engen JR, Englander SW, Faber J, et al. Recommendations for performing, interpreting and reporting hydrogen deuterium exchange mass spectrometry (HDX-MS) experiments. Nat Methods. 2019;16(7):595–602. doi:10.1038/s41592-019-0459-y. PMID: 31249422.
- Goddard TD, Huang CC, Meng EC, Pettersen EF, Couch GS, Morris JH, Ferrin TE. UCSF ChimeraX: meeting modern challenges in visualization and analysis. Protein Sci. 2018;27(1):14–25. doi:10.1002/pro.3235. PMID: 28710774.
- Pettersen EF, Goddard TD, Huang CC, Meng EC, Couch GS, Croll TI, Morris JH, Ferrin TE. UCSF ChimeraX: structure visualization for researchers, educators, and developers. Protein Sci. 2021;30(1):70–82. doi:10.1002/pro.3943. PMID: 32881101.
- Jumper J, Evans R, Pritzel A, Green T, Figurnov M, Ronneberger O, Tunyasuvunakool K, Bates R, Žídek A, Potapenko A, et al. Highly accurate protein structure prediction with AlphaFold. Nature. 2021;596(7873):583–89. doi:10.1038/s41586-021-03819-2. PMID: 34265844.
- Krieger E, Koraimann G, Vriend G. Increasing the precision of comparative models with YASARA NOVA - A self-parameterizing force field. Proteins Struct Funct Genet. 2002;47(3):393–402. doi:10.1002/prot.10104. PMID: 11948792.
- van Zundert GCP, Bonvin AMJJ. DisVis: quantifying and visualizing accessible interaction space of distance-restrained biomolecular complexes. Bioinformatics. 2015;31(19):3222–24. doi:10.1093/bioinformatics/btv333. PMID: 26026169.
- van Zundert GCP, Trellet M, Schaarschmidt J, Kurkcuoglu Z, David M, Verlato M, Rosato A, Bonvin AMJJ. The DisVis and PowerFit web servers: explorative and integrative modeling of biomolecular complexes. J Mol Biol. 2017;429(3):399–407. doi:10.1016/j.jmb.2016.11.032. PMID: 27939290.
- Leitner A, Walzthoeni T, Kahraman A, Herzog F, Rinner O, Beck M, Aebersold R. Probing native protein structures by chemical cross-linking, mass spectrometry, and bioinformatics. Mol Cell Proteomics. 2010;9(8):1634–49. doi:10.1074/mcp.R000001-MCP201. PMID: 20360032.