
ABSTRACT
N-terminal heterogeneity resulting from non-uniform signal peptide (SP) cleavage can potentially affect biologics property attributes and result in extended product development timelines. Few studies are available on engineering SPs systematically to address miscleavage issues. Herein, we developed a novel high throughput computational pipeline capable of generating millions of SP mutant sequences that uses the SignalP 5.0 deep learning model to predict which of these mutants are likely to alleviate the N-terminal miscleavage in antibodies. We optimized the parameters to target mutating one or two amino acids at the C-terminus of 84 unique SPs, exhausting all theoretically possible combinations and resulting in a library of 296,077 unique wildtype and mutant signal peptides for in silico screening of each antibody. We applied this method to five antibodies against different targets, with various extent of miscleavage (2.3% to 100%) on their Lambda light chains. In each case, multiple SP mutants were generated, with miscleavage reduced to a non-detectable level and titers comparable with or better than that of the original SPs. Pairwise mutational analysis using an in silico library enriched with high-scoring mutants revealed patterns of amino acids at the C-terminus of SPs, providing insights beyond the “Heijne rule”. To our knowledge, no similar approach that combines high throughput in silico mutagenesis and screening with SP cleavage prediction has been reported in the literature. This method can be applied to both the light chain and heavy chain of antibodies, regardless of their initial extent of miscleavage, provides optimized solutions for individual cases, and facilitates the development of antibody therapeutics.
Abbreviations: Aa, amino acids; CHO, Chinese hamster ovary; CNN, convolutional neural network; CSscore, cleavage site score; CSV, comma-separated values; HC, heavy chain; HEK, human embryonic kidney; HPLC, high-performance liquid chromatography; IgG, immunoglobulin G; IGLV, immunoglobulin G Lambda variable; LC, light chain; LCMS, liquid chromatography–mass spectrometry; MS, mass spectrometry; PCR, polymerase chain reaction; PBS, phosphate-buffered saline; PEI, polyethylenimine; SP, signal peptide; SPase, signal peptidase; TCEP, tris(2-carboxyethyl) phosphine; TOF, time-of-flight.
Introduction
The majority of secretory proteins in bacteria, Archaea, and Eukarya, as well as some transmembrane and intracellular proteins, carry a short peptide averaging 16–30 amino acids in length at the N-terminus.Citation1–5 This peptide, called the signal peptide (SP), serves as the address label marking the translocation and secretion pathways of premature proteins. In mature proteins, SPs are cleaved by one of the three types of signal peptidase (SPase) – type I, II, and IV.Citation6 SPases bind primarily to the last three to seven residues located at the C-terminus of the SP (also known as the C-region). This region, along with the N-terminus of the mature protein, plays an important role in determining the cleavage sites.Citation6
Due to their role in protein translocation and secretion, SPs have been widely used in the production of recombinant proteins. Efforts to engineer SPs are primarily focused on enhancing protein expression levels. Because SP cleavage is the rate-limiting step in protein secretion, cleavage efficiency affects production titer.Citation7 To increase the titer of recombinant proteins in bacteria, yeast, or mammalian cells, a number of studies used methods that screened either small sets of native, heterologous SPs,Citation8 or combinations of such SPs and promoters.Citation9–12 Other studies involved creating random or site-specific mutagenic libraries of SPs via PCR, and then testing the mutants for their ability to improve titer.Citation13–16
A much less investigated aspect of SP engineering is creating mutant SPs to correct the N-terminal miscleavage of proteins. N-terminal miscleavage results in either truncation (amino acids missing from the N-terminus of the mature protein) or extension (overhangs of extra amino acids at the N-terminus of the mature protein), leading to undesired product heterogeneity that potentially affects the function of biologic products, especially antibodies. For example, in their developability assessment of a human IgG1 antibody produced by Chinese hamster ovary (CHO) cells, Gibson et al. discovered that the N-terminal truncation of the antibody Lambda light chain can be addressed by either replacing the original murine-derived SP with a human IGLV1 germline SP, or by mutating the N-terminus SYE motif of the light chain.Citation17
Experimental analysis of SP cleavage sites through cloning, protein production, and liquid chromatography–mass spectrometry (LC-MS) requires extensive effort. To facilitate this process, in silico tools have been developed to predict SP cleavage sites. Examples include convolutional neural network (CNN) models DeepSigCitation18 and SigUNet,Citation19 sequence alignment model Signal-Blast, Bayesian classifier Signal-BNF,Citation20 and dynamic Bayesian network model Philius.Citation21 More recently, Signal-3 L 3.0 integrated CNN with self-attention and conditional random field to achieve robust performance.Citation22 SignalP 5.0, a deep neural network model combined with conditional random field, consistently ranks among the top in benchmark studies across various organisms.Citation22–24 SignalP 5.0 was trained on 20,785 proteins, and is able to predict cleavage by type I and II SPases in the Sec and Tat secretory pathways (i.e., Sec/SPI, Sec/SPII, Tat/SPI). Optimized transfer learning conferred SignalP 5.0 the ability to predict on multiple organisms, including Eukarya, Archaea, Gram-positive and Gram-negative bacteria.Citation23 SignalP 5.0, as well as its previous versions (3.0 and 4.0), have been used in a few studies to aid the screening of wildtype signal peptides for improved secretory production of recombinant proteins and antibody fragments in E. coli,Citation25,Citation26 yeast,Citation27 and Leishmania torentolae.Citation28
Despite these advances, very few studies have used in silico tools in a systematic way to engineer SPs that can address N-terminal miscleavage of proteins. In this study, we developed a novel high throughput computational pipeline that is capable of generating millions of SP mutants and uses SignalP 5.0 to screen and predict which of these mutants are likely to alleviate the N-terminal miscleavage in antibodies. This pipeline is highly efficient, capable of creating mutants, predicting the probability of correct SP cleavage, and analyzing/rank ordering the results in a batch. We optimized its parameters to target one or two amino acid positions at the C-terminus of each of the 84 unique wildtype SPs, most of which derived from human germline V-gene alleles, exhausting all theoretically possible combinations and resulting in a library of 296,077 unique wildtype SPs and their mutants for in silico screening of each input protein. We applied this method to five antibodies against different targets with various extents of N-terminal miscleavage. In each case, we obtained multiple SP mutants that successfully reduced miscleavage to a non-detectable level, while maintaining titers similar to or better than the original. Further mechanistic studies using an in silico library enriched with high-scoring SP mutants revealed patterns of amino acids at the C-terminus of SPs.
Results
Comparison of CS scores of heavy chains, Lambda light chains, and Kappa light chains from an in-house collection of antibodies
To identify the antibodies that likely have SP miscleavage issues, using the computational pipeline, we analyzed an in-house collection of antibodies (19,151 heavy chains; 11,250 Kappa chains; and 1,169 Lambda chains), with SPs commonly used for antibody production. The Cleavage Site (CS) score produced by the SignalP 5.0 model ranges from 0 to 1 and represents the predicted marginal probability that cleavage happens at a site. The higher the CS score, the higher the marginal probability that a cleavage happens at a specific site. For each residue in the input sequence, the SignalP 5.0 model produces a CS score, but a high CS score may not always represent the correct cleavage site. For the rest of the study, all mentions of CS score refer to the score at the correct cleavage site. As shown in Supp. , the CS scores of the heavy chain (median 0.97) and Kappa chains (median 0.95) were more tightly packed between 0.8 to 1, while the scores of the Lambda light chains (median 0.72) spread from 0.4 to 1. The result suggested that the Lambda light chains were more prone to miscleavage than Kappa or heavy chains.
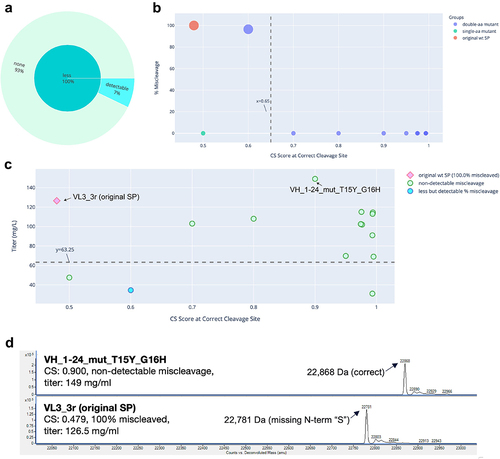
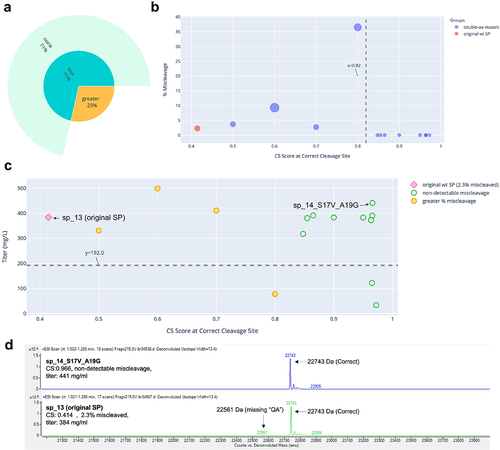
Figure 1. Miscleavage and titer of SP mutants of mAb 1. A: Sunburst plot showing fraction of SP mutants having greater (Orange) or less (turquoise) percentage of miscleavage by MS, compared to that of the original SP. These are displayed in the inner circle. Among those with less miscleavage, percentage (calculated as fraction of all mutants tested) of mutants with non-detectable miscleavage (light green), or detectable but less miscleavage (light blue) are displayed in the outer circle. B: Bubble plot of CS score at the correct cleavage site vs percentage of miscleavage on MS. Color of the dots represents the original SP, single aa or double aa mutants. Size of the dots represents the number of miscleavage sites. The smallest dots have zero miscleavage product (i.e., 0% miscleaved). Dashed line represents a threshold of the CS score as explained in the text. C: Scatter plot of CS score at the correct cleavage site vs titer. Marker style represents the original SP, mutant SP with non-detectable, less but detectable, equal, or more miscleavage compared to that of the original SP. The original SP and the best mutant SP (non-detectable miscleavage and the highest titer) were labeled. Dash line represents the half of the titer of the original SP. Green dots above the dash line were mutants with non-detectable miscleavage and titers comparable or better than that of the original SP. D: Representative MS analysis of the original SP and the best mutant SP.
Impact of the number of residues at the N-terminus of the mature protein on the CS score
Five antibodies against different targets were selected for this study (). These antibodies have unique Lambda light chains (Supp. ). These Lambda light chains demonstrated various extent of miscleavage (2.3% to 100% miscleaved) as confirmed by LC-MS. Before we conducted in silico mutagenesis of SPs to address the miscleavage issue, we first investigated the number of residues at the N-terminus of the Lambda chain to use in the input sequence. The maximum length of the input sequence (SP plus mature protein) allowed by the SignalP 5.0 model is 70 aa. Consequently, for each antibody, we tested a range of lengths of N-terminus of the mature Lambda chain, from 5 to 51 aa, capping the length of the entire input sequence at 70 aa. The results showed that the number of residues at the N-terminus of the protein affected the CS score, and this effect is most prominent with sequences shorter than 10 residues (Supp. ). Because SPs naturally have various lengths, for convenience of computation, in the rest of the study, we simply used the longest possible length (70 minus the length of the SP) for the mature protein in the input sequence.
Table 1. Summary of MS cleavage and production titers of the SP mutants tested
Figure 2. Miscleavage and titer of SP mutants of mAb 2. Descriptions for plots A, B, C, and D were the same as that in . In plot C, green dots circled in dash are the mutants with non-detectable miscleavage and greater than 2-fold improvement of titer, compared to the original SP.
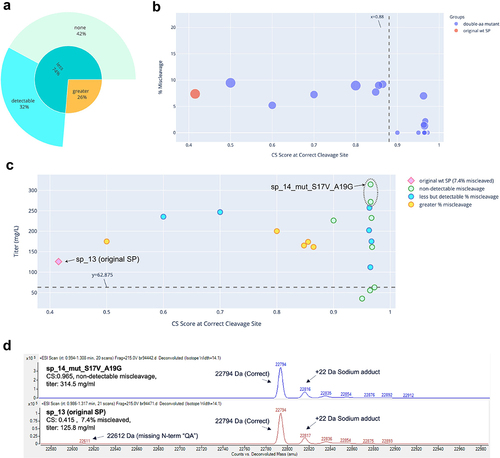
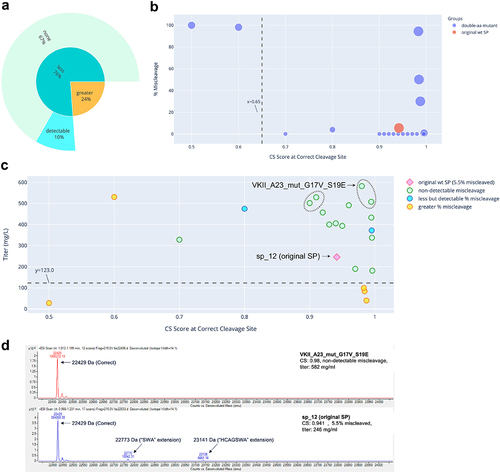
Figure 3. Miscleavage and titer of SP mutants of mAb 3. Descriptions for plots A, B, C, and D were the same as that in . In plot C, green dots circled in dash are the mutants with non-detectable miscleavage and greater than 2-fold improvement of titer, compared to the original SP.
Percentage of mutant SPs in the in silico library with CS scores above 0.8
Previous studies on SP engineering involved manual selection and testing of mutants, which is largely a trial-and-error process.Citation17 To demonstrate the possible outcomes of randomly generated SP mutants, using a collection of 84 unique wildtype SPs described in Supp Table 2, we introduced one or two mutations among the last five amino acids at the C-terminus of each SP, exhausting all theoretical combinations. The sequences were then filtered to retain only the unique ones, resulting in a final SP library of 295,993 SP mutants and 84 wildtype SPs. Using the computational pipeline, we screened each of the five Lambda light chains using the same SP library. By integrating the areas under the kernel density plots, which estimate probability distributions, we discovered that, among the 296,077 unique SP wildtype and mutants generated for each of five antibodies, only 2% to 27% (mean 11.8%) of SP mutants have CS scores greater than 0.8 (Supp. ). This suggests that most of the randomly designed SP mutants had medium to low CS scores, and therefore might still be prone to miscleavage. Another observation is that the CS score is dependent not only on the SP sequence, but also on the sequence of the N-terminus of the mature protein. Because the same SP library was used in screening, the only difference is the N-terminal sequence of the antibody light chains. This difference resulted in the various shapes of the kernel density plots, and consequently the different chances of finding high-scoring mutants. Notably, mAb 5 and mAb 2 antibodies had a similar N-terminus, where the first 23 amino acids were the same and the sequences differed only after that (Supp. ). Their kernel density curves overlapped with each other, and the probability of finding high-scoring mutants was 2% for both antibodies. Taken together, the data indicate that computationally ranking the randomly generated SP mutants is necessary, in order to sort out the small populations of the high-scoring mutants. This process needs to be performed for each protein with a unique N-terminus, because a high-scoring SP mutant in one case might not be applicable to another case.
Figure 4. Miscleavage and titer of SP mutants of mAb 4. Descriptions for plots A, B, C, and D were the same as that in .
Impact of the number of mutations on the CS score
We investigated the effect of the number of mutations (0, 1 or 2) on the predicted CS scores of SP mutants. In each of the five antibodies, the median CS score consistently decreased as the number of mutations increased (Supp. ), suggesting that in general, random mutations in the −4 to 0 region incur undesirable effects that reduce the predicted cleavage specificity of the SPs. For each antibody, we ranked all 296,077 wildtype and mutants descending by their CS scores at the correct cleavage site. No wildtype SP was found among the top 100 mutants in any of the five antibodies we tested. Interestingly, among the top 100 (0.03%) mutants, at least 95% of them were double amino acid (double aa) mutants, and the rest were single amino acid (single aa) mutants (Supp. ). This indicated that while double aa mutagenesis resulted in a lower CS score overall, it also produced the majority of the top scoring mutants.
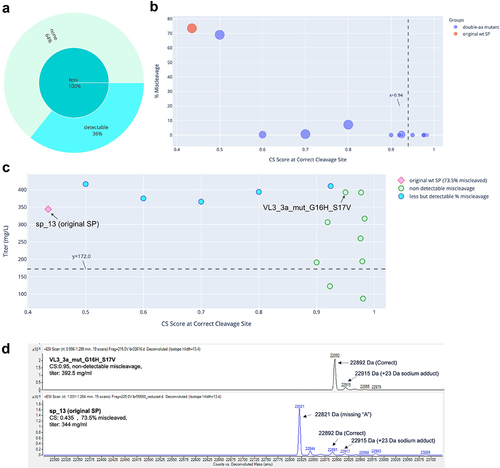
Figure 5. Miscleavage and titer of SP mutants of mAb 5. Descriptions for plots A, B, C, and D were the same as that in .
Improvement of the CS score with single and double aa mutations
Two strategies are commonly used in mutagenesis. The first strategy involves conducting mutagenesis step by step. For example, wildtype SPs are screened first, then only the best wildtype SPs are moved forward as templates for creating single aa mutants. Subsequently, only the best single aa mutants are moved forward for the next round of mutagenesis. In the second strategy, all wildtype SPs and their theoretically possible single and double aa mutants are generated and screened. Here, we demonstrated that the second approach is preferred for in silico SP screening. In Supp. , four wildtype SPs were selected: sp_10, sp_15, VL3_3 l, and VL10_10a. CS scores from the wildtype SP, as well as its highest-scoring single aa mutant and its highest-scoring double aa mutant were plotted. SP sp_15 had the highest score among the selected wildtype SPs. As for sp_10, it had a lower score to start with, but its best double aa mutant was on par with that from sp_15. In addition, VL3_3I and VL10_10a had extremely low scores (< 0.06) as wildtypes. However, their best double aa mutants were able to reach scores between 0.71–0.98, a significant improvement compared to their wildtypes. The results suggest that it is possible to convert a low-scoring SP to a high-scoring one with one to two mutations. As a result, even though covering all theoretically possible mutants demands more computational time, it is still desirable as it avoids missing potentially high-scoring mutants.
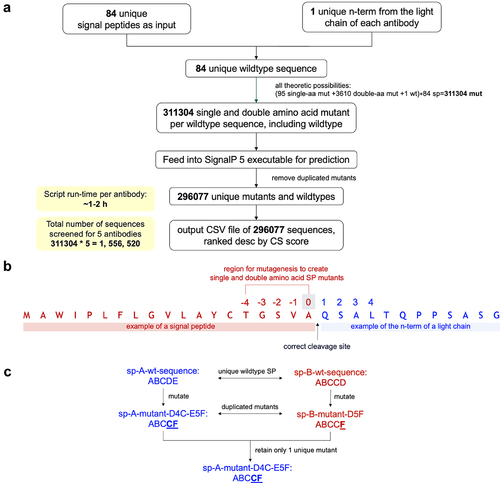
Figure 6. Overview of the computational pipeline. A: The python package “sp” was developed and integrated with SignalP 5.0 executable to build the complete pipeline from mutant generation to prediction and analysis. B: Numbering scheme used in the “sp” package. Region from position −4 to 0 was used for creating single and double aa SP mutants. C: Illustration of the concept of duplicated mutants generated from the mutagenesis of unique wildtype SPs. Only one of the duplicated mutants was retained for analysis, so that the final output of 296,077 wildtypes and mutants contained only unique SP sequences.
Experimental validation of the computational pipeline
The five antibodies were expressed and characterized. Three of them (mAb 2, mAb 4, and mAb 5) were initially expressed using wildtype SP sp_13. mAb 3 was initially expressed using wildtype SP sp_12 and mAb 1 using wildtype SP VL3_3 r. The absolute value of the CS scores for these wildtype SPs appeared to have little correlation with the percentage of miscleavage observed on MS. For example, mAb 1 and mAb 5 had similar scores (0.479 vs 0.414). However, mAb 1 was nearly 100% miscleaved, while mAb 5 was only 2.3% miscleaved. In addition, mAb 3 and mAb 2 had very different scores (0.941 vs 0.415), but their percentages of miscleavage were similar (5.5% vs 7.4%) (). This can be explained by the fact that the SignalP 5.0 model was trained as a multi-label classifier (i.e., probability of cleavage at a specific site) rather than a regressor based on MS cleavage data. As a result, the absolute value of the CS score is not predictive of the actual percentage of the miscleavage on MS.
Because of this limitation, we adopted a method of relative comparison. Our hypothesis is that, for a given antibody, regardless of the absolute value of the CS score of the original SP, if we can generate a SP mutant with a CS score higher than that of the original SP (i.e., a marginal probability of cleavage closer to 1), then the SP mutant will be more likely to cleave at the correct location, and consequently the miscleavage events will be less likely to happen elsewhere. To verify this hypothesis, we ranked the mutants in descending order according to the CS scores. For each antibody, we selected some SP mutants from the top of this list (scores > 0.9), and then randomly picked SP mutants with scores in the 0.5–0.9 range. We expressed and characterized the five antibodies using a total of 82 SP mutants (14 for mAb 1, 19 for mAb 2, 21 for mAb 3, 14 for mAb 4, and 14 for mAb 5). All these mutants but one were double aa mutants.
The results are summarized in , and raw data provided in Supp. . For each antibody, we obtained multiple SP mutants (42% to 93% of the mutants tested) that successfully addressed the miscleavage issue, with no detectable miscleavage peaks on MS. Detailed analyses of the mutants screened for mAb 1, mAb 2, mAb 3, mAb 4, and mAb 5 are displayed in , respectively. Specifically, in all mutants screened for mAb 1 and mAb 4, the percentage of miscleavage was reduced compared to that of the original SP (). On the other hand, among the mutants screened for the other three antibodies, there was a mixture of reduced and increased miscleavage events ( and ).
In general, it was difficult to establish a universal threshold of the CS score, above which all clones showed non-detectable miscleavage. In some cases, a threshold could be established for one antibody, but it had to be modified for another antibody. For example, a cutoff score could be established at approximately 0.65 for mAb 1 (), but needed to be raised to 0.82 for mAb 5 () and 0.94 for mAb 4 (). On the other hand, it is difficult to establish such a threshold for mAb 2 and mAb 3 because there were some SP mutants that scored very high, but still showed various degrees of miscleavage (). Regardless, a trend was consistent across all five antibodies: it was more likely to find SP mutants with non-detectable miscleavage among the highest-scoring clones. For example, in this study, we tested mutants with CS scores ranging from 0.5 to 0.996. If we had only tested mutants with CS scores of at least 0.9, the success rate of identifying mutants with non-detectable miscleavage and titers comparable to or better than that of original SP would be much higher (, last 2 columns). As a result, our recommended approach is to select a panel of mutants with the top-ranked CS scores (e.g., the top 10 mutants) for production and testing. While this approach does not guarantee that all the selected mutants will have non-detectable miscleavage, it is likely that we can find at least a few mutants that have mitigated the miscleavage issue, as demonstrated by all five antibodies in this study.
Previous studies showed that changes in the SP sequence could potentially affect expression titer.Citation8–10 To investigate the effect of SP mutations on titer, we plotted the CS score versus titer for each clone. Little correlation was found between these two variables ( – 5C), which can be explained by the fact that the SignalP 5.0 model was not trained on titer, therefore the CS score does not provide information on titer. Nevertheless, for each antibody, we discovered multiple SP mutants that not only reduced miscleavage to a non-detectable level, but also maintained titers from transient production comparable (within twofold) to that of the original SP. These clones were represented by green circles above the dash lines in – 5C and summarized in . Two mutants for mAb 2 antibody (, circled in dash) and four mutants for mAb 3 antibody (, circled in dash) not only successfully addressed the miscleavage issue, but also improved the titers by more than twofold. Representative MS analysis for the original SP and the best mutant SP (highest titer and non-detectable miscleavage) were displayed for each antibody ( – 5D). These results clearly demonstrated the success of our method, which may potentially offer a universal mitigation platform.
To aid the selection of mutants for future studies, we analyzed titers of all 87 antibodies (including those with the original SPs). The mutants were grouped by the wildtype SPs from which they were derived. The fold change in titer was calculated by dividing the titer of a given antibody produced with a mutant SP, by the titer of the same antibody produced with its original SP. In this way, the difference among the antibodies was normalized. As shown in Supp. Figure 7, some SPs and their mutants appeared to generate lower titers on average (e.g., sp_12, VKII_A18), while some appeared to generate higher titers on average (e.g., sp_14, VH_3-53). Because the number of antibodies produced per SP is relatively small, additional studies are needed to elucidate how SP mutagenesis affects the titer of antibodies.
Pairwise mutational analysis of amino acid patterns at the C-terminus of SPs
The −4 to 0 region () of the SP has been reported to contain the binding sites of SPasesCitation6 and therefore plays an important role in determining the cleavage specificity. Previous efforts studying the pattern of amino acids in this region resulted in the “Heijne rule”, which states that position 0 (i.e., last amino acid) and position −2 (i.e., third amino acid from the last) favor non-charged amino acid.Citation29–32 This rule was derived from statistical analysis of a small number of functional SPs. In this study, we took a different approach to analyze the preferred amino acids in this region. We asked the question whether the top-scoring mutants in the double aa mutagenesis library preferred mutations at certain positions, and if so, what these mutations were. To answer this question, first, pairwise mutational analysis was conducted by calculating the percentage of each of the 10 possible pairs of locations for double aa mutations. The 10 location pairs were equally distributed among the 288,900 unique double aa SP mutants (Supp. Figure 8). However, when narrowing down to the top-scoring 100 (0.035%) double aa mutants, a preference was observed for mutation combinations primarily at positions (−1, 0), (−2, −1), and (−4, 0). For mAb 4 antibody, a strong preference was also observed for mutations at (−4, −2) position.
Next, we analyzed the distribution of 20 amino acids at (−1, 0), (−2, −1), (−4, 0), and (−4, −2) locations, among all double aa mutants and the top-scoring 800 (0.28%) double aa mutants. The top 800 double aa mutants were used for this analysis in order to cover the theoretical diversity by 2 fold because in the pairwise analysis, each position could have one of the 20 amino acids, therefore a total of 400 pairs of amino acids were possible. The results showed that, among all double aa mutants generated in silico, the distribution of amino acids was random. However, when narrowing down to the top 800 double aa mutants, preferences for certain amino acids were observed (Supp. Figure 9A through 9D). Specifically, only non-charged (i.e., aliphatic or polar) amino acids such as AGSPQ were enriched among the top 800 mutants at position 0. In addition, only non-charged amino acids such as ACGISTV were enriched at position −2. These observations were consistent with the “Heijne rule”. On the other hand, for position −1 and position −4, both of which were less studied in the literature, we observed enrichment of amino acids with different physicochemical properties, e.g., non-charged, negatively charged, positively charged, aromatic. These data indicated that position 0 and −2 preferred non-charged amino acids, while positions −1 and −4 were more promiscuous.
There were two notable phenomena. First, given a specific location pair, the enrichment trends were generally consistent across different antibodies, though the actual percentage of a specific amino acid pair might vary slightly. For example, in Supp. Fig 9A, similar sets of hotspots (A/G/S at position 0 paired with different amino acids at position −1) were found across different antibodies, though there were variations in the intensity of these hotspots. For mAb 2 and mAb 5, in addition to these hotspots, low levels of enrichment were also observed for P/Q at position 0 paired with different amino acids at position −1. Second, given a specific antibody, similar conclusions could be made on the enrichment at a specific location, across different location pairs. For example, for the mAb 1 antibody, Supp. Fig 9A (−1, 0) and Supp. Figure 9C (−4, 0) evaluated different location pairs, but revealed a similar conclusion for the pattern of enrichment at position 0 (preference for AGS). Taken together, the results suggested that the enrichment patterns hold regardless of location pairs or antibodies analyzed.
Discussion
Miscleavage of SPs of recombinant monoclonal antibodies is not uncommon, and it may contribute to product heterogeneity and complicate the development process. Mutagenesis of SPs can mitigate this risk, though it is a trial-and-error process. In this study, we demonstrated the utility of a novel computational pipeline integrated with the SignalP 5.0 deep learning model for high-throughput generation and screening of SP mutants to address the N-terminal miscleavage issue in antibodies. Five antibodies with various degrees of miscleavage (2.3% to 100% miscleaved) were selected for validating this approach. An in silico library of 296,077 unique wildtype and SP mutants was generated from single and double aa mutagenesis at the C-terminus of each of the 84 unique wildtype SPs, exhausting all theoretically possible combinations. For each antibody, we were able to identify multiple SP mutants that successfully reduced the miscleavage to a non-detectable level, while maintaining similar or better titers.
Lambda antibodies were chosen as the focus of this study for several reasons. First, Lambda light chains appear to be more prone to miscleavage than Kappa or heavy chains. Secondly, these antibodies had significant variation in the levels of miscleavage as determined by MS (2.3% to 100%). Success in each case shows that this method can be applied to antibodies regardless of their initial extent of miscleavage. Finally, these antibodies have different mature N-terminal sequence and target specificity. This demonstrates that the method is applicable to different antibodies. We have also applied it to solving the miscleavage of a heavy chain (data not shown).
There are several considerations when using this computational pipeline. First, full coverage of all theoretically possible mutants is important to avoid loss of diversity. Second, while the pipeline allows up to five mutations within the −4 to 0 region, in practice we recommend mutating one or two amino acids per SP in the first trial. This is because, as the number of mutations per SP increases, the overall CS score decreases, reflecting a surge of low-scoring mutants. At least in this study, we were able to obtain single and double aa mutants with undetectable miscleavage and good titers. Third, even though the SignalP 5.0 model outputs a CS score for each amino acid in the input sequence, only the CS score at the correct cleavage site (i.e., position 0 of the SP) is used for ranking the mutants. Ranking the mutants by CS scores other than that from the correct cleavage site can result in prioritizing mutants that have reduced miscleavage at one site, but increased miscleavage at other sites. Finally, because there is a greater chance of finding successful SP mutants among the highest-scoring ones, our recommended approach is to rank the SP mutants by their CS scores in descending order and select a panel of mutants from the top of the list for in vitro production and evaluation. As shown in , by prioritizing mutants with higher CS scores, mutants with non-detectable miscleavage and good titers are identified at higher rates. While this approach does not guarantee that all selected mutants will have non-detectable miscleavage products, it is likely that you can find some that have mitigated the miscleavage issue with minimal impact on the expression.
Two aspects of our study are novel. First, we used high throughput in silico mutagenesis and screening to optimize SPs for their cleavage specificity. Very few studies on engineering SP to address N-terminal miscleavage issues are available in the literature. Previous efforts primarily focused on mutating or truncating the N-terminus of the mature protein, or manually mutating one aa at a time for the SPs, or selecting a different wildtype SP. These methods have drawbacks. For example, mutations or truncations at the N-terminus of the mature protein might interfere with its function or increase its immunogenicity risk. In addition, functional studies need to be repeated for the mutant protein due to changes in its sequence, resulting in a delayed development timeline and requirement of additional resources. On the other hand, manually designing SP mutations has a relatively low chance of success. Studies have shown that the N-terminus of the mature protein is involved in SPase recognition.Citation6 This implies that the optimal SP needs to be determined case-by-case in the context of specific mature protein sequences, thus there might not be a single solution that fits all. Our computational pipeline can address these concerns by performing large-scale, high throughput in silico screening of SP mutants. It can be applied to different proteins, providing an optimized solution in each case, and substantially saving time and resources. Second, our study is the first to conduct pairwise mutational analysis on the pattern of amino acids in the −4 to 0 region of the SP. Previous studies from Heijne et al. used small datasets of 65 to 188 functional SPs to perform statistical analysis on the preferred amino acids at single locations.Citation30–32 Our approach involves a much larger dataset, consisting of the top-scoring 800 (0.28%) mutants enriched from an initial library of 288,900 double aa SP mutants. It improves our understanding of the amino acid composition at the C-terminus of SPs.
There are several caveats of this method. First, as discussed earlier, the absolute CS score correlates poorly with the actual percentage of cleavage based on MS analysis data. As a result, inference about the percentage of miscleavage cannot be reliably made based on CS score alone. Second, not all the highest-scoring SP mutants will have reduced or non-detectable miscleavage. Moreover, because SignalP 5.0 does not have the ability to predict titer, some of the mutants might have low titers. Third, we observed that the length of the N-terminus of the mature protein affects the CS score, and this effect is most prominent with sequences shorter than 10 residues. While the degree of fluctuation differed depending on the exact N-terminal sequence of the protein, it is advisable to use longer sequences for prediction. In our study, we took the first 47 to 51 amino acids on the N-terminus of the light chains for prediction, thus capping the length of the entire input sequence (SP plus mature protein) at 70 amino acids, the maximum allowed by SignalP 5.0.
In summary, we demonstrated the success of this computational pipeline by screening an in silico library of wildtype and mutant SPs for each of the five antibodies, successfully solving their N-terminal miscleavage issues while maintaining similar or better titers. This method can be applied to different antibodies regardless of their initial extent of miscleavage, provides optimized solutions for individual cases, and facilitates the development of antibody therapeutics.
Materials and methods
Development of a computational pipeline for mutagenesis, prediction, and ranking
SignalP 5.0 standalone executable was licensed from the Technical University of Denmark. The executable has the same functions as the web version of SignalP 5.0,Citation33 but allows command line access. To introduce functions such as mutagenesis, text file parsing, ranking and interactive plotting, none of which is available in the executable, we developed a Python package called “sp” (source code available in Supplementary Materials), and integrated it with the executable to build the complete computational pipeline. As shown in , the pipeline takes input from a collection of wildtype SPs and the N-terminal sequence of a mature protein. For each of the wildtype SPs, it produces a list of all theoretically possible single aa and double aa mutants, each harboring unique mutation(s) in the −4 to 0 region at the C-terminus of the SP (). Notably, previous studies by Heijne et al.Citation30 used a numbering system consisting of negative and positive integers, but no zero. In our method, we assigned zero to the correct cleavage site, for the convenience of computation, because most algorithms embed sequences using consecutive integers. The wildtype and mutant SPs are then combined with the N-terminal sequence of the mature protein and fed into the executable for prediction. Next, the pipeline parses the resulting text files generated by the executable, and removes duplicated mutants derived from different wildtype SPs (concept illustrated in ). Finally, it outputs a CSV file of all SP mutants ranked descending according to the CS score at the correct cleavage site, a number produced by SignalP 5.0 executable. The CS score ranges from 0 to 1 and represents the marginal probability that a cleavage happens at the indicated site. The pipeline also generates interactive plots of sequence versus CS score on any wildtype or mutant SP that the user selects. All computations were done in a Linux environment on a high-performance computing cloud instance on Amazon Web Service.
Input antibodies and wildtype SPs
We selected five antibodies against different targets from patents (mAb 1,Citation34 mAb 2,Citation35 mAb 3,Citation36 mAb 4,Citation37 and mAb 5Citation38). These antibodies have light-chain sequences belonging to the Lambda family. Due to the length limit of the input sequence (maximum 70 amino acid including SP) imposed by the SignalP 5.0 model, only the first 47 to 51 amino acids on the N-terminus of the light chains were used for prediction. Alignment of the first 52 amino acids at the N-terminus of the light chains showed that they were all unique (Supp. ). The light chains exhibited different extent of N-terminal miscleavage, ranging from 2.3% to 100% miscleaved, as confirmed by MS analysis. A collection of 84 unique wildtype SPs, ranging from 19 to 23 amino acids in length, was acquired from public databaseCitation39–42 (Supp. Table 2). The majority of these SPs come from human germline V-gene alleles. For each antibody, 31,1304 SP mutants (that is, 1 wildtype, 95 single aa mutants and 3,610 double aa mutants, for each of the 84 wildtype SP) were generated for prediction. After removal of duplicated mutants, 296,077 unique wildtype and mutant SP were retained and analyzed ().
Cloning of SP mutants
SP mutants were generated by routine gene synthesis of DNA encoding the mutated SP with flanking restriction enzyme sites. The DNA was then cloned by standard methods into the original plasmid, thereby substituting the original SP sequence with the mutant sequence. Transfection grade plasmid DNA was generated by standard amplification and purification methods.
Expression of SP mutants
Plasmids encoding SP mutants were transfected into CHO-3E7 cells (NRC-Canada) at 50 ml scale using 125 ml Erlenmeyer flasks (Corning 431143 or HTSLabs 931110) shaking at 125 rpm in a 50 mm throw shaker. The cells were grown at 35°C with 8% CO2 in HyCell TransFx-C expression media (Cytiva SH30941.02) supplemented with 8 mM Glutamax (ThermoFisher 35050–061), 0.18% Pluronic F68 (ThermoFisher 24040–032), and 5 ml/L Penicillin-Streptomycin (ThermoFisher 15070–063). Cells were grown to a density of 2.5E6 cells/ml and transfected by mixing plasmid DNA (0.5 mg/L of culture with HC:LC ratio of 2:3) with 1 mg/ml PEI Max (PolySciences 24765–1) in a 1:6 ratio of DNA:PEI. DNA and PEI were mixed in 5% of the culture volume of TransFx-C media for 10 minutes before adding to the culture. Cells were fed with 10% BalanCD CHO Feed 4 (Irvine Scientific 94134) 24 hours post transfection, and again at 72 hours post transfection. In addition, the glucose level was adjusted to 10 g/L at 72 hours post transfection using 45% D-(+)-glucose solution (Sigma G8769). The expression was carried out at 35°C for 24 hours and then lowered to 32°C at feed 1. Expression was shaking at 125 rpm and incubated with 8% CO2 for 10 days post transfection. The media containing the secreted antibody was separated from the cells by centrifugation at 3 K x G for 10 minutes, and then filtered through a 0.45 μM stericup (Millipore SCHVU01RE) or, for analytical samples, through a 0.45 μM Claristep filter (Sartorius 17C06TF – 96).
Analysis of expression titer and purification of analytical sample
The expression titer of the secreted antibody was determined by analytical HPLC using a Poros G 20 μM column (Thermo Fisher 1512224) on a Waters Acquity Arc HPLC system with a fraction collector. Briefly, the column was equilibrated with phosphate-buffered saline (PBS) and the samples were loaded to the column at a flow rate of 2.0 ml/minute and the column was washed with PBS prior to elution with elution buffer consisting of 150 mM NaCl and 0.016 N hydrochloric acid. The eluted antibody was collected in a 96-deepwell plate (Waters WAT058957) using the fraction collector and neutralized with 0.5 M Na2PO4. This sample was then used to perform MS. All production and analysis experiments were repeated at least twice.
Analysis of cleavage percentage by MS
The molecular weight of the purified antibodies was determined by reduced MS. Briefly, the sample was reduced by incubation for 15 minutes in presence of 50 mM TCEP (Thermo Fisher 77720). The MS/MS spectra were captured on an Agilent 6230 TOF LC/MS instrument, and the result was deconvoluted using Mass Hunter (Agilent) or Byos (Protein Metrics) software to determine the molecular weight of the individual antibody chains. The relative % cleavage of chains that were misprocessed was calculated by measuring the peak height of the misprocessed chain as a percent of the peak height of the intact chain.
Data analysis
Data analysis was done in Python. Kernel density estimation was conducted using a Gaussian kernel with a bandwidth calculated by the Scott method.Citation43 Plots were generated using Matplotlib (version 3.4.3) and Plotly (version 4.14.3) packages. Sequence alignments were produced using Geneious Prime (version 2021) using the Geneious Alignment method.
Supplemental Material
Download Zip (14.8 MB)Acknowledgments
The authors would like to thank the following AbbVie colleagues: Laura Miesbauer and Mya Peterson (former AbbVie employee) for MS analysis support; Barbara Robertson, Lianchun Fan, and Ramesh Iyer for providing the SP sequences; Eric Hebert for providing antibody database for analysis; Diana Bowley and Christopher Lobo for technical support; Lili Huang, Andrew Goodearl, and Romit Majumdar for reviewing this manuscript and providing constructive feedback.
Data availability statement
Sequence of input SPs, source code of the “sp” package, and detailed data on each clone are provided in the Supplementary Materials.
Disclosure statement
No potential conflict of interest was reported by the author(s).
Supplementary material
Supplemental data for this article can be accessed on the publisher’s website
Additional information
Funding
References
- Nouwen N, Berrelkamp G, Driessen AJM. Bacterial sec-translocase unfolds and translocates a class of folded protein domains. J Mol Biol. 2007;372(2):422–13. doi:10.1016/j.jmb.2007.07.003.
- Rapoport TA. Protein translocation across the eukaryotic endoplasmic reticulum and bacterial plasma membranes. Nature. 2007;450(7170):663–69. doi:10.1038/nature06384.
- Pohlschröder M, Giménez MI, Jarrell KF. Protein transport in archaea: Sec and twin arginine translocation pathways. Curr Opin Microbiol. 2005;8(6):713–19. doi:10.1016/j.mib.2005.10.006.
- von HG. The signal peptide. J Membr Biology. 1990;115:195–201. doi:10.1007/BF01868635.
- Kapp K, Schrempf S, Lemberg MK, Dobberstein B. Post-Targeting Functions of Signal Peptides [Internet]. Landes Bioscience; 2009. Available from: https://www.ncbi.nlm.nih.gov/books/NBK6322/
- Owji H, Nezafat N, Negahdaripour M, Hajiebrahimi A, Ghasemi Y. A comprehensive review of signal peptides: structure, roles, and applications. Eur J Cell Biol. 2018;97(6):422–41. doi:10.1016/j.ejcb.2018.06.003.
- Geukens N, Frederix F, Reekmans G, Lammertyn E, Mellaert LV, Dehaen W, Maes G, Anné J. Analysis of type I signal peptidase affinity and specificity for preprotein substrates. Biochem Bioph Res Co. 2004;314(2):459–67. doi:10.1016/j.bbrc.2003.12.122.
- Duan G, Ding L, Wei D, Zhou H, Chu J, Zhang S, Qian J. Screening endogenous signal peptides and protein folding factors to promote the secretory expression of heterologous proteins in Pichia pastoris. J Biotechnol. 2019;306:193–202. doi:10.1016/j.jbiotec.2019.06.297.
- Kang X-M, Cai X, Huang Z-H, Liu Z-Q, Zheng Y-G. Construction of a highly active secretory expression system in Bacillus subtilis of a recombinant amidase by promoter and signal peptide engineering. Int J Biol Macromol. 2020;143:833–41. doi:10.1016/j.ijbiomac.2019.09.144.
- Liu Y, Shi C, Li D, Chen X, Li J, Zhang Y, Yuan H, Li Y, Lu F. Engineering a highly efficient expression system to produce BcaPRO protease in Bacillus subtilis by an optimized promoter and signal peptide. Int J Biol Macromol. 2019;138:903–11. doi:10.1016/j.ijbiomac.2019.07.175.
- Román R, Miret J, Scalia F, Casablancas A, Lecina M, Cairó JJ. Enhancing heterologous protein expression and secretion in HEK293 cells by means of combination of CMV promoter and IFNα2 signal peptide. J Biotechnol. 2016;239:57–60. doi:10.1016/j.jbiotec.2016.10.005.
- Zhou C, Xue Y, Ma Y. Characterization and high-efficiency secreted expression in Bacillus subtilis of a thermo-alkaline β-mannanase from an alkaliphilic Bacillus clausii strain S10. Microb Cell Fact. 2018;17(1):124. doi:10.1186/s12934-018-0973-0.
- Dtw N, Sarkar CA. Engineering Signal Peptides for Enhanced Protein Secretion from Lactococcus lactis. Appl Environ Microb. 2013;79(1):347–56. doi:10.1128/AEM.02667-12.
- Shi L, Liu H, Gao S, Weng Y, Zhu L. Enhanced Extracellular Production of Is PETase in Escherichia coli via Engineering of the pelB Signal Peptide. J Agr Food Chem. 2021;69(7):2245–52. doi:10.1021/acs.jafc.0c07469.
- Zhou Y, Liu P, Gan Y, Sandoval W, Katakam AK, Reichelt M, Rangell L, Reilly D. Enhancing full-length antibody production by signal peptide engineering. Microb Cell Fact. 2016;15(1):47. doi:10.1186/s12934-016-0445-3.
- Jonet MA, Mahadi NM, Murad AMA, Rabu A, Bakar FDA, Rahim RA, Low KO, RMd I. Optimization of a Heterologous Signal Peptide by Site-Directed Mutagenesis for Improved Secretion of Recombinant Proteins in Escherichia coli. J Mol Microb Biotech. 2012;22(1):48–58. doi:10.1159/000336524.
- Gibson SJ, Bond NJ, Milne S, Lewis A, Sheriff A, Pettman G, Pradhan R, Higazi DR, Hatton D. N terminal or signal peptide sequence engineering prevents truncation of human monoclonal antibody light chains. Biotechnol Bioeng. 2017;114(9):1970–77. doi:10.1002/bit.26301.
- Savojardo C, Martelli PL, Fariselli P, Casadio R. DeepSig: deep learning improves signal peptide detection in proteins. Bioinformatics. 2017;34(10):1690–96. doi:10.1093/bioinformatics/btx818.
- J-m W, Liu Y-C, Chang DT-H. SigUNet: signal peptide recognition based on semantic segmentation. BMC Bioinform. 2019;20(S24):677. doi:10.1186/s12859-019-3245-z.
- Zheng Z, Chen Y, Chen L, Guo G, Fan Y, Kong X. Signal-BNF: a Bayesian Network Fusing Approach to Predict Signal Peptides. J Biomed Biotechnol. 2012;2012:492174. doi:10.1155/2012/492174.
- Reynolds SM, Käll L, Riffle ME, Bilmes JA, Noble WS. Transmembrane Topology and Signal Peptide Prediction Using Dynamic Bayesian Networks. Plos Comput Biol. 2008;4(11):e1000213. doi:10.1371/journal.pcbi.1000213.
- Zhang W-X, Pan X, Shen H-B. Signal-3L 3.0: Improving Signal Peptide Prediction through Combining Attention Deep Learning with Window-Based Scoring. J Chem Inf Model. 2020;60(7):3679–86. doi:10.1021/acs.jcim.0c00401.
- Armenteros JJA, Tsirigos KD, Sønderby CK, Petersen TN, Winther O, Brunak S, von HG, Nielsen H. SignalP 5.0 improves signal peptide predictions using deep neural networks. Nat Biotechnol. 2019;37(4):420–23. doi:10.1038/s41587-019-0036-z.
- Garcion C, Béven L, Foissac X. Comparison of Current Methods for Signal Peptide Prediction in Phytoplasmas. Front Microbiol. 2021;12:661524. doi:10.3389/fmicb.2021.661524.
- Jeiranikhameneh M, Moshiri F, Falasafi SK, Zomorodipour A. Designing Signal Peptides for Efficient Periplasmic Expression of Human Growth Hormone in Escherichia coli. J Microbiol Biotechn. 2017;27(11):1999–2009. doi:10.4014/jmb.1703.03080.
- Tehrani SS, Goodarzi G, Naghizadeh M, Khatami SH, Movahedpour A, Abbasi A, Shabaninejad Z, Khalaf N, Taheri-Anganeh M, Savardashtaki A. Suitable Signal Peptides for Secretory Production of Recombinant Granulocyte Colony Stimulating Factor in Escherichia coli. Recent Patents Biotechnology. 2020;14(4):269–82. doi:10.2174/1872208314999200730115018.
- Mori A, Hara S, Sugahara T, Kojima T, Iwasaki Y, Kawarasaki Y, Sahara T, Ohgiya S, Nakano H. Signal peptide optimization tool for the secretion of recombinant protein from Saccharomyces cerevisiae. J Biosci Bioeng. 2015;120(5):518–25. doi:10.1016/j.jbiosc.2015.03.003.
- Klatt S, Konthur Z. Secretory signal peptide modification for optimized antibody-fragment expression-secretion in Leishmania tarentolae. Microb Cell Fact. 2012;11:1. doi:10.1186/1475-2859-11-1.
- Shanthalingam S, Srikumaran S. Intact signal peptide of CD18, the beta-subunit of beta2-integrins, renders ruminants susceptible to Mannheimia haemolytica leukotoxin. PNAS. 2009;106(36):15448–53. doi:10.1073/pnas.0906775106.
- HEIJNE GV. Patterns of Amino Acids near Signal-Sequence Cleavage Sites. Eur J Blochem. 133:17–21 . doi:10.1111/j.1432-1033.1983.tb07424.x . 1983.
- von HG. Signal sequences The limits of variation. J Mol Biol. 1985;184(1):99–105. doi:10.1016/0022-2836(85)90046-4.
- von HG. How signal sequences maintain cleavage specificity. J Mol Biol. 1984;173(2):243–51. doi:10.1016/0022-2836(84)90192-X.
- SignalP 5.0 Web Server [Internet]. Available from: http://www.cbs.dtu.dk/services/SignalP/
- Hagemann U, Griep R, Reiersen H, Kiprijanov S. Anti CCR4 antibodies and uses thereof. World Intellectual Property Organization. (WO 2012/076883 Al). 2012.
- Silence K, Ulrichts P, Jjwd H, Dreier T, Saunders MJS, Wajant H, Gabriels SME, Moshir M. Antibodies to CD70. World Intellectual Property Organization. 2011. p. WO2012123586A1.
- Adams C. .DR5 antibodies and uses thereof (US20070031414A1). United States Patent and Trademark Office. 2005.
- Kwong P, Kwong YD, Georgiev I, Ofek G, Zhang B, Mckee K, Macsola J, Chuang G, O’Dell S, Gindin T, et al. Neutralizing antibodies to HIV-1 gp41 and their use(WO2017079479A1). World Intellectual Property Organization. 2015.
- Hsieh C-M, Ivanov A, Waegell W. Immunobinders directed against sclerostin (WO2013/063095). World Intellectual Property Organization. 2011.
- PDB Protein Data Bank [Internet]. Available from: https://www.rcsb.org/
- Signal Peptide Database [Internet]. Available from: http://signalpeptide.de/?m=searchspdb
- Human V-gene germline signal peptide database [Internet]. Available from: https://www2.mrc-lmb.cam.ac.uk/vbase/alignments2.php
- NCBI [Internet]. Available from: https://www.ncbi.nlm.nih.gov/
- Scott DW. Multivariate Density Estimation: Theory, Practice, and Visualization. Hoboken (NJ): John Wiley & Sons, Inc.; 1992.