
 ?Mathematical formulae have been encoded as MathML and are displayed in this HTML version using MathJax in order to improve their display. Uncheck the box to turn MathJax off. This feature requires Javascript. Click on a formula to zoom.
ABSTRACT
Although monoclonal antibodies (mAbs) have been shown to be extremely effective in treating a number of diseases, they often suffer from poor developability attributes, such as high viscosity and low solubility at elevated concentrations. Since experimental candidate screening is often materials and labor intensive, there is substantial interest in developing in silico tools for expediting mAb design. Here, we present a strategy using machine learning-based QSAR models for the a priori estimation of mAb solubility. The extrapolated protein solubilities of a set of 111 antibodies in a histidine buffer were determined using a high throughput PEG precipitation assay. 3D homology models of the antibodies were determined, and a large set of in house and commercially available molecular descriptors were then calculated. The resulting experimental and descriptor data were then used for the development of QSAR models of mAb solubilities. After feature selection and training with different machine learning algorithms, the models were evaluated with external test sets. The resulting regression models were able to estimate the solubility values of external test set data with R2 of 0.81 and 0.85 for the two regression models developed. In addition, three class and binary classification models were developed and shown to be good estimators of mAb solubility behavior, with overall test set accuracies of 0.70 and 0.95, respectively. The analysis of the selected molecular descriptors in these models was also found to be informative and suggested that several charge-based descriptors and isotype may play important roles in mAb solubility. The combination of high throughput relative solubility experimental techniques in concert with efficient machine learning QSAR models offers an opportunity to rapidly screen potential mAb candidates and to design therapeutics with improved solubility characteristics.
Introduction
Monoclonal antibodies (mAbs) have clearly emerged as the dominant class of biotherapeutics and the recent approval by the Food and Drug Administration of a mAb for Alzheimer’sCitation1 and antibody therapies for COVID-19Citation2,Citation3 will likely dramatically increase the scale required for mAb biomanufacturing. Importantly, the development of platform processes have enabled significant reductions in the time required to proceed from discovery to production.Citation4 Despite these advances, antibody candidates often suffer from ‘developability’ challenges, where “developability’ is a metric for evaluating the potential for successful development of a stable, safe, and efficacious product.Citation5 This is often accessed by measuring colloidal stability correlated properties such as aggregation propensity, solubility, and viscosity.Citation6,Citation7 Experimental techniques such as cross-interaction chromatography (CIC), standup monolayer adsorption chromatography(SMAC), affinity-capture self-interaction nanoparticle spectroscopy (AC-SINS), clone self-interaction nanoparticle spectroscopy (CSI-BLI) or dynamic light scattering (DLS) have been used to directly or indirectly evaluate the colloidal stability of candidates.Citation8–13 However, the direct measurements of properties such as solubility and viscosity often require elevated mAb concentrations and are still labor and material intensive, which makes them impractical in early development.Citation6
The development of in-silico approaches to estimate properties related to developability could substantially accelerate the process of screening potential lead candidates, reducing the amount of materials required. A number of approaches have been examined for developing in silico tools evaluating antibody developability. Coarse-grained simulations have been applied for predicting antibody viscosity.Citation14,Citation15 Single molecular parameters, such as charge distribution and hydrophobic index have been shown to be correlated with viscosity and chemical stability.Citation16–19 Raybould et al.Citation20 reported on the use of a small set of molecular descriptors to provide guidelines for developability. Sequence compositions and residue-based descriptors have also been applied for developing methods to access self-association or colloidal stabilityCitation21–24 and to assess aggregation propensity and visocosity.Citation25–27 In addition, multiple physiochemical descriptors obtained from either sequence or three-dimensional structures have been used in models of assessing antibody oxidation risk, overall hydrophobicity, and solubility.Citation28–33
Although this prior work was useful for projecting mAb solubility and viscosity, most of these methods were developed using a relatively small set of antibodies or variants with a relatively small number of preselected descriptors. It would be extremely useful to develop in silico tools that were able to model the developability behavior of a wider range of mAb candidates. Quantitative structure activity relationship (QSAR) models can provide a unique link between the solute activity being modeled (e.g., solubility) and the important molecular properties of the solutes. Widely used in the small molecule drug development space, QSAR models have also proven useful for evaluating the behavior of large biomolecules, particularly in chromatographic applications. Robust QSAR models have been developed for a wide range of proteins, in a myriad of chromatographic media.Citation34–38 Recently, QSAR models have also been used to estimate protein diffusion coefficients in formulation applications.Citation39
For this report, we developed a QSAR based in silico screening strategy for modeling relative mAb solubility. A previously developed experimental high-throughput mAb solubility screening assayCitation6 was used to determine the solubilities of a relatively large set (111) of diverse antibodies in histidine buffer, pH 6.0. A broad range of in house and commercially available molecular descriptors were then calculated based on antigen-binding fragment (Fab) homology models and feature selection was carried out to determine the key descriptors for use in the models. Quantitative regression and qualitative classification models were then trained with different machine learning algorithms and the top models were shown to be effective in screening mAb on relative solubility. Finally, interpretation of the models was carried out to provide mechanistic insights into the mAb solubility behavior.
Results
Antibodies relative solubility distribution
A dataset of 111 antibodies composed of diverse molecules from various mAb discovery platforms, and different antigen targets was curated. The solubility of antibodies in 10 mM histidine buffer were determined by high-throughput PEG-induced precipitation. As described in the methods section, the PEG experiments were carried out and the percentage of PEG that resulted in an abrupt decrease in absorbance (i.e., the onset) was used as a surrogate for ranking solubility. The values of PEG percentages were then normalized on a zero to one scale using a ‘Min-Max normalization’ based on the solubilities of two control molecules. As shown in the histogram of the normalized solubilities (), while the solubility of the 111 molecules in the set were distributed across this scale, 34 of the mAbs had high solubility (≥1.0). In addition, 2 mAbs exhibited lower solubilities than the low control and 1 mAb had a higher solubility than the high control. The range of solubility behavior along with the diversity of this mAb set enabled us to develop models for a wider range of mAbs than has been previously reported.
Figure 1. Distribution of normalized solubility for 111 antibodies in pH 6.0, histidine buffer.
Regression models for antibody solubility
Based on the solubility data of all 111 mAbs shown above, the first regression model was developed following the QSAR model development workflow described in the methods section. The randomly selected training set contained 91 molecules and the remaining 20 molecules were used as the test set. Multiple rounds of feature selection were first carried out, after which different algorithms were tested on the resulting feature set. Validation was then carried out using 10 times five-fold cross-validation and 50 rounds of Y-scrambling. This workflow of feature selection, algorithm selection and model validation were carried out in an iterative manner and the best performing model for this data set was found to be a five-component partial least square model using 10 molecular descriptors. A comparison between the experimentally determined solubilities and the projected values are presented in . The coefficient of determination R2 for the training and test sets were 0.883 and 0.811, respectively. The average score of the 10 times fivefold cross-validation was 0.833, which was close to the training and test set performance, indicating decent model robustness. Finally, the root mean squared deviations (RMSD) were 0.114 and 0.168 for the training and test set (dotted line).
Figure 2. Experimental versus projected solubility plots for QSAR regression models: A) Regression model for 111 mAbs in this study; B) Regression model for 75 mAbs in lower to moderate soluble region (Sol <1.0). Training sets are represented as purple circles and testing sets are represented as green triangles; Solid lines are identity lines; Dotted lines represents the RMSD values of corresponding testing set.
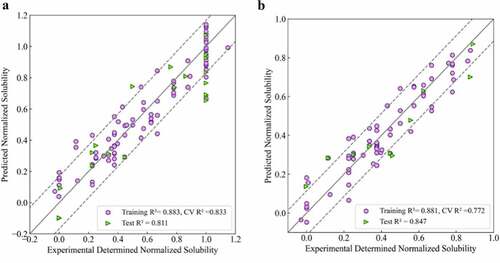
In , most of the outliers had experimentally determined solubilities of 1.0, which was the upper bound of the assay and includes mAbs with solubility values equal to or above this value. Further, we were primarily interested in identifying mAbs with lower solubilities, which would represent potentially problematic candidates. For both of these reasons, we developed a second QSAR regression model that excluded the highly soluble mAbs (Solubilities ≥ 1.0). The resulting dataset included 75 points with 63 of them used in the training set and 12 as the test set. Following a similar development procedure, the best performing model was found to be a four-component PLS model using 17 molecular descriptors (). The coefficients of determination for the training and test sets were 0.881 and 0.847, respectively. In addition, the average score for the cross-validation was 0.772. Finally, the RMSD for the training and test sets (dotted line) were 0.083 and 0.114, respectively.
The descriptors selected for these two QSAR regression models are presented in Table S1. To further evaluate model robustness and to assure minimal overfitting of the data, 50 rounds of Y-scramblingCitation40 were carried out for both models, as described in the methods section. As can be seen in Figure S1 and S2, models developed with the scrambled data were consistently unable to project the experimental values, suggesting that there was minimal overfitting in our QSAR models (Figure S1, S2). Furthermore, the original models clearly outperformed the “scrambled” models both with respect to the R2 and cross-validation score values.
Classification models for antibody solubility
In addition to QSAR regression models, we explored classification models that could identify drug candidates with potential solubility challenges. In this study, we developed both three- and two-class classification models. As was done with the regression model developed with the entire data set, 91 mAbs were used for the training set and 20 mAbs were set aside for the external test set. Prior to training, the mAbs were divided into low, medium, and high solubility ranges for the three-class model and low and high solubility ranges for the binary model. To ensure that the training data was evenly distributed, cutoffs between the classes were determined to be 0.38 and 0.88 for the three class and 0.58 for the binary model. Support vector machine with a linear kernel was applied for both models. The confusion matrices for the training and test sets for the three- and two-class models are presented in . In addition, the performance criteria of these models are summarized in and the descriptors selected for these models are presented in Table S1. As can be seen in the , for the three-class model, while the training set had high accuracy (0.88), the test set was less accurate (0.7) with 4 of the 5 misprojections occurred in the medium class. The accuracy of this model was also indicated by the cross-validation score, which was determined to be 0.85. The F1-score is a useful metric for evaluating model performance by aggregating the precision and recall scores. While the F1-scores for all three classes were over 0.8 for the training set, a low F1-score of 0.29 was observed for the medium class in the test set.
Table 1. Summary of performance metrics for three-class model
Table 2. Summary of performance metrics for binary model
Figure 3. Confusion matrix for classification models: A) training set for three-class model; B) test set for three-class model; C) training set for binary model; D) test set for binary model.
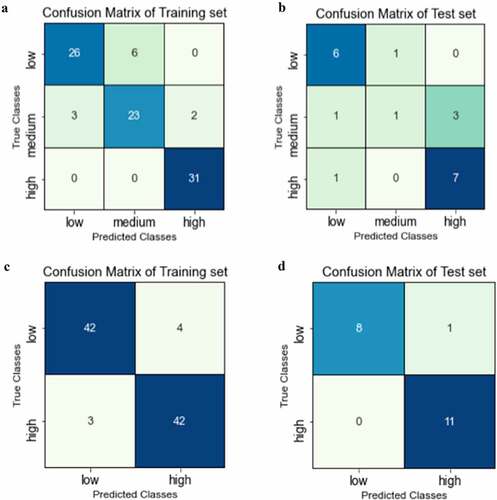
Although the three-class model performed relatively well, the low correlation observed for the medium class motivated the development of a binary model. As shown in , the binary model had overall improved accuracies of 0.92 and 0.95 for the training and test sets, respectively. Importantly, only seven of 91 instances were misprojected in the training set and only one misprojection was observed for the testing set. The cross-validation score for the binary classification model was 0.9 and the F1-scores were over 0.90 for all classes in both the training and test sets, indicating high model accuracy.
Identification of key features related to mAb solubility
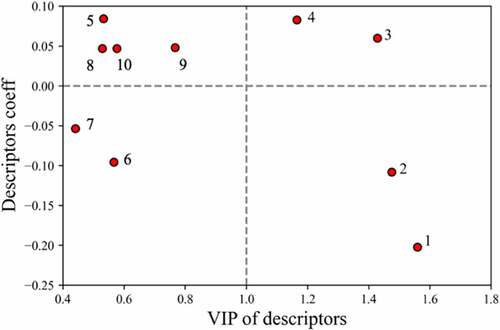
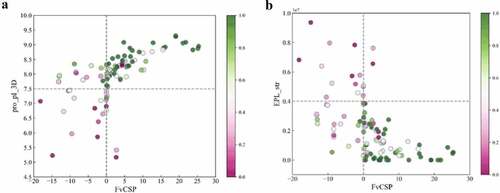
After developing various QSAR models for estimating mAb solubilities, descriptor analysis was carried out to better understand the molecular basis. One metric for evaluating the significance of features is their coefficient in the linear regression models, where higher absolute values indicate their relative importance in determining solubilities and positive or negative characteristics suggest their correlation or inverse correlation with solubility. Another important metric for features selection in the PLS models is the variable influence on projections (VIP) score. This parameter aggregates projections of the feature weights onto latent hyper planes. Features that have VIP values over 1 are considered important in the model whereas features with values less than 1 have a minor effect on the projections.Citation38,Citation39,Citation41 A comparison of the feature coefficients and their VIP scores from the regression model based on all the mAb data is presented in , which includes a horizontal dashed line for better identification of positive/negative characteristics of the coefficients. In , the top four descriptors that had VIP values equal or greater than one were: 1) isotype identifier, 2) average electrical potential of the top 25% strongest negative clusters(EPL_str), 3) protein isoelectric point (pI) based on three-dimensional structure(pro_pI_3D) and 4) the charge symmetry parameter of the variable region(FvCSP). The other descriptors in the left side of the figure all correspond to hydrophobic descriptors, which are described in the discussion section. The definitions and coefficients of all the selected descriptors were included in Table S1.
Figure 4. Variable influence on projection score (VIPs) versus descriptor coefficient in model. Labeled descriptors are: 1) ‘Isotype’; 2) ‘EPL_str’; 3) ‘pro_pI_3D’; 4) ‘FvCSP’; 5) ‘arores_nstr’; 6) ‘aroH_nstr’; 7)’aromatic_acid_num’; 8) ‘aromatic_num’; 9) ‘pro_patch_hyd’; 10) ‘Basic_max’.
To further investigate the relationship of these descriptors to mAb solubility, we mapped the solubility data onto the key features identified. presents a scatter plot where each data point corresponds to a specific mAb and the color coding represents their normalized solubilities (described in the methods section). projects this data onto the pro_pI_3D and FvCSP scores and projects it onto the EPL_str and FvCSP values. Interestingly, clustering behavior was observed for the high solubility mAbs in both figures and dashed lines are included to facilitate this visualization. In , high solubility mAbs were observed to cluster in the top-right quadrant, whereas in these mAbs clustered in the bottom right. We explore the implications and applications of these findings in the discussion section below.
Figure 5. Key Descriptor 1 value versus key descriptor 2 value scatter plot: A) pro pI 3D vs FvCSP; B) EPL_str vs FvCSP. Color bar represents solubility value of each molecule. Green represents high solubility, rose represents low solubility.
Impact of mAb isotypes
Another interesting finding from this study was that ‘isotype identifier’ was found to be an important factor impacting mAb solubilities at pH 6.0. Different isotypes were included in this investigation; the 111 mAbs included 66 IgG4s, 42 IgG1s, and 5 IgG2s. We carried out a comparative analysis of the solubility behavior of the IgG1 and IgG4 mAbs, the dominant isotypes, and their correlations to key molecular descriptors. As can be seen in , the isotypes exhibited significant differences in their solubilities. The IgG1 mAbs (Blue) had many molecules with high solubilities along with a relatively small number of IgG1s with a range of lower solubilities, reaching into the low soluble region. On the other hand, the IgG4s exhibited moderate solubilities (0.2–0.4) with only a small number achieving high solubility. Interestingly, the solubility data for these two isotypes had very different correlations to the key molecular descriptors EPL_str and pro_pI_3D of the Fabs (). While the solubility of IgG1s had a strong linear correlation (Pearson coefficient R2 = 0.85) with the pro_pI_3D of the Fabs, the solubility data of IgG4s had a much weaker correlation (Pearson coefficient R2 = 0.62). The results with the EPL_str (negative electrical potential) descriptor were even more striking. The solubility of the IgG1s exhibited a very high inverse correlation with EPL_str (RCitation2 = 0.90). On the other hand, the IgG4 solubility data was moderately correlated with a R2 of 0.65. The electrostatic potential maps for the IgG1 and IgG4 Fcs at pH 6 were quite different, as shown in . These differences in solubility behavior, correlations, and surface properties for the two isotypes are discussed below.
Figure 6. Behavior differences between IgG1s and IgG4s: A) Histogram of solubility distribution; B) scatter plot of pro_pI_3D vs solubility; C) scatter plot of EPL_str vs solubility. In all three plots, red represent IgG1, and indigo represent IgG4.
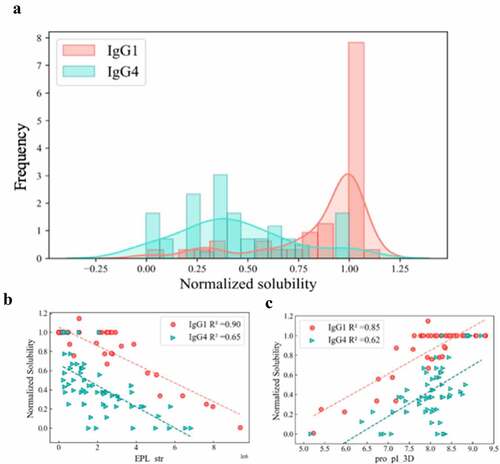
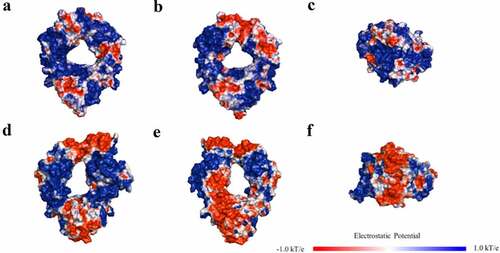
Figure 7. Electric potential maps for Fc region at pH6 for (a) IgG1 front view; (b) IgG1 back view; (c) IgG1 bottom view; (d) IgG4 front view; (e) IgG4 back view; (f) IgG4 bottom view.
Discussion
In this study, we developed both regression and classification models using mAbs exhibiting a range of solubility behavior obtained from discovery campaigns at Lilly. Compared to previously described methods in the literature, our study is more expansive than previous work with respect to both the range of mAbs and the molecular descriptors used for model generation. Importantly, the QSAR regression and classification models for mAb solubilities developed in this work were shown to have both high accuracy and robustness, which may provide useful in silico screening tools for evaluating biomanufacturability. Further, the descriptor analyses carried out in this work have provided new information about molecular properties that may be important to consider when developing mAbs with improved solubility.
Regression models were first developed using experimental mAb solubility data obtained in histidine buffer at pH 6. The solubilities of 111 mAbs were determined and the data were normalized based on two control molecules as described in the methods section. It should be noted that the PEG precipitation assay used in this study was designed for high-through screening of mAbs during drug development. While it serves as a surrogate for relative solubility, it is not a direct measure of mAb solubility. Two regression models were developed, model A (shown in ), which included all 111 mAbs, and model B (shown in ) with a smaller set of 75 mAbs that exhibited low to moderate solubilities. Model B was developed to focus on mAbs that may have solubility issues. Both models performed in a similar manner with high R2 values for the training, cross-validation, and test sets. In addition to regression models, the full solubility data set was used to generate three-class and binary classification models. As can be seen in A and 3b and , the three-class model resulted in satisfactory performance for the training set with an overall accuracy of 0.88 and an averaged cross-validation score of 0.85. For the high solubility class, all 31 values were correctly projected and a F1 score of 0.97 was achieved. The results with the test set were less accurate. Although only 1 misprojection occurred for the low and high solubility classes, 4 of 5 solubility values were misprojected for the medium test set. This resulted in a low F1-score of 0.29 for the medium class and a 0.70 overall accuracy for the test set. One explanation for the results with the medium test set could be the lack of balance of the solubility data distribution. In order to generate the three-class model, we distributed the data such that there were comparable numbers of mAbs in the training sets for these three classes. This necessitated less well-defined cutoffs for the medium class, with a bias toward higher solubility values. While a variety of cutoffs and distributions of data were examined for the three class models, they consistently underperformed for the medium class projections.
In order to create a more meaningful distribution and cutoff between the solubility classes, we developed a binary model. This enabled us to have similar numbers of data in the classes as well as a solubility transition, 0.5, that reflected the distribution of the data. As shown in c and d and , the binary classification model achieved excellent projections for the training, cross-validation, and test sets, with overall accuracies of 0.92, 0.89, and 0.95, respectively. Notably, only 1 of 20 data points in the test set was found to be misprojected. In fact, the binary model had superior performance as compared to both the three-class classification model and the two QSAR regression models.
It was also of interest to examine the descriptors selected in the models to provide some insights into the underlying protein–protein interactions influencing the mAb solubilities. Accordingly, we first examined the descriptors selected for regression model A by comparing the VIP scores and the descriptor coefficients (). As can be seen, from the 10 features selected for this regression model, four had VIP scores higher than 1.0, reflecting their importance in the model. Interestingly, three of the top four descriptors were related to the charge properties of the Fab region. In agreement with previous work in the literature,Citation16,Citation20 the charge symmetry parameter, FvCSP, was found to have a positive coefficient, indicating its correlation with mAb solubility. In addition, the pI determined from the 3D Fab structure (pro_pI_3D) and the average of the top 25% of the negatively charged clusters (EPL_str) were found to be correlated and inversely correlated, respectively, with the mAb solubilities. While ‘FvCSP’ and ‘pro_pI_3D’ were global charge descriptors describing overall charge distribution on the Fab surface, ‘EPL_str’ was a cluster descriptor describing the strength of negatively charged patches in the Fab region. Since the inclusion of all three of these charge-based descriptors were shown to be very important for model performance, we believe that they worked synergistically to enable the solubility projections. These results are supported by previous observationsCitation17,Citation18,Citation42 that specific charge–charge interactions involving the Fab can significantly affect the colloidal behavior of mAb solutions and that negatively charged patches on the Fab can reduce mAb solubility.
Previous studies have indicated that hydrophobicity, π-π and π-cation mAb interactions may contribute to mAb viscosity.Citation42 In addition to the three charge-related and isotype descriptors, descriptors related to Fab hydrophobicity were also selected for our regression model (Table SI). These included descriptors based on aromatic clusters (5, 6, 8), hydrophobic patches (9), and overlapping hydrophobic and charge cluster-based descriptors (7), where the indicated numbers correlate to the labels in . As can be seen in , although none of these had VIP scores over 1.0, the absolute values of their coefficients (see the left side of the plot) were comparable to the charge-based descriptors, which made them indispensable contributors to the models. The results indicate that hydrophobic interactions, in concert with electrostatic interactions, are likely playing a role in mAb solubility for the histidine buffer system.
To further understand the relationship between solubility and key descriptors, the mAb solubilities were mapped onto the key charge features described above (). As can be seen, some clear clustering behavior was observed for the highly soluble mAbs. which plots the pro pI 3Ds versus the FvCSP values, illustrates that mAbs with high solubilities (green) were clustered in the upper right quadrant with only 7 of the 77 molecules in this region having solubilities less than 0.38 (the cutoff used in the three-class model for low solubility). This suggests that highly soluble mAbs tend to have high Fab pIs (above 7.5) as well as charge symmetry in the variable region (FvCSP > 0). In addition, indicates that high solubility mAbs tended to cluster in the lower right quadrant, where only 6 of 74 mAbs in this region had low solubilities. This indicates that in addition to having charge symmetry in the Fv region, high solubility mAbs also tended to have weaker negatively charged clusters on the Fab surface.
This clear clustering behavior related to this relatively small set of charge-based descriptors can potentially be used to help guide the design of mAbs with higher solubilities. Currently, the cutoffs between quadrants represented by the dashed lines in were determined such that at least 90% of the mAbs within the clustering quadrant had either high or moderate solubilities. These cutoffs can be further tuned based on the accuracy needed for the screening. The clustering behavior shown in , indicated that high solubility mAbs tended to have similar charge characteristic in the Fab or variable region.
In contrast to the high solubility data, the mapping of the low solubility mAbs was observed to be more scattered in these plots. Nevertheless, certain patterns could be determined, such as the tendency for low solubility mAbs to have lower Fab pIs, stronger negative charged patches on the Fab surface and less charge symmetry of the Fv region. In order to clearly establish these patterns, we would need to include more low solubility mAbs in our analysis. In addition, the dispersion of the data in this plot could also be due to other factors playing an important role in this low solubility regime beyond these simple charge-based descriptors.
Another important finding of this study was that ‘isotype’ was identified as the descriptor having the highest VIP score and absolute value of the coefficient (), which made it the most influential descriptor in the model. In initial exploratory studies, the Fc features were included in the descriptor pool; however, after feature selection, we consistently obtained one Fc descriptor for each model which was selected as a surrogate for ‘isotype identifier’. When more Fc-based descriptors were examined in these models, no obvious improvements were obtained. Accordingly, we used ‘isotype identifier’ as one of the features and developed Fab homology models that were then used to determine the Fab-based descriptor sets. Interestingly, drastically different solubility behaviors were observed for the different isotypes. As can be seen in , while more than half of the IgG1s had high solubilities (≥1.0) with much small numbers in the lower solubility regimes, the IgG4s had a broad distribution with the peak centered in the moderate solubility region (0.25–0.50).
We also examined the relationship between mAb solubilities and some of the key descriptors identified for the two isotypes. As can be seen in high correlation (RCitation2 = 0.85) between solubility and Fab pI was observed for the IgG1s, whereas only a moderate correlation (RCitation2 = 0.62) was found for the IgG4s. A similar result was obtained with the strength of the negatively charged clusters (EPL_str) shown in where IgG1 solubility had a very high inverse correlation (RCitation2 = 0.90) with solubility, whereas the IgG4 solubility was less well correlated (RCitation2 = 0.65). This strong linear correlation between these single charge-based descriptors and mAb solubilities for the IgG1s was quite striking. We hypothesized that the difference in the solubility behavior of the two isotypes may be due to differences in the charge profiles of the Fc regions. Accordingly, we generated electrostatic potential (EP) maps at pH 6 for the Fc regions of the IgG1s and IgG4s used in this study (). In these plots, red and blue represent negative and positive charged regions on the protein surface. As can be seen in the figure, the IgG1 Fc was significantly more positively charged than the IgG4 Fc. The IgG1 Fc (ABC) surfaces were mostly covered by contiguous positively charged patches with a relatively small number of discontinuous negatively charged patches. In contrast, IgG4 Fc had a large contiguous negative patch on both the bottom and the back regions of the molecule. These observations are in agreement with the theoretical 3D pIs of the IgG1 and IgG4 Fcs, which are 7.59 and 6.61, respectively.
The EP maps also help to explain the strong correlation between Fab pI and mAb solubilities for the IgG1s. The higher the Fab pI, the more positively charged patches will occur on the Fab surface at pH 6. This will produce stronger electrostatic repulsions between the positively charged Fc and Fab surfaces, resulting in higher mAb solubilities. In contrast, the large negative patch on the IgG4 Fc could result in electrostatic attractions between the positively charged Fabs and the Fc. This could in turn result in additional interactions occurring between the regions, which would reduce mAb solubilities and weaken the linear correlations between the charge-based descriptors and the IgG4 solubility. These results are also consistent with a previous observation thatCitation43 the charge profile of IgG1s and IgG4s modulate the differential developability properties of the two isotypes. This analysis of the correlations of the mAb solubilities with charge-based descriptors, in concert with the protein surface plots for the two isotypes, provides potentially useful information for engineering antibody candidates with improved solubility behavior and for selecting appropriate scaffolds for development.
The aim of this study was to develop in silico screening tools of mAb solubility. Using a QSAR modeling approach, regression, and classification models were developed to provide quantitative or qualitative projections of mAb solubilities, and our top models have the potential to be used for screening mAb relative solubility at early discovery. Finally, interpretation of the models was carried out to provide mechanistic insights into the mAb solubility behavior and our results indicated that isotype and Fab charge-based descriptors were important, particularly for the IgG1 mAbs. While this work was successful in generating QSAR regression and classification models for a given set of conditions (normalized solubility data based on a PEG precipitation assay for a given set of mAbs), it would be difficult to extend these particular models to data outside of this set due to the effect of differences in: 1) the biomolecules, 2) the buffer conditions, and 3) the particular biophysical techniques used as a surrogate for solubility. To further improve model performance and applicability to a wider set of molecules and conditions, future work will focus on constantly updating the model as more experimental data becomes available with a wider range of mAbs. In addition, we will extend these efforts to alternative formulation conditions (buffers, pHs, additives) and also develop models for other important biophysical properties related to developability.
Materials and methods
Antibody preparation
Antibodies used in this study were from various discovery campaigns and included IgG1, IgG2, and IgG4 subclasses. Samples were produced internally at Eli Lilly and Company. mAbs were expressed in either transient 293 F or stable Chinese hamster ovary cells. Purification followed typical antibody purification procedures (protein A capture followed by polishing steps). All reagents and excipients were commercially available from Hampton Research, EM Chemicals, JT Baker, Sigma-Aldrich, and/or Mallinckrodt, and were of high grade (>98% purity).
Solubility determination by PEG-induced precipitation with automation
The experimental protocol was adapted from the method reported by Chai et al.Citation6 and Oeller et al.Citation44 Solutions of 10 mM histidine, pH 6.0, containing varying polyethylene glycol 3350 (PEG 3350) concentrations (v/v) (from 4 to 36%) were prepared using a Formulator (Formulatrix, Bedford, MA). All the mAb samples were buffer-exchanged and diluted to 1 mg/mL and plated (50 µL/well) onto the wells of 96-well polystyrene, V-bottomed assay plates (Greiner). A Biomek i7 (Beckman Coulter, Indianapolis, IN) liquid handler was used to add 50 µL/well of the PEG stock solutions from the Master Block plate into 96-well polystyrene, V-bottomed assay plates containing the mAb samples. The final composition of each well on the PS plate (in a total volume of 100 µL) contained 50 µg of sample per well, and 10 mM histidine with PEG 3350 concentration ranging from 2% to 18% (v/v) across each column of the plate in 1.5% increment. The assay plates were sealed with clear sealing film (Hampton Research, Aliso Viejo, CA) and then incubated at room temperature on a titer plate shaker (Lab-Line Instruments, Melrose Park, IL) for 24 hours. After incubation, the assay plate was centrifuged at 3500 RPM for 15 minutes at 25°C on an Allegra X12R benchtop centrifuge (Beckman Coulter, Brea, CA) to remove the precipitate. Then, 50 µL/well liquid was transferred from each well into a UV Star 384-well plate using a Biomek i7. After sealing the UV Star plate with clear sealing, the plate was centrifuged for two minutes at 3000RPM to remove air bubbles. Finally, the plate was read on a Tecan Infinite M1000 Pro UV/Vis Spectrophotometer (Männedorf, Switzerland) at 280 nm (with background subtraction at 320 nm). The absorbance data was de-convoluted and plotted in Excel, where the point of abrupt decrease in absorbance was determined. The nearest PEG 3350 concentration (%) that corresponded to the onset of precipitation was defined as PEGonset and used as a surrogate for mAb solubility. The resulted PEGonset was then normalized based on the values obtained with the two internal control molecules as follows..
PEGlow and PEGhigh were the PEGonset for the two control molecules used for each measurement. Of note, for cases where the high solubility control molecule does not have a precipitation onset during the assay, we use the maximum PEG concentration used in the assay. The normalized PEG data of all the mAbs in this study are summarized in Table S3. The representative data of PEG-induced precipitation assay is presented in Figure S3. A four-parameter log-logistic function was applied for curve fitting and is indicated by the solid curves. PEGonset (indicated by the triangles in Figure S3) represents the PEG concentration corresponding to a 5% decrease in the soluble mAb concentration from the initial amount. For mAbs that did not precipitate at the highest PEG3350 concentration employed (36%), we assigned a PEGonset value of 36%. We choose PEGonset over PEG1/2 due to an improved sensitivity in ranking the molecules.
Antibody 3D structure preparations
The Fab structures were determined using the antibody modeler module in Molecular Operating Environment 2019 (MOE) (Chemical Computing Group, Montreal, Canada). Settings used were the ‘Fine’ refinement level, Amber10: EHT force field, and the R-solvation field. To compensate for errors due to protein flexibility, five repeated homology models were developed to create conformation ensembles for each Fab structure.
Calculation of molecular descriptors
Protein molecular descriptors from multiple sources were calculated for all the Fab homology models developed in this work. Global protein descriptors and protein surface patch descriptors were calculated using MOE. FvCSP was calculated according to methods developed by Sharma et al.Citation16 SCM score was calculated according to Agrawal et al.Citation26 Custom-designed residue cluster-based descriptors and overlapping clusters descriptors were calculated using the procedure published by Woo et al.Citation36 PDB2PQR software was used for structure corrections and protonation.Citation45 Poissson-Boltzmann electrostatic calculations were performed by Adaptive Poisson-Boltzmann Solver (APBS).Citation46 All the descriptors described above were calculated based on five repeated Fab homology models and the average values of five runs were used for model development, resulting in 310 molecular descriptors for each mAb prior to feature selection.
QSAR model development workflow
The QSAR model development process was implemented using python 3.7.1 on JupyterLab 2.1.5. The total dataset was composed of 111 mAbs solubilities in 10 mM histidine buffer, at pH 6, which were normalized into a 0 to 1 scale using ‘Min-Max normalization’ according to the solubilities of two control molecules (high/low). Computational molecular descriptors were standardized such that each had a mean of 0 and a standard deviation of 1 for the entire mAb data set. After data preparations, the dataset was randomly split into a training set (82%) and a test set (18%). Multiple rounds of feature selection were then applied to filter out unrelated features and to remove redundancy within the feature set. Briefly, the initial selection removed features with low variance (p >.85). Secondly, features with high mutual correlations (>85%) was then removed. Finally, L1-based recursive feature selection was applied to remove as many unimportant features as possible while maintaining the model performance.Citation47 Different algorithms, including partial least square (PLS), support vector machine (SVM), tree-based algorithm, and multi-layer perceptron, were evaluated. The average score of 10 times five-fold cross-validation and 50 rounds of Y-scramblingCitation48 were used for model validation and to assure there was no overfitting of the models. Y-scrambling was implemented by keeping the x-dataset (the descriptor set) intact and shuffling the y-dataset (normalized solubility) 50 times. For each ‘scrambled’ dataset, a ‘scrambled’ model was trained using the same algorithm as the original model. The coefficient of determination R2 and cross validation square correlation coefficient Q2 were then used to access the performance of these resulting models of the scrambled data. The development process of feature selection, algorithm selection, and model validation were carried out in an iterative manner to select the best performing model, which was then evaluated using the external test set. All QSAR regression models developed in this study were developed following this workflow. The definitions and coefficients of descriptors included for all models are summarized in Table S1. The selected descriptor values of all mAbs included in this study are presented in Table S2.
List of Abbreviations
Supplemental Material
Download Zip (349.2 KB)Acknowledgments
The authors kindly acknowledge Protein Bioscience group at Biotechnology center at San Diego, and Research Information & Digital Solutions team at Eli Lilly for technical support.
Disclosure statement
No potential conflict of interest was reported by the author(s).
Supplementary material
Supplemental data for this article can be accessed on the publisher’s website
Additional information
Funding
References
- Commissioner O of the. FDA Grants Accelerated Approval for Alzheimer’s Drug. FDA. 2021 Jun 7 [accessed 2021 Jul 8]. https://www.fda.gov/news-events/press-announcements/fda-grants-accelerated-approval-alzheimers-drug
- Commissioner O of the. Coronavirus (COVID-19) Update: FDA authorizes monoclonal antibodies for treatment of COVID-19. FDA. 2020 Nov 23 [accessed 2021 Jul 8]. https://www.fda.gov/news-events/press-announcements/coronavirus-covid-19-update-fda-authorizes-monoclonal-antibodies-treatment-covid-19
- Commissioner O of the. coronavirus (COVID-19) update: FDA authorizes additional monoclonal antibody for treatment of COVID-19. FDA. 2021 May 26 [accessed 2021 Jul 8]. https://www.fda.gov/news-events/press-announcements/coronavirus-covid-19-update-fda-authorizes-additional-monoclonal-antibody-treatment-covid-19
- Kelley B. Developing therapeutic monoclonal antibodies at pandemic pace. Nature Biotechnology. 2020;38(5):540–12. doi:10.1038/s41587-020-0512-5.
- Jarasch A, Koll H, Regula JT, Bader M, Papadimitriou A, Kettenberger H. Developability assessment during the selection of novel therapeutic antibodies. Journal of Pharmaceutical Sciences. 2015;104(6):1885–98. doi:10.1002/jps.24430.
- Chai Q, Shih J, Weldon C, Phan S, Jones BE. Development of a high-throughput solubility screening assay for use in antibody discovery. mAbs. 2019;11(4):747–56. doi:10.1080/19420862.2019.1589851.
- Bethea D, Wu S-J, Luo J, Hyun L, Lacy ER, Teplyakov A, Jacobs SA, O’Neil KT, Gilliland GL, Feng Y. Mechanisms of self-association of a human monoclonal antibody CNTO607. Protein Engineering, Design and Selection. 2012;25(10):531–38. doi:10.1093/protein/gzs047.
- Jacobs SA, Wu S-J, Feng Y, Bethea D, O’Neil KT. Cross-Interaction chromatography: a rapid method to identify highly soluble monoclonal antibody candidates. Pharmaceutical Research. 2010;27(1):65–71. doi:10.1007/s11095-009-0007-z.
- Wu J, Schultz JS, Weldon CL, Sule SV, Chai Q, Geng SB, Dickinson CD, Tessier PM. Discovery of highly soluble antibodies prior to purification using affinity-capture self-interaction nanoparticle spectroscopy. Protein Engineering Design and Selection. 2015;28(10):403–14. doi:10.1093/protein/gzv045.
- Sule SV, Dickinson CD, Lu J, Chow C-K, Tessier PM. Rapid analysis of antibody self-association in complex mixtures using immunogold conjugates. Molecular Pharmaceutics. 2013;10(4):1322–31. doi:10.1021/mp300524x.
- Liu Y, Caffry I, Wu J, Geng SB, Jain T, Sun T, Reid F, Cao Y, Estep P, Yu Y, et al. High-throughput screening for developability during early-stage antibody discovery using self-interaction nanoparticle spectroscopy. mAbs. 2014;6(2):483–92. doi:10.4161/mabs.27431.
- Sun T, Reid F, Liu Y, Cao Y, Estep P, Nauman C, Xu Y . High throughput detection of antibody self-interaction by bio-layer interferometry mAbs ;5(6):838–841. https://doi.org/10.4161/mabs.26186.
- Kohli N, Jain N, Geddie ML, Razlog M, Xu L, Lugovskoy AA. A novel screening method to assess developability of antibody-like molecules. mAbs. 2015;7(4):752–58. doi:10.1080/19420862.2015.1048410.
- Calero-Rubio C, Saluja A, Roberts CJ. Coarse-grained antibody models for “weak” protein–protein interactions from low to high concentrations. The Journal of Physical Chemistry B. 2016;120(27):6592–605. doi:10.1021/acs.jpcb.6b04907.
- Calero-Rubio C, Ghosh R, Saluja A, Roberts CJ. Predicting protein-protein interactions of concentrated antibody solutions using dilute solution data and coarse-grained molecular models. Journal of Pharmaceutical Sciences. 2018;107(5):1269–81. doi:10.1016/j.xphs.2017.12.015.
- Sharma VK, Patapoff TW, Kabakoff B, Pai S, Hilario E, Zhang B, Li C, Borisov O, Kelley RF, Chorny I , et al. In silico selection of therapeutic antibodies for development: viscosity, clearance, and chemical stability PNAS.2014 Nov. 111(52):18601–06. doi:10.1073/pnas.1421779112.
- Yadav S, Laue TM, Kalonia DS, Singh SN, Shire SJ. The influence of charge distribution on self-association and viscosity behavior of monoclonal antibody solutions. Molecular Pharmaceutics. 2012;9(4):791–802. doi:10.1021/mp200566k.
- Yadav S, Liu J, Shire SJ, Kalonia DS. Specific interactions in high concentration antibody solutions resulting in high viscosity. Journal Of Pharm Sci. Sciences P. 99(3):1152–68 Mar 2010. doi:10.1002/jps.21898.
- Kingsbury JS, Saini A, Auclair SM, Fu L, Lantz MM, Halloran KT, Calero-Rubio C, Schwenger W, Airiau CY, Zhang J, et al. A single molecular descriptor to predict solution behavior of therapeutic antibodies. Science Advances. 2020;6(32). eabb0372. doi:10.1126/sciadv.abb0372.
- Raybould MIJ, Marks C, Krawczyk K, Taddese B, Nowak J, Lewis AP, Bujotzek A, Shi J, Deane CM. Five computational developability guidelines for therapeutic antibody profiling. Proceedings of the National Academy of Sciences. 2019;116(10):4025–30. doi:10.1073/pnas.1810576116.
- Alam ME, Geng SB, Bender C, Ludwig SD, Linden L, Hoet R, Tessier PM. Biophysical and sequence-based methods for identifying monovalent and bivalent antibodies with high colloidal stability. Molecular Pharmaceutics. 2018;15(1):150–63. doi:10.1021/acs.molpharmaceut.7b00779.
- Agostini F, Vendruscolo M, Tartaglia GG. Sequence-Based Prediction of Protein Solubility. Journal of Molecular Biology. 2012;421(2–3):237–41. doi:10.1016/j.jmb.2011.12.005.
- Pindrus M, Shire SJ, Kelley RF, Demeule B, Wong R, Xu Y, Yadav S. Solubility challenges in high concentration monoclonal antibody formulations: relationship with amino acid sequence and intermolecular interactions. Molecular Pharmaceutics. 2015;12(11):3896–907. doi:10.1021/acs.molpharmaceut.5b00336.
- Dzisoo AM, He B, Karikari R, Agoalikum E, Cisi: HJ. A tool for predicting cross-interaction or self-interaction of monoclonal antibodies using sequences. Interdisciplinary Sciences: Computational Life Sciences. 2019;11(4):691–97. doi:10.1007/s12539-019-00330-1.
- Chennamsetty N, Voynov V, Kayser V, Helk B, Trout BL. Design of therapeutic proteins with enhanced stability Proceedings of the National Academy of Sciences. 2009;106(29):11937–42. doi:10.1073/pnas.0904191106.
- Agrawal NJ, Helk B, Kumar S, Mody N, Sathish HA, Samra HS, Buck PM, Li L, Trout BL. Computational tool for the early screening of monoclonal antibodies for their viscosities. mAbs. 2016;8(1):43–48. doi:10.1080/19420862.2015.1099773.
- Lauer TM, Agrawal NJ, Chennamsetty N, Egodage K, Helk B, Trout BL. Developability Index: a Rapid In Silico Tool for the Screening of Antibody Aggregation Propensity. Journal of Pharmaceutical Sciences. 2012;101(1):102–15. doi:10.1002/jps.22758.
- Sormanni P, Amery L, Ekizoglou S, Vendruscolo M, Popovic B. Rapid and accurate in silico solubility screening of a monoclonal antibody library. Scientific Reports. 2017 [accessed 2018 Oct 2];7(1). doi:10.1038/s41598-017-07800-w
- Hebditch M, Warwicker J. Charge and hydrophobicity are key features in sequence-trained machine learning models for predicting the biophysical properties of clinical-stage antibodies. PeerJ. 2019;7:e8199. doi:10.7717/peerj.8199.
- Hebditch M, Roche A, Curtis RA, Warwicker J. Models for antibody behavior in hydrophobic interaction chromatography and in self-association. Journal of Pharmaceutical Sciences. 2019;108(4):1434–41. doi:10.1016/j.xphs.2018.11.035.
- Sormanni P, Aprile FA, Vendruscolo M. The camsol method of rational design of protein mutants with enhanced solubility. Journal of Molecular Biology. 2015;427(2):478–90. doi:10.1016/j.jmb.2014.09.026.
- Sankar K, Hoi KH, Yin Y, Ramachandran P, Andersen N, Hilderbrand A, McDonald P, Spiess C, Zhang Q. Prediction of methionine oxidation risk in monoclonal antibodies using a machine learning method. mAbs. 2018;10(8):1281–90. doi:10.1080/19420862.2018.1518887.
- Tomar DS, Singh SK, Li L, Broulidakis MP, Kumar S. In silico prediction of diffusion interaction parameter (kD), a key indicator of antibody solution behaviors. Pharmaceutical Research. 2018 [accessed 2018 Oct 2];35(10). doi:10.1007/s11095-018-2466-6
- Song M, Breneman CM, Bi J, Sukumar N, Bennett KP, Cramer S, Tugcu N. Prediction of protein retention times in anion-exchange chromatography systems using support vector regression. Journal of Chemical Information and Computer Sciences. 2002;42(6):1347–57. doi:10.1021/ci025580t.
- Ladiwala A, Xia F, Luo Q, Breneman CM, Cramer SM. Investigation of protein retention and selectivity in HIC systems using quantitative structure retention relationship models. Biotechnology and Bioengineering. 2006;93(5):836–50. doi:10.1002/bit.20771.
- Woo JA, Chen H, Snyder MA, Chai Y, Frost RG, Cramer SM. Defining the property space for chromatographic ligands from a homologous series of mixed-mode ligands. Journal of Chromatography A. 2015;1407:58–68. doi:10.1016/j.chroma.2015.06.017.
- Robinson JR, Karkov HS, Woo JA, Krogh BO, Cramer SM. QSAR models for prediction of chromatographic behavior of homologous Fab variants: QSAR Models for Fab Variants. Biotechnology and Bioengineering. 2017;114(6):1231–40. doi:10.1002/bit.26236.
- Robinson JR, Karkov HS, Woo JA, Krogh BO, Cramer SM. QSAR models for prediction of chromatographic behavior of homologous fab variants: qsar models for fab variants. Biotechnology and Bioengineering. 2017;114(6):1231–1240. doi:10.1002/bit.26236
- Bauer KC, Hämmerling F, Kittelmann J, Dürr C, Görlich F, Hubbuch J. Influence of structure properties on protein–protein interactions—QSAR modeling of changes in diffusion coefficients. Biotechnology and Bioengineering. 2017;114(4):821–31. doi:10.1002/bit.26210.
- Alexander DLJ, Tropsha A, Winkler DA. Beware of R 2: simple, Unambiguous Assessment of the Prediction Accuracy of QSAR and QSPR Models. Journal of Chemical Information and Modeling. 2015;55(7):1316–22. doi:10.1021/acs.jcim.5b00206.
- Datta-Mannan A, Estwick S, Zhou C, Choi H, Douglass NE, Witcher DR, Lu J, Beidler C, Millican R. Influence of physiochemical properties on the subcutaneous absorption and bioavailability of monoclonal antibodies. mAbs. 2020;12(1):1770028. doi:10.1080/19420862.2020.1770028.
- Tilegenova C, Izadi S, Yin J, Huang CS, Wu J, Ellerman D, Hymowitz SG, Walters B, Salisbury C, Carter PJ. Dissecting the molecular basis of high viscosity of monospecific and bispecific IgG antibodies. mAbs. 2020;12(1):1692764. doi:10.1080/19420862.2019.1692764.
- Heads JT, Lamb R, Kelm S, Adams R, Elliott P, Tyson K, Topia S, West S, Nan R, Turner A, et al. Electrostatic interactions modulate the differential aggregation propensities of IgG1 and IgG4P antibodies and inform charged residue substitutions for improved developability. Protein Engineering, Design and Selection. 2019;32(6):277–88. doi:10.1093/protein/gzz046.
- Oeller M, Sormanni P, Vendruscolo M. An open-source automated PEG precipitation assay to measure the relative solubility of proteins with low material requirement. Scientific Reports. 2021;11(1):21932. doi:10.1038/s41598-021-01126-4.
- Dolinsky TJ, Nielsen JE, McCammon JA, Baker NA. PDB2PQR: an automated pipeline for the setup of Poisson-Boltzmann electrostatics calculations. Nucleic Acids Research. 2004;32(Web Server):W665–W667. doi:10.1093/nar/gkh381.
- Baker NA, Sept D, Joseph S, Holst MJ, McCammon JA. Electrostatics of nanosystems: application to microtubules and the ribosome Proceedings of the National Academy of Sciences. 2001;98(18):10037–41. doi:10.1073/pnas.181342398.
- Doucet JP, Panaye A. Three dimensional QSAR: applications in pharmacology and toxicology. Boca Raton: CRC Press. 2010. doi:10.1201/b10419.
- Veerasamy R, Rajak H, Jain A, Sivadasan S, Varghese CP, Agrawal RK. Validation of QSAR models - strategies and importance.: 9.