
ABSTRACT
The antibody drug field has continually sought improvements to methods for candidate discovery and engineering. Historically, most such methods have been laboratory-based, but informatics methods have recently started to make an impact. Deep learning, a subfield of machine learning, is rapidly gaining prominence in the biomedical research. Recent advances in microfluidics technologies and next-generation sequencing have not only revolutionized therapeutic antibody discovery, but also contributed to a vast amount of antibody repertoire sequencing data, providing opportunities for deep learning-based applications. Previously, we used microfluidics, yeast display, and deep sequencing to generate a panel of binder and non-binder antibody sequences to the cancer immunotherapy targets PD-1 and CTLA-4. Here we encoded the antibody light and heavy chain complementarity-determining regions (CDR3s) into antibody images, then built and trained convolutional neural network models to classify binders and non-binders. To improve model interpretability, we performed in silico mutagenesis to identify CDR3 residues that were important for binder classification. We further built generative deep learning models using generative adversarial network models to produce synthetic antibodies against PD-1 and CTLA-4. Our models generated variable length CDR3 sequences that resemble real sequences. Overall, our study demonstrates that deep learning methods can be leveraged to mine and learn patterns in antibody sequences, offering insights into antibody engineering, optimization, and discovery.
Introduction
Machine learning is a method of data analysis that allows “machines” (i.e., computers) to discover, learn, and extract patterns from data and make predictions. Deep learning, a subfield of machine learning that uses multiple “layers” (i.e., a type of algorithmic building block) to progressively extract information from complex data, has shown impressive results across a variety of application domains, such as computer vision and natural language processing. In recent years, the biomedical and genomics fields have increasingly adopted machine learning techniques in various applications, such as predicting transcriptional enhancers,Citation1–3 splicing,Citation4 and DNA- and RNA-binding proteins.Citation5,Citation6 Machine and deep learning have also been applied to the antibody field, particularly as massively parallel sequencing technologies contributed to a vast amount of antibody repertoire sequencing data.Citation7–9 For example, machine learning approaches have used antibody sequencing data to identify antibodies against severe acute respiratory syndrome coronavirus 2 (SARS-CoV-2)Citation7 and the dengue virus,Citation8 differentiate antibodies arising from healthy or tumor tissues,Citation9 and predict antibody-antigen interactions.Citation10–14 Other studies have used machine learning to predict antibody developabilityCitation15,Citation16 and improve antibody humanization.Citation17 Along with advances in general protein structure prediction using tools such as AlphaFoldCitation18 and RoseTTAFold,Citation19 deep learning approaches have also been applied to predict antibody structures.Citation20–22 Beyond predictive applications, generative machine learning methods have been used to design antibody sequences.Citation23–26
A major challenge for both predictive and generative machine learning methods is the scarcity of ground-truth antibody-antigen binding datasets. To address this challenge, machine learning studies depended on training datasets derived from phage display panning of synthetic antibody libraries,Citation23,Citation24 in silico generated antibody-antigen binding structures,Citation26,Citation27 or public databases such as Structural Antibody Database (SAbDab)Citation28 and the international ImMunoGeneTics information system (IMGT).Citation29 Deep mutational scanning has also been used to generate training datasets for sequence-based machine learning tasks. For example, Mason et al. generated mutant libraries of the anti-HER2 therapeutic antibody trastuzumab, then used mammalian cell display and fluorescence-activated cell sorting (FACS) to screen for antigen-specific variants. These variants were sequenced and the sequencing data were used to train deep learning models to predict antigen-specific antibodies among a larger computational mutant library.Citation30 Deep mutational scanning has also been applied to generate antigen libraries. Taft et al. generated SARS-CoV-2 receptor-binding domain (RBD) mutagenesis libraries, then used FACS to screen for binding to ACE2 or anti-RBD antibodies. Sequencing data of both binder and non-binder RBD variants were used to train deep learning models to predict the impact of RBD mutations on ACE2 binding and antibody escape.Citation31 These studies demonstrate that deep learning approaches are well suited to interrogate the massive sequence space of mutagenesis libraries. However, such mutagenesis approaches leverage antibody or antigen sequences that shared a common parental sequence, i.e., the sequences were not highly diverse. Using highly diverse antibody training sets is a distinct computational challenge from using lower sequence diversity datasets (for example, consider the difference between analyzing images of cats versus all different kinds of mammals).
Previously, we generated hundreds of highly diverse binder and non-binder antibody sequences against the immunotherapy targets cytotoxic T lymphocyte-associated antigen 4 (CTLA-4) and programmed cell death protein 1 (PD-1).Citation32 Here, we used these training data to test whether deep learning models could be used to predict antibody binders versus non-binders, and we further built generative deep learning models to generate synthetic antibody sequences.
Results
Generating binder and non-binder antibody sequences
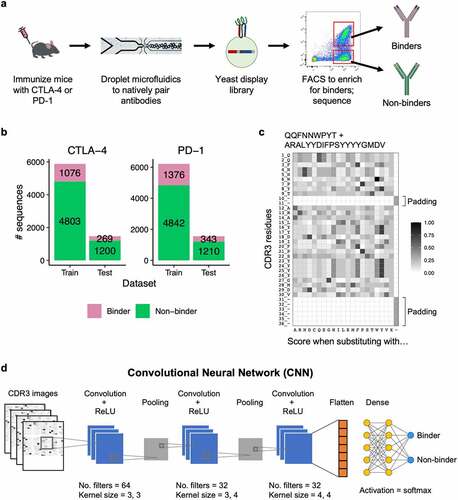
Previously, B cells from CTLA-4 or PD-1 immunized mice were isolated and encapsulated into microfluidics droplets for lysis, followed by overlap extension-reverse transcriptase-polymerase chain reaction (OE-RT-PCR), to generate libraries of natively paired single-chain variable fragments (scFv).Citation32 The scFv libraries were expressed in a yeast surface display system and multiple rounds of FACS were performed using the respective antigens. The scFv libraries were deep sequenced before and after FACS enrichment. Both pre- and post- libraries had a diverse range of V and J gene identities (Figure S1).Citation32 We defined binders as scFv sequences that were ≥ 0.01% of the sequencing reads in a post-sort library and were enriched ≥ 1.8 fold when compared to its respective pre-sort library. We defined non-binders as sequences that were ≥ 0.01% of the sequencing reads in a pre-sort library, but were not enriched following FACS (post/pre fold change < 1) (). This resulted in 6,003 non-binder and 1,345 binder sequences for CTLA-4, and 6,052 non-binder and 1,719 binder sequences for PD-1.
Figure 1. Deep learning model for binder and non-binder classification. (a) Experimental workflow to generate antibody sequences. B cells from mice immunized with either CTLA-4 or PD-1 were encapsulated into microfluidics droplets to generate scFv libraries. The scFv libraries were expressed as yeast display, FACS sorted, and deep sequenced to generate binder and non-binder antibody sequences. (b) Number of CDR3K + CDR3H sequences in the training and testing datasets for CTLA-4 (left) and PD-1 (right). (c) A representative example of a CDR3K + CDR3H sequence encoded into a two-dimensional numerical matrix (image). The image displays BLOSUM substitution scores of the CDR3K + CDR3H residues (rows) when replaced with one of the 20 amino acids, gap, or X (columns). Both CDR3K and CDR3H were padded with “gaps” to ensure consistent dimension across images. (d) Convolutional neural network (CNN) model architecture for classifying binder and non-binder sequences. Two identical CNN models were built for PD-1 and CTLA-4 sequences, and they were trained separately.
Building and training deep learning models to classify binders
To evaluate if antibody sequences can predict antigen binding, we set out to develop and train deep learning models to classify binder and non-binder sequences for CTLA-4 and PD-1. For each target, we randomly split our dataset into a training set (80%) and a testing set (20%), maintaining the same binder to non-binder ratio in both sets (). As the complementarity-determining region 3 (CDR3) regions of an antibody are the main determinants of binding specificity, we used the concatenated CDR3 amino acid sequences for light and heavy chains (CDR3K + CDR3H) as input data for the models. To predict binders and non-binders, we used a convolutional neural network (CNN), a deep learning framework that has proven highly effective in image recognition.Citation33 First, we encoded the CDR3K + CDR3H sequences into two-dimensional numerical matrices (“images”) using the BLOSUM matrix,Citation34 which computed the substitution scores of each CDR3 residue (rows) with the 20 amino acids (columns). We padded variable length CDR3s with “gaps” to ensure that all input matrices have consistent dimensions, a prerequisite for CNN input data. This resulted in CDR3 images of size 36 × 22 data points (). These CDR3 images were passed through a CNN model with three convolution layers, which progressively detect relevant features in the images. The output of the final convolution layer was flattened and fed into a dense neural network layer, which outputs a final prediction of whether a given image belonged to a binder or non-binder antibody (). We tuned the models by performing a randomized search across various hyperparameters, including number of filters, kernel size, dropout rate, and dense layer nodes, selecting the best hyperparameter combination for the final model architecture (Table S1). We trained both CTLA-4 and PD-1 models for 30 epochs (i.e., complete runs through the CNN algorithm), using the respective training datasets.
Evaluating deep learning models
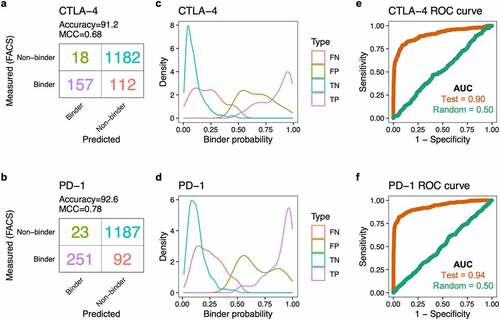
Next, we evaluated the performance of the fully trained CNN models in predicting binders using the reserved 20% testing dataset. The CTLA-4 and PD-1 models achieved prediction accuracy of 91.2% and 92.6%, and Matthews correlation coefficient (MCC) of 0.68 and 0.78, respectively (, b). Actual binders predicted to be binders (true positives) tended to have higher predicted binder probabilities (median = 0.89 for CTLA-4, 0.93 for PD-1) than non-binders classified as binders (false positives; median = 0.67 for CTLA-4, 0.63 for PD-1). Similarly, actual non-binders predicted to be non-binders (true negatives) had lower predicted binder probabilities (median = 0.08 for CTLA-4, 0.12 for PD-1) than binders classified as non-binders (false negatives; median = 0.22 for CTLA-4, 0.23 for PD-1) (, d). The areas under the curve (AUC) of the receiver operating characteristic (ROC) curves for the CTLA-4 and PD-1 models were 0.90 and 0.94, respectively. As a negative control, we trained the neural networks using datasets containing shuffled binder and non-binder class labels; these models lost the ability to predict binders, as indicated by an AUC of 0.5 (, f).
Figure 2. CNN model performance on the testing datasets. (a) Confusion matrix showing the number of CTLA-4 binder and non-binder sequences, as predicted by the CNN model or as measured by FACS. (b) Confusion matrix for the PD-1 sequences. (c) Density plot showing the distribution of predicted binder probability for the CTLA-4 sequences. The color represents the four different types of predictions: false negative (FN), false positive (FP), true negative (TN), true positive (TP). (d) Density plot showing the distribution of predicted binder probability for the PD-1 sequences. (e) Receiver operating characteristic (ROC) curve for the testing dataset (brown) for prediction of CTLA-4 binders. The green line represents the performance of the model trained with randomized binder/non-binder labels. AUC, area under the curve. (f) ROC curve for the CNN model predicting PD-1 binders.
To understand how the size of the training datasets influenced model performance, we performed downsampling analysis. We trained the CNN models with either the full training datasets (5,879 CTLA-4 sequences, 6,218 PD-1 sequences) or random sampling of 3,000, 1,000, 500, or 100 sequences. Both CTLA-4 and PD-1 models performed worse with decreasing training sample size, and completely lost predictive ability when trained with only 100 sequences (MCC = 0) (Figure S2). This highlights the dependence of model performance on sample size and suggests that a deeper dataset might further improve our models’ ability to accurately predict binders and non-binders.
Deep learning model interpretability and in silico mutagenesis
Deep learning models are often described as black-box models because the methods used to derive a certain prediction can be unclear, which can limit their practical utility. For example, to use our CNN models’ results for antibody engineering campaigns such as affinity maturation, we would need more specific insights regarding which amino acids are important or not important for binding. To improve our CNN models’ interpretability, we generated sequence logos for the most representative binder sequences (predicted binder probability ≥ 0.95) (). These sequence logos provided a summary of the neural networks’ learned motifs and may inform relevant motifs for antigen-specific recognition (in the context of the training set). To understand which amino acids might be good or bad candidates for mutagenesis, we performed in silico mutagenesis analysis.Citation5,Citation35 For a given CDR3K + CDR3H sequence, we systematically mutated each amino acid residue into one of the 20 amino acids, then measured how much each mutation affected predicted binder probability. For example, in silico mutagenesis of the anti-CTLA-4 sequence QQYGSSPWT+AREGSWGRFDY shows that mutations of the residues K3 (Y), K8 (W), and H4 (G) most severely decreased predicted binder probability, indicating that these residues were important for binder classification (). Interestingly, for another anti-CTLA-4 sequence, LQNYNYPRT+ARKGQLGPFDY, mutations of the two CDR3K Y residues resulted in increased predicted binder probability (). This suggests that substituting these residues may improve the antibody’s binding affinity or specificity to CTLA-4.
Figure 3. (a) Figures showing amino acids present across CDR3K + CDR3H peptides for the most representative binder sequences for CTLA-4 and PD-1. CDR3K amino acids are generally shared across peptides whereas CDR3H sequences have many more variable amino acids. (b) Heatmap showing in silico showing change in predicted binder probability, relative to the original sequence’s binder probability, when an example CDR3K + CDR3H sequence is mutated to all possible amino acids. The figure shows a mix of mutation probabilities, with five amino acid positions particularly disruptive to binding when mutated. (c) Heatmap showing in silico showing change in predicted binder probability, relative to the original sequence’s binder probability, when an example CDR3K + CDR3H sequence is mutated to all possible amino acids. The figure shows a mix of mutation probabilities, with two amino acid positions particularly disruptive to binding when mutated and two amino acid positions particularly beneficial to binding when mutated. (d) Heatmap showing mutation sensitivity for a total of 108 anti-CTLA-4 antibody sequences (9 CDR3K residues + 11 CDR3H residues). The heatmap shows a mix of mutation probabilities, with no particular pattern across the residues or sequences.
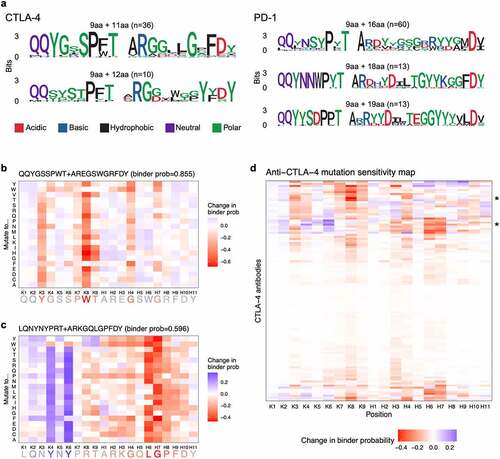
Focusing on a CDR3K + CDR3H sequence may guide engineering of a single antibody or clonal cluster, but it does not provide more “universal” rules for antibody engineering given a training set. To develop more universal rules based on residue position, for the most common anti-CTLA-4 sequence length (9 CDR3K residues + 11 CDR3H residues), we plotted average change in binder probability upon mutations for all sequences (n = 108) to visualize positional differences across sequences. This mutation sensitivity map reveals that different residue positions were important for binder classification for different sequences (). When comparing CTLA-4 and PD-1, we noticed that CTLA-4 binder prediction was sensitive to changes in both CDR3K and CDR3H residues, while PD-1 binder prediction was often sensitive to changes in CDR3H residues alone ( S3, and S4, S5). This suggests that both CDR3K and CDR3H were important for CTLA-4 antigen recognition, whereas CDR3H predominantly determined binding specificity to the PD-1 antigen. Interestingly, CDR3 positions with low mutability tended to have distinct amino acid motifs present only in the binder sequences, suggesting that the mutagenesis analysis had identified important residues characteristic of binders (Figures S4, S5).
Overall, the mutation sensitivity analysis provided insights into residues that were important for not only the neural networks’ binder classification, but also antigen binding specificity. This highlights that our CNN models are useful beyond binder/non-binder classification alone; instead, information learned from such models may one day be used to guide antibody engineering and optimization.
Generating synthetic antibodies using generative deep learning
Next, we evaluated if synthetic CTLA-4 and PD-1 antibody sequences could be generated using generative deep learning approaches. Such approaches could be used to guide laboratory-based engineering of novel antibody sequences with beneficial characteristics. One complication to this effort was that the deep learning approach could generate nonfunctional, chimeric sequences consisting of multiple V gene identities. Therefore, we first visualized the diversity of the antibody repertoires by computing the number of amino acid differences between each pairwise alignment of heavy or light chain sequences, for both CTLA-4 and PD-1. We connected sequences with ≤ 6 amino acid differences to generate networks of closely related sequences. This revealed that Ig sequences generally clustered by their germline V gene identity (Figures S6, S7). Then, we set out to build individual generative models for different V genes. To ensure that we had enough sequences for training the generative models, we focused on building models for V genes with more than 30 sequences and trained heavy and light chain models separately. Therefore, we set out to build 8 CTLA-4 models (IGHV3-33*01, IGHV1-18*04, IGHV3-20*01, IGHV4-39*01, IGKV3-20*01, IGKV1D-39*01, IGKV1-17*01, IGKV1-16*01) and 7 PD-1 models (IGHV4-4*07, IGHV3-33*03, IGHV1-18*04, IGKV1-17*01, IGKV1-6*02, IGKV3-15*01, IGKV1-9*01) (Figure S8).
We annotated CTLA-4 and PD-1 light and heavy chain sequences using the AHo antibody numbering scheme,Citation36 which is based on the structural alignments of the 3D structures of the antibody variable regions. The AHo numbering scheme was well suited for our application because it introduced alignment gaps within, instead of after, the CDR3 sequences. This ensured that amino acid residues that were more conserved, typically located at the beginning and the end of CDR3 sequences, were aligned across sequences. It also generated input CDR3 sequences of the same length, a prerequisite for our generative models. We encoded these fixed-length CDR3 sequences into 2D images using the BLOSUM matrixCitation34 ().
Figure 4. Generating synthetic CDR3 sequences using generative deep learning. (a) CDR3 sequences were numbered using the AHo numbering scheme, which introduced alignment gaps within the CDR3 sequences. These fixed length CDR3 sequences were encoded into a two-dimensional numerical matrix (image) of size 32 × 22. A representative CDR3 image is shown. The image displays BLOSUM substitution scores of the CDR3 residues (rows) when replaced with one of the 20 amino acids, gap, or X (columns). (b) Generative adversarial network (GAN) model architecture for generating synthetic CDR3 sequences. The generator network generated CDR3 images from random noise, while the discriminator network discerned real and generated images.
We built 15 identical generative adversarial network (GAN) models to generate synthetic sequences for the respective V genes of the respective target (). Each GAN model consisted of two parts: the generator network and the discriminator network (Table S2). The generator network served to input a random vector and output a random CDR3 image. The discriminator network served to input both real and generated CDR3 images and predicted if a given image came from a real antibody or was created by the generator network. As training went on, the generator network produced increasingly realistic CDR3 images, while the discriminator gradually improved in discerning real and generated images. Both networks were trained simultaneously until the generator was able to generate realistic CDR3 images indistinguishable by the discriminator (). Once the 15 GAN models were fully trained, they were each used to generate 100 synthetic CDR3 images, which were decoded back to amino acid sequences.
Deep learning generated sequences resembling real antibodies
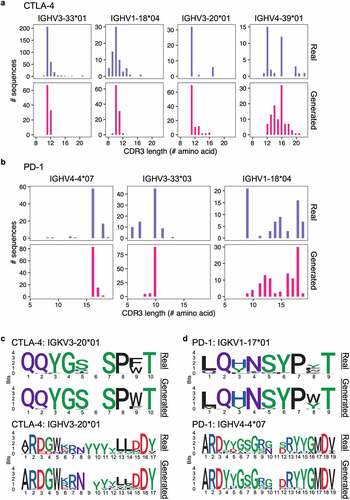
To assess the synthetic CDR3 sequences generated by the GAN models, we compared them to real CDR3 sequences from the training set. For CTLA-4, real CDR3H sequences ranged from 8 to 22 amino acids (median = 11), while generated CDR3H sequences ranged from 9 to 21 amino acids (median = 11) (). For PD-1, real CDR3H sequence ranged from 6 to 19 amino acids (median = 14), while generated sequences ranged from 8 to 19 amino acids (median = 16) (). This highlights the ability of the GAN models to generate diverse sequences of variable lengths, and the generated sequences had length distribution that resembled that of the real training sequences. CDR3 sequence logos further show that amino acid compositions were similar between the generated sequences and the real sequences. The models had learned to preserve residues that were relatively constant across training sequences while varying residues at positions with more flexibility (, d, S9, and S10). Interestingly, the generated sequences included residues that were not present in the training sequences. For example, for PD-1 antibodies with the IGKV1-17*01 V gene, all real CDR3K sequences started with either leucine or glutamine, but the GAN model generated CDR3K sequences starting with leucine, methionine, isoleucine, valine, or glutamic acid ( and S11). This demonstrated that the GAN models were able to generate unique antibody sequences beyond the training sequence space.
Figure 5. Comparing real and GAN-generated CDR3 sequences. (a, b) Histograms showing CDR3H amino acid length distribution for anti-CTLA-4 (a) and anti-PD-1 (b) sequences. Top panel show real sequences and bottom panel show GAN-generated sequences. (c, d) Sequence logos for real (top) and GAN-generated (bottom) CDR3s for anti-CTLA-4 (c) and anti-PD-1 (d) sequences with the specified V genes. Sequence logos for all models are in Figures S9 and S10.
Finally, we evaluated the GAN-generated sequences using the CNN models independently trained in the first part of the study. We generated 100 CDR3K + CDR3H sequences for the most common V gene pairs (IGKV3-20*01 + IGHV3-33*01 for anti-CTLA-4, IGKV1-17*01 + IGHV3-33*03 for anti-PD-1), then used the CNN models to predict if they were binders to CTLA-4 and PD-1, respectively. Of the generated anti-CTLA-4 and anti-PD-1 sequences, 95/100 and 90/100, respectively, were predicted to be binders to their targets (Figure S12a). Using both the real and generated anti-CTLA-4 and anti-PD-1 sequences, we subsequently performed in silico mutagenesis analysis to identify residues with low mutability, i.e., their mutations would decrease a given sequence’s predicted binder probability. Interestingly, residues with low mutability were shared across both real and generated sequences (Figures S12, S13). This suggests that the GAN models had learned key residues characteristic of binder sequences and incorporated these residues into the generated sequences, thus further validating the GAN models.
Overall, these results suggest that generative deep learning approaches can learn the rules of antibody sequences to generate novel and diverse synthetic antibodies to complement and expand natural antibody repertoires.
Discussion
Here we describe two approaches of deep learning to understand and utilize antibody repertoire sequencing data. First, we built deep learning models to predict binder and non-binder antibodies to CTLA-4 and PD-1. Our models achieved ≥ 91.2% prediction accuracy, demonstrating the ability of deep learning models to recognize patterns in antibody sequences. We expect that such models can be repurposed to identify antibodies with precise binding profiles. For example, it may be desirable to identify antibodies that bind to multiple targets (e.g., all pathogen variants) or specific combinations of targets (e.g., protein isoforms A and B, but not C). Instead of performing laborious serial rounds of FACS, one could sort an antibody library against single antigens, sequence the binders, and use deep learning to predict antibodies with desired binding profiles. Once such models are trained, they can also be used to rapidly identify candidate antibodies in newly sequenced repertoires. To mitigate the black-box nature of deep learning approaches, we used in silico mutagenesis to identify amino acid residues important for binder versus non-binder classification. This demonstrates that beyond making predictions, deep learning can provide insights into antibody specificity and aid antibody engineering efforts.
Second, we built generative deep learning models to generate synthetic antibodies against CTLA-4 and PD-1. Our GAN models learned the patterns of binder sequences and generated novel, variable-length, and diverse CDR3 sequences. It will be interesting to synthesize the GAN-generated sequences as display libraries or monoclonal antibodies to evaluate their binding activity in vitro. We envision that deep learning-designed antibodies, combined with the declining cost of DNA library synthesis, will accelerate the fields of synthetic biology and antibody discovery.
One of the main challenges of applying machine learning in genomics is the difficulty in generating large amounts of labeled data to use as training sets. In this study, we used antibody library display, FACS, and deep sequencing to generate training data, allowing us to link antibody sequences to binding versus non-binding. All training sets have some drawbacks; for example, our dataset comprises hundreds of sequences, but many of the sequences are clonally related. Machine learning clearly detects clonality, and therefore many generated sequences have similarities to clonal expansions within the training set, limiting practical utility to laboratory scientists hoping for novel sequences with properties not found in sequences identified through experimental work. More diverse datasets could result in more diverse generated sequences, and therefore more antibodies with novel properties.
Future efforts could focus on developing high-throughput experimental methods to measure antibody properties, such as binding affinity, stability, pH sensitivity, neutralization, epitope specificity, and developability. For example, machine learning could be applied to large sets of SARS-CoV-2 neutralizing antibodies to understand potential for viral mutant escape from antibody therapies or vaccines. The ability to couple these phenotypic data to antibody sequences will greatly improve the utility of machine learning-based approaches in the antibody field.
Materials and Methods
Generating binder and non-binder sequences
CTLA-4 and PD-1 antibodies were generated as previously described.Citation32 Binders were defined as scFv sequences that were ≥ 0.01% of the sequencing reads in a post-sort library and were enriched ≥ 1.8 fold when compared to its respective pre-sort library. Non-binders were defined as sequences that were ≥ 0.01% of the sequencing reads in a pre-sort library but were not enriched following FACS (post/pre fold change < 1). Sequences that did not meet either criterion were excluded from analysis. The sequences were split into training dataset (80%) and testing dataset (20%) using the createDataPartition function of the caret package (version 6.0.86) in R. This maintained the ratio of binder to non-binder sequences in both datasets.
Encoding CDR3 sequences for binder classification
Encoding refers to the process of converting sequences into numeric data for input into a machine learning algorithm. To encode the CDR3 sequences, we first padded all CDR3K and CDR3H sequences with “gaps” to result in sequences of length 11 amino acids and 25 amino acids, respectively. The padded sequences were concatenated, generating CDR3K + CDR3H sequences of length 36. These sequences were encoded into two-dimensional numerical matrices (images) using the BLOSUM62 matrix,Citation34 which computed the substitution scores of each CDR3 residue (rows) with the 20 amino acids, gap, or X (columns). This resulted in CDR3 images of size 36 × 22 data points.
Convolutional neural network model to predict binders and non-binder antibodies
The CNN model was built using the Keras (version 2.3.0.0)Citation37 sequential model as a wrapper for TensorFlow (version 2.4.0)Citation38 in the R programming environment (version 4.0.3). The model architecture and hyperparameters are provided in Table S1. Two identical models were built for the CTLA-4 and PD-1 sequences. We tuned the models by performing a randomized search across various hyperparameters, including number of filters, kernel size, dropout rate, and dense layer nodes, using the tuning_run function of the tfruns (version 1.5.0) package. We selected the best hyperparameters and trained both models for 30 epochs, using the respective training datasets.
In silico mutagenesis of CDR3K + CDR3H sequences
We performed in silico mutagenesis on CDR3K + CDR3 sequences to identify residues important for binder versus non-binder antibody classification. For a given CDR3K + CDR3H sequence, we systematically mutated each amino acid residue into one of the 20 amino acids using a custom perl script. We then used the trained CNN models to predict the probability that each mutant sequence was a binder. We calculated the changes in predicted binder probability for the mutants relative to their parent sequences and visualized the changes as heatmaps. For the mutation sensitivity maps, the average (across 20 amino acids) change in predicted binder probability for all sequences were plotted.
Clonal cluster analysis and visualization
We used USEARCHCitation39 to compute the number of amino acid differences between each pairwise alignment of antibody single chain sequences. We used the R package igraph (version 1.2.6)Citation40 to generate clustering plots for the pairwise alignments. Each node represented a single chain (light or heavy) sequence and was colored based on V gene identity. Edges indicate pairwise alignments with ≤ 6 amino acid differences.
Encoding CDR3 for generative deep learning
We used ANARCICitation41 to annotate full-length light and heavy chain antibody sequences using the AHo numbering scheme.Citation36 CDR3 regions (positions 107–138 for both light and heavy chain) were extracted and encoded into 2D images using the BLOSUM62 matrix,Citation34 which computed the substitution scores of each CDR3 residue (rows) with the 20 amino acids, gap, or X (columns). The residue “X” was added to ensure that the resulting CDR3 images had an even number of columns. The final CDR3 images were of size 32 × 22 data points.
Generative adversarial network (GAN) models to generate synthetic antibody sequences
We built 15 identical GAN models to generate synthetic CDR3 sequences. This included 8 CTLA-4 models (IGHV3-33*01, IGHV1-18*04, IGHV3-20*01, IGHV4-39*01, IGKV3-20*01, IGKV1D-39*01, IGKV1-17*01, IGKV1-16*01) and 7 PD-1 models (IGHV4-4*07, IGHV3-33*03, IGHV1-18*04, IGKV1-17*01, IGKV1-6*02, IGKV3-15*01, IGKV1-9*01). The models were built using Keras (version 2.3.0.0)Citation37 as a wrapper for TensorFlow (version 2.4.0)Citation38 in the R programming environment (version 4.0.3). The model architecture and hyperparameters are provided in Table S2. The GAN models were trained for 100 rounds each, using a batch size of 20. Once fully trained, the generator for each model was used to generate 100 synthetic CDR3 images. The images were decoded back to CDR3 amino acid sequences.
Evaluating GAN-generated sequences using CNN models
Focusing on the most common V gene pairs (IGKV3-20*01 + IGHV3-33*01 for anti-CTLA-4, IGKV1-17*01 + IGHV3-33*03 for anti-PD-1), we randomly paired the GAN-generated CDR3K and CDR3H sequences, then randomly selected 100 paired CDR3K + CDR3H sequences, for anti-CTLA-4 and anti-PD-1, respectively. We padded and encoded these sequences using the BLOSUM62 matrix,Citation34 in the same manner we prepared the sequences for training and testing the CNN models. The sequences were then input into their respective CNN models to predict if they were binders or non-binders.
Visualizations
All plots, including CDR3 images and heatmaps, were generated using ggplot2 (version 3.3.3).Citation42 Sequence logos were generated using ggseqlogo (version 0.1).Citation43 Multiple sequence alignments of CDR3 sequences were visualized using the msa package (version 1.22.0)Citation44 in the R programming environment (version 4.0.3).
Abbreviations
Data availability
Antibody sequences and deep learning R code are available at https://github.com/ywlim/Antibody_deep_learning.
Supplemental Material
Download Zip (5.4 MB)Acknowledgments
We thank GigaGen employees for valuable discussions.
Disclosure statement
YWL, ASA, and DSJ are employees of GigaGen Inc. and receive salary for their work.
Supplementary material
Supplemental data for this article can be accessed on the publisher’s website.
Additional information
Funding
References
- Liu F, Li H, Ren C, Bo X, Shu W. PEDLA: predicting enhancers with a deep learning-based algorithmic framework. Sci Rep. 2016;6:28517–11. doi:10.1038/srep28517.
- Kleftogiannis D, Kalnis P, Bajic VB. DEEP: a general computational framework for predicting enhancers. Nucleic Acids Res. 2015;43:e6. doi:10.1093/nar/gku1058.
- Min X, Zeng W, Chen S, Chen N, Chen T, Jiang R. Predicting enhancers with deep convolutional neural networks. BMC Bioinform. 2017;18:478–46. doi:10.1186/s12859-017-1878-3.
- Jaganathan K, Kyriazopoulou Panagiotopoulou S, McRae JF, Darbandi SF, Knowles D, Li YI, Kosmicki JA, Arbelaez J, Cui W, Schwartz GB, et al. Predicting splicing from primary sequence with deep learning. Cell. 2019;176:535–548.e24. doi:10.1016/j.cell.2018.12.015.
- Alipanahi B, Delong A, Weirauch MT, Frey BJ. Predicting the sequence specificities of DNA- and RNA-binding proteins by deep learning. Nat Biotechnol. 2015;33:831–38. doi:10.1038/nbt.3300.
- Zeng H, Edwards MD, Liu G, Gifford DK. Convolutional neural network architectures for predicting DNA-protein binding. Bioinformatics. 2016;32:i121–7. doi:10.1093/bioinformatics/btw255.
- Magar R, Yadav P, Barati Farimani A. Potential neutralizing antibodies discovered for novel Corona virus using machine learning. Sci Rep. 2021;11:5261–11. doi:10.1038/s41598-021-84637-4.
- Horst A, Smakaj E, Natali EN, Tosoni D, Babrak LM, Meier P, Miho E. Machine learning detects anti-DENV signatures in antibody repertoire sequences. Front Artif Intell. 2021;4:715462. doi:10.3389/frai.2021.715462.
- Konishi H, Komura D, Katoh H, Atsumi S, Koda H, Yamamoto A, Seto Y, Fukayama M, Yamaguchi R, Imoto S, et al. Capturing the differences between humoral immunity in the normal and tumor environments from repertoire-seq of B-cell receptors using supervised machine learning. BMC Bioinform. 2019;20:267–11. doi:10.1186/s12859-019-2853-y.
- Akbar R, Robert PA, Pavlović M, Jeliazkov JR, Snapkov I, Slabodkin A, Weber CR, Scheffer L, Miho E, Haff IH, et al. A compact vocabulary of paratope-epitope interactions enables predictability of antibody-antigen binding. CellReports. 2021;34:108856.
- Liberis E, Velickovic P, Sormanni P, Vendruscolo M, Liò P. Parapred: antibody paratope prediction using convolutional and recurrent neural networks. Bioinformatics. 2018;34:2944–50. doi:10.1093/bioinformatics/bty305.
- Jespersen MC, Mahajan S, Peters B, Nielsen M, Marcatili P. Antibody specific B-cell epitope predictions: leveraging information from antibody-antigen protein complexes. Front Immunol. 2019;10:298. doi:10.3389/fimmu.2019.00298.
- Olimpieri PP, Chailyan A, Tramontano A, Marcatili P. Prediction of site-specific interactions in antibody-antigen complexes: the proABC method and server. Bioinformatics. 2013;29:2285–91. doi:10.1093/bioinformatics/btt369.
- Schneider C, Buchanan A, Taddese B, Deane CM. DLAB: deep learning methods for structure-based virtual screening of antibodies. Bioinformatics. 2021;38:377–83. doi:10.1093/bioinformatics/btab660.
- Jain T, Boland T, Lilov A, Burnina I, Brown M, Xu Y, Vásquez M. Prediction of delayed retention of antibodies in hydrophobic interaction chromatography from sequence using machine learning. Bioinformatics. 2017;33:3758–66. doi:10.1093/bioinformatics/btx519.
- Chen X, Dougherty T, Hong C, Schibler R, Zhao YC, Sadeghi R, Matasci N, Wu Y-C KI. Predicting antibody developability from sequence using machine learning. bioRxiv. 2020 Jun 18:159798–7.
- Marks C, Hummer AM, Chin M, Deane CM. Humanization of antibodies using a machine learning approach on large-scale repertoire data. Bioinformatics. 2021;37:4041–47. doi:10.1093/bioinformatics/btab434.
- Jumper J, Evans R, Pritzel A, Green T, Figurnov M, Ronneberger O, Tunyasuvunakool K, Bates R, Žídek A, Potapenko A, et al. Highly accurate protein structure prediction with AlphaFold. Nature. 2021;596:583–89. doi:10.1038/s41586-021-03819-2.
- Baek M, DiMaio F, Anishchenko I, Dauparas J, Ovchinnikov S, Lee GR, Wang J, Cong Q, Kinch LN, Schaeffer RD, et al. Accurate prediction of protein structures and interactions using a three-track neural network. Science. 2021;373:871–76. doi:10.1126/science.abj8754.
- Ruffolo JA, Sulam J, Gray JJ. Antibody structure prediction using interpretable deep learning. Patterns (NY). 2022;3:100406. doi:10.1016/j.patter.2021.100406.
- Ruffolo JA, Guerra C, Mahajan SP, Sulam J, Gray JJ. Geometric potentials from deep learning improve prediction of CDR H3 loop structures. Bioinformatics. 2020;36:i268–75. doi:10.1093/bioinformatics/btaa457.
- Bujotzek A, Dunbar J, Lipsmeier F, Schäfer W, Antes I, Deane CM, Georges G. Prediction of VH-VL domain orientation for antibody variable domain modeling. Proteins. 2015;83:681–95. doi:10.1002/prot.24756.
- Liu G, Zeng H, Mueller J, Carter B, Wang Z, Schilz J, Horny G, Birnbaum ME, Ewert S, Gifford DK. Antibody complementarity determining region design using high-capacity machine learning. Bioinformatics. 2020;36:2126–33. doi:10.1093/bioinformatics/btz895.
- Saka K, Kakuzaki T, Metsugi S, Kashiwagi D, Yoshida K, Wada M, Tsunoda H, Teramoto R. Antibody design using LSTM based deep generative model from phage display library for affinity maturation. Sci Rep. 2021;11:5852–13. doi:10.1038/s41598-021-85274-7.
- Shin J-E, Riesselman AJ, Kollasch AW, McMahon C, Simon E, Sander C, Manglik A, Kruse AC, Marks DS. Protein design and variant prediction using autoregressive generative models. Nat Commun. 2021;12:2403–11. doi:10.1038/s41467-021-22732-w.
- Akbar R, Robert PA, Weber CR, Widrich M, Frank R, Pavlović M, Scheffer L, Chernigovskaya M, Snapkov I, Slabodkin A, et al. In silico proof of principle of machine learning-based antibody design at unconstrained scale. bioRxiv. 2021;2021(7):08.451480.
- Robert PA, Akbar R, Frank R, Pavlović M, Widrich M, Snapkov I, Chernigovskaya M, Scheffer L, Slabodkin A, Mehta BB, et al. One billion synthetic 3D-antibody-antigen complexes enable unconstrained machine-learning formalized investigation of antibody specificity prediction. bioRxiv. 2021;2021(7):06.451258.
- Dunbar J, Krawczyk K, Leem J, Baker T, Fuchs A, Georges G, Shi J, Deane CM. SAbDab: the structural antibody database. Nucleic Acids Res. 2014;42:D1140–6. doi:10.1093/nar/gkt1043.
- Giudicelli V, Duroux P, Ginestoux C, Folch G, Jabado-Michaloud J, Chaume D, Lefranc M-P. IMGT/LIGM-DB, the IMGT comprehensive database of immunoglobulin and T cell receptor nucleotide sequences. Nucleic Acids Res. 2006;34:D781–4. doi:10.1093/nar/gkj088.
- Mason DM, Friedensohn S, Weber CR, Jordi C, Wagner B, Meng SM, Ehling RA, Bonati L, Dahinden J, Gainza P, et al. Optimization of therapeutic antibodies by predicting antigen specificity from antibody sequence via deep learning. Nat Biomed Eng. 2021;5:600–12. doi:10.1038/s41551-021-00699-9.
- Taft JM, Weber CR, Gao B, Ehling RA, Han J, Frei L, Metcalfe SW, Yermanos A, Kelton W, Reddy ST. Predictive profiling of SARS-CoV-2 variants by deep mutational learning. bioRxiv. 2021;2021:07.471580.
- Asensio MA, Lim YW, Wayham N, Stadtmiller K, Edgar RC, Leong J, Leong R, Mizrahi RA, Adams MS, Simons JF, et al. Antibody repertoire analysis of mouse immunization protocols using microfluidics and molecular genomics. mAbs. 2019;11:870–83. doi:10.1080/19420862.2019.1583995.
- LeCun Y, Bengio Y, Hinton G. Deep learning. Nature. 2015;521:436–44. doi:10.1038/nature14539.
- Henikoff S, Henikoff JG. Amino acid substitution matrices from protein blocks. Proc Natl Acad Sci USA. 1992;89:10915–19. doi:10.1073/pnas.89.22.10915.
- Sidhom J-W, Larman HB, Pardoll DM, Baras AS. DeepTCR is a deep learning framework for revealing sequence concepts within T-cell repertoires. Nat Commun. 2021;12:1605–12. doi:10.1038/s41467-021-21879-w.
- Honegger A, Plückthun A. Yet another numbering scheme for immunoglobulin variable domains: an automatic modeling and analysis tool. J Mol Biol. 2001;309:657–70. doi:10.1006/jmbi.2001.4662.
- Chollet F, Allaire JJ, Kalinowski T, Falbel D, Tang Y, Van Der Bijl W, Studer M, Keydana S. R interface to keras. 2017. https://github.com/rstudo Accessed 1 April 2022.
- Abadi M, Agarwal A, Barham P, Brevdo E, Chen Z, Citro C, Corrado GS, Davis A, Dean J, Devin M, et al. TensorFlow: large-scale machine learning on heterogeneous systems. 2015. https://tensorflow.org Accessed 1 April 2022.
- Edgar RC. Search and clustering orders of magnitude faster than BLAST. Bioinformatics. 2010;26:2460–61. doi:10.1093/bioinformatics/btq461.
- Csardi G, Nepusz T. The igraph software package for complex network research. InterJournal [Internet] Complex Systems:1695. 2006. http://igraph.org Accessed 1 April 2022.
- Dunbar J, Deane CM. ANARCI: antigen receptor numbering and receptor classification. Bioinformatics. 2016;32:298–300. doi:10.1093/bioinformatics/btv552.
- Wickham H. ggplot2: elegant graphics for data analysis [Internet]. Springer-Verlag New York; 2016. https://ggplot2.tidyverse.org Accessed 1 April 2022.
- Wagih O. ggseqlogo: a versatile R package for drawing sequence logos. Bioinformatics. 2017;33:3645–47. doi:10.1093/bioinformatics/btx469.
- Bodenhofer U, Bonatesta E, Horejš-Kainrath C, Hochreiter S. msa: an R package for multiple sequence alignment. Bioinformatics. 2015;31:3997–99. doi:10.1093/bioinformatics/btv494.