
ABSTRACT
Approaches for antibody discovery have seen substantial improvement and success in recent years. Yet, advancing antibodies into the clinic remains difficult because therapeutic developability concerns are challenging to predict. We developed a computational model to simplify antibody developability assessment and enable accelerated early-stage screening. To this end, we quantified the ability of hundreds of sequence- and structure-based descriptors to differentiate clinical antibodies that have undergone rigorous screening and characterization for drug-like properties from antibodies in the human repertoire that are not natively paired. This analysis identified 144 descriptors capable of distinguishing clinical from repertoire antibodies. Five descriptors were selected and combined based on performance and orthogonality into a single model referred to as the Therapeutic Antibody Developability Analysis (TA-DA). On a hold-out test set, this tool separated clinical antibodies from repertoire antibodies with an AUC = 0.8, demonstrating the ability to identify developability attributes unique to clinical antibodies. Based on our results, the TA-DA score may serve as an approach for selecting lead antibodies for further development.
Abbreviations: Affinity-Capture Self-Interaction Nanoparticle Spectroscopy (AC-SINS), Area Under the Curve (AUC), Complementary-Determining Region (CDR), Clinical-Stage Therapeutics (CST), Framework (FR), Monoclonal Antibodies (mAbs), Observed Antibody Space (OAS), Receiver Operating Characteristic (ROC), Size-Exclusion Chromatography (SEC), Structural Aggregation Propensity (SAP), Therapeutic Antibody Developability Analysis (TA-DA), Therapeutic Antibody Profiler (TAP), Therapeutic Structural Antibody Database (Thera-SAbDab), Variable Heavy (VH), Variable Light (VL).
Introduction
The continued clinical success of monoclonal antibodies (mAbs) over the past few decades has confirmed their utility as therapeutic molecules.Citation1,Citation2 As a result, several experimental techniques have been developed, refined, and widely implemented to facilitate antibody lead identification.Citation3–5 These campaigns often result in numerous primary hits. However, lead antibodies can suffer from polyspecificity, aggregation, viscosity, immunogenicity, or chemical instability.Citation6–8 The comprehensive collection of properties required for development is known as antibody developability.Citation9 The evaluation of antibody developability early in drug discovery is preferable, as it may mitigate financial investment in a molecule unable to pass the rigors of the therapeutic approval process.
Several experimental assays exist to assess antibody developability.Citation10 To measure polyspecificity, i.e., the propensity of an antibody to bind off-target molecules, binding to baculovirus particles, polyspecificity reagent, or cross-interaction chromatography have been explored.Citation11–13 In a recent study, polyspecificity was associated with poor clearance in human clinical trials, making it a critical parameter to consider in antibody lead selection.Citation14 Beyond polyspecificity, assays exist to measure an antibody’s susceptibility to self-interact via affinity-capture self-interaction nanoparticle spectroscopy (AC-SINS) and size-exclusion chromatography (SEC). Self-interaction can drive aggregation and must be monitored and mitigated. The benefit of these assays is that they require minimal amounts of protein (< 1 mg per assay).
Assays that are more demanding of protein quantity are also critical in assessing developability.Citation10 For example, antibodies delivered through subcutaneous injections require formulation and administration at high concentrations.Citation15 Highly viscous antibodies provide substantial challenges to subcutaneous delivery and manufacturing, making it necessary to identify antibodies with low viscosity to reduce the risk of clinical failure and increase patient compliance.Citation16 Similarly, forced-degradation studies, which evaluate the chemical stability of an antibody, require several milligrams of protein.Citation17
Conducting the full spectrum of developability assays combined with binding and functional studies remains a challenge in early drug discovery because of the numerous hits detected. Thus, algorithms that can guide antibody prioritization and help eliminate poorly behaved antibodies are useful.Citation18–20 Many of the currently available algorithms rely on surface-based descriptors of predicted antibody structures to determine the developability of an antibody. One pioneering tool, the structural aggregation propensity (SAP) metric, uses the presence of solvent-exposed hydrophobic surfaces to determine developability.
In recent years, several new in silico strategies have been put forth to evaluate antibody developability.Citation20–22 Of particular note is the Therapeutic Antibody Profiler (TAP) proposed by Raybould et al.Citation20 It uses five developability attributes to identify antibodies that are differentiated from clinical-stage therapeutics (CST). Four of the profiling rules only evaluate the complementary-determining regions (CDRs) by analyzing length, presence of hydrophobic patches, presence of positive patches, and presence of negative patches. The final term considers charge symmetry across the variable domain. Thorsteinson et al. pointed out that the positive and negative patch descriptors do not separate CSTs from arbitrary antibodies.Citation21 As a result, they introduced a modified version of the algorithm that replaces the charge-based terms with new terms aligned with clinical data.
We took an alternative approach to generating a developability algorithm. We evaluated over 900 descriptors at separating CSTs from human-repertoire data. A critical assumption was that CSTs are enriched for developability attributes that are not as prevalent in repertoire antibodies. The results of Shehata et al. challenges this assumption, as B-cell derived antibodies display a distribution of biophysical properties that overlaps with the approved antibody set used in that study.Citation23 However, we used non-natively paired repertoire sequences, which may shift the biophysical properties of the repertoire set. Additionally, repertoire sequences were not screened for their ability to be produced in large quantities, concentrated, or freeze thawed, which are attributes often performed prior to clinical evaluation.
It is also important to note that not all CSTs are devoid of biophysical issues.Citation9,Citation22 For example, Ahmed et al. selected descriptors that predict that 33% of non-approved CSTs will have differential physicochemical properties from approved antibodies.Citation22 Interestingly, we identify many descriptors capable of separating CSTs from the repertoire data, though partial overlap between the CSTs and repertoire sequences remains. Several of these descriptors were combined into a single score that we introduce as the Therapeutic Antibody Developability Analysis (TA-DA), a novel antibody developability predictor.
Results
Datasets
We used two datasets to determine what differentiates clinical from repertoire antibodies. The first dataset contains the variable regions of 339 antibody sequences derived from the therapeutic structural antibody database (Thera-SAbDab).Citation24 These sequences represent antibodies that are either approved, underwent clinical evaluation, or are currently being evaluated in the clinic. Only sequences with a “Whole mAb” format assignment are evaluated. Antibody-drug conjugates are not included in this study due to concerns about the impact the varying drugs and linkers have on biophysical attributes of the final drug products.
The second dataset corresponds to variable regions from 4,929 antibodies randomly selected to represent the observed antibody space (OAS).Citation20,Citation25 These sequences were obtained via next-generation sequencing studies of human antibody repertoires. It is important to note, these specific sequences are not natively paired but are derived from a simultaneous sequence study.Citation20 These antibodies have not undergone rigorous selection criteria compared to those in the clinic.
Descriptors
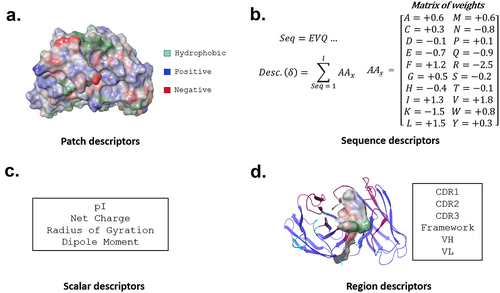
We generated homology models for the 5268 variable region sequences and calculated 910 structure and sequence-based descriptors using the BioLuminate package ().Citation26–28 These descriptors cover a range of published in silico models. For example, the descriptors contain various sequence-based hydrophobicity scales and structure-based surface models.Citation29–31 Descriptors also assess sub-sections of the variable region, such as each CDR alone and each framework region of an antibody.
Figure 1. In silico descriptor classes. Over 900 in silico descriptors were calculated for the 5268 antibody sequences used in this study. The descriptors are classified into 4 categories. (a) Patch- descriptors computed from clusters of solvent-exposed atoms. (b) Sequence descriptors that assign various propensities to each amino acid, which are then summed across the sequence of an antibody. These include, but are not limited to, secondary-structure propensity and various hydrophobicity scales. (c) Scalar descriptors are singular values which rely on interdependent interactions within the molecule, such as isoelectric point (pI) (d). Region descriptors use scores from patch and sequence descriptors but are calculated on a subset of the antibody sequence or structure (e.g., hydrophobic or charge patches in HCDR3).
Performance of descriptors
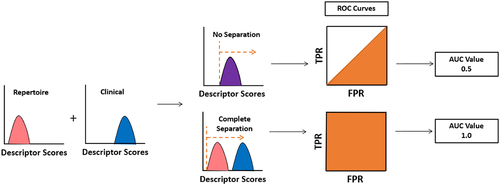
Each descriptor was evaluated for the ability to differentiate clinical antibodies from antibodies derived from the human repertoire. Since the test is binary – repertoire or clinical – a receiver operating characteristic (ROC) curve can be used (). The area under the ROC curve (AUC) allows rapid assessment of performance. Descriptors unable to separate clinical antibodies from repertoire antibodies receive a score of 0.5, while antibodies that obtain complete separation receive a score of 1.0.
Figure 2. Analysis of individual descriptors. All repertoire and clinical antibodies are scored with each descriptor. A receiver operating characteristic (ROC) curve is then calculated by setting a cutoff between repertoire and clinical sequences at the lowest value calculated, forcing all sequences to fall into one class. This cutoff is continuously adjusted until all sequences are predicted to be in the alternative class. At every cutoff, a true positive rate (TPR) and false positive rate (FPR) is determined. The area under the curve (AUC) measures the performance of each descriptor at separating clinical from repertoire.
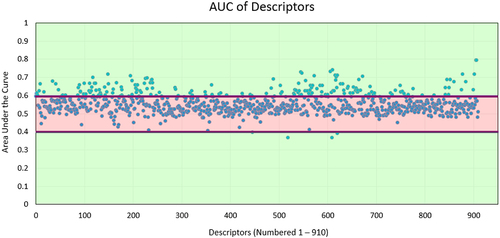
Only 144 descriptors received an AUC score above 0.6 (), indicating that many descriptors poorly separate clinical antibodies from repertoire antibodies. Interestingly, most of the top-performing descriptors (Table S1) measure the solvent exposure of hydrophobic atoms. The developability challenges created by solvent-exposed hydrophobic atoms are well-established.Citation19 Thus, unsurprisingly, many of the top-performing terms rely on this property.
Figure 3. Area under the curve (AUC) of each descriptor. The AUC value for each descriptor is calculated. Most descriptors receive an AUC close to 0.5.
Combining descriptors
After benchmarking individual descriptors, we created a single score integrating multiple properties. A unified score is beneficial since an antibody may be problematic based on several descriptors, but not to a single property. Five descriptors were chosen () and combined into a single score based on: 1) AUC, 2) diversity of the descriptor relative to the other descriptors chosen, and 3) verification that the descriptor aligns with physio-chemical intuition. Aligning with physio-chemical intuition is critical because it reduces the chance of spurious correlation, which we must be mindful of since hundreds of descriptors are evaluated in this study.
Figure 4. TA-DA – integration of five selected descriptors. Five descriptors were selected to be combined into a single score, termed TA-DA. Two of the descriptors (panels A and B) use patches (shown in red) calculated by AggScore to separate clinical antibodies from repertoire antibodies.Citation31 The third descriptor (panel C) considers the positive patches (shown in blue) in the CDRs of the light chain. The fourth descriptor (panel D), All_Atomic_Contact_Energy, rewards burial of hydrophobic atoms (shown in green) and the solvent exposure of charged atoms (shown in blue and red) and penalizes the reverse. Lastly, a sequence-based descriptor, TOP-IDP (panel E), is summed over the entire antibody sequence, with weights given to each amino acid, with lower scores being clinically enriched.Citation32
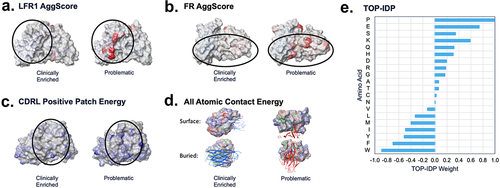
Four of the five chosen descriptors are structure-based. Two of the structure-based descriptors use the AggScore algorithm.Citation31 AggScore penalizes clusters of surface-exposed hydrophobic atoms that do not have surrounding charge patches to mitigate inter-molecular hydrophobic-hydrophobic interactions. These two descriptors differ since one considers the light chain framework one exclusively (LFR1_AggScore), while the other evaluates the entire framework of the antibody (FR_AggScore). Repertoire antibodies were enriched for hydrophobic clusters of atoms and receive higher scores from both descriptors. The third descriptor, CDRL_positive_patch_energy, quantifies solvent-exposed positively charged atoms in the light chain CDRs. In our study, repertoire antibodies were enriched for positively charged light chain CDRs relative to clinical antibodies. Others have noted that positive charge in the CDRs can drive polyspecificity.Citation33
The last two descriptors evaluate the entire variable region. One is a structure-based descriptor known as All_Atomic_contact_energy.Citation34 Lower scores for this descriptor correlate with buried hydrophobic atoms and exposure of charged or polar atoms, akin to the hydrophobic effect.Citation29,Citation35 Clinical antibodies receive lower atomic-contact energies and thus satisfy the hydrophobic effect better than repertoire antibodies. The only sequence-based descriptor chosen, TOP_IDP, assigns each amino acid a weight proportional to the frequency of appearance of that amino acid in intrinsically disordered proteins relative to ordered proteins.Citation32 It then sums the weights across the sequence to obtain a cumulative score. Clinical antibodies are enriched with order-promoting amino acids relative to repertoire antibodies.
These five descriptors were combined by taking the sum of the independent parameters and performing logistic regression (see methods). Briefly, logistic regression fits a sigmoid function by taking the log-odds as input and outputting a probability between 0 and 1. This makes logistic regression well suited for building classifiers. In this case, clinical antibodies were assigned a value of 1, and repertoire antibodies were assigned a value of 0. Since there are thousands of repertoire antibodies and only a few hundred clinical antibodies, the logistic regression model is fit by generating 1400 clinical antibodies by sampling with replacement (using the same sequence multiple times). In contrast, 1400 repertoire antibodies were randomly selected without replacement (all sequences were unique) for training. Training was performed several times to evaluate the sensitivity of the weights for each descriptor to the fitting protocol. The value of the weights used in this study along with the corresponding standard deviations are shown in Table S2. The weights show little sensitivity to varying training-set sequences, and as a result underwent minimal fluctuations.
Evaluating performance of TA-DA
A test set of 20 clinical antibodies and 20 repertoire antibodies withheld from the training data was created. The logistic-regression model hereon referred to as the Therapeutic Antibody Developability Analysis (TA-DA), was tested for its ability to separate clinical antibodies from repertoire antibodies. An AUC of 0.8 was obtained (). It is worth noting, mavrilimumab is a distinct outlier among the clinical antibodies in the test set, receiving a TA-DA score = 0.26. This low score is driven by the predicted aggregation-prone hotspots in the framework region of the antibody. Beyond traditional monoclonal antibodies, bispecific antibodies not included in the original training data provide an orthogonal test set for TA-DA. As this entire dataset is in the clinic, it is expected that all these antibodies will receive high scores (values > 0.5). Over 80% of bispecific antibodies receive high scores, further validating the algorithm ().
Figure 5. TA-DA performance on hold-out test set. Twenty clinical-stage antibodies and 20 repertoire antibodies, withheld from the training set, were scored with the Therapeutic Antibody Developability Analysis (TA-DA) model. Scores for repertoire sequences are shown on the left and scores for clinical sequences are shown on the right. AUC, confidence intervals, and p-values are reported.
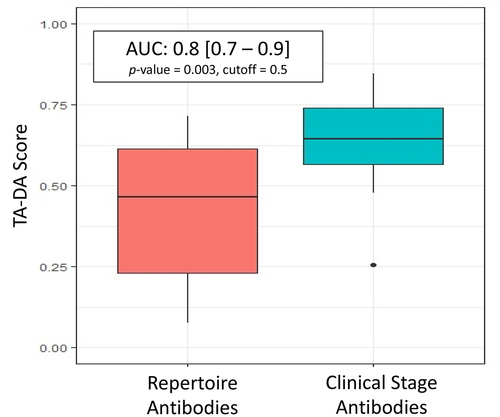
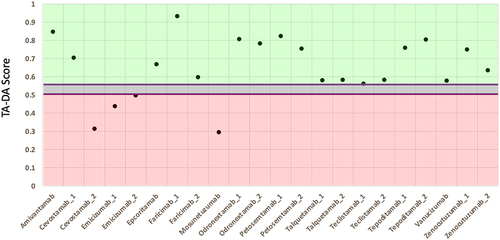
Figure 6. TA-DA performance on bispecifics. Thirteen bispecific clinical stage therapeutics (CSTs) were scored with TA-DA. Variable domains identical or closely related to the training set are removed, resulting in 22 test sequences. Scores above 0.55 are predicted to be clinical-like. 18 of the 22 variable regions receive a score above 0.55.
Discussion
Here, we quantify the ability of hundreds of in silico descriptors to separate clinical antibodies from repertoire antibodies that are not natively paired but come from a simultaneous sequence study. From this analysis, we chose five descriptors to create a unified model referred to as TA-DA, which showed the ability to separate clinical antibodies from human repertoire antibodies (AUC = 0.8 on the hold-out test set). Perfect separation of clinical antibodies from repertoire antibodies based solely on the variable region is unlikely due to differences in constant domains, formulation buffer, and manufacturing protocols, which affect the range of acceptable attributes.
Further complicating the separation of these two datasets is that repertoire antibodies have been observed to display biophysical properties on par with approved antibodies, and CST antibodies have been observed to contain problematic physicochemical characteristics.Citation9,Citation22,Citation23 Moreover, repertoire antibodies have been observed to share >95% sequence identity with CSTs in rare instances.Citation36 Thus, a degree of overlap between CSTs and human-repertoire sequences is expected. In this case, the test set of CST sequences do not share >95% sequence identity to the repertoire test set of sequences (). The highest variable heavy (VH) sequence identity pair is 86% and the highest variable light (VL) sequence identity pair is 93%. But most sequence identity pairs are below 80%. As a result, improvement in the model may still be possible.
Figure 7. Pairwise sequence identity distributions between CST and repertoire antibodies in test set. A multi-sequence alignment of the 20 CST antibodies with the 20 repertoire antibodies in the test set is performed. The 400 pairwise sequence identities are shown for the (a) variable heavy, VH and the (b) variable light, VL.
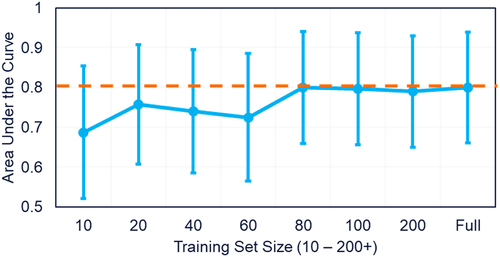
Thus, we plotted training set size versus performance to determine if increasing the dataset size would improve the separation between clinical and repertoire antibodies (). As shown in , model performance plateaus at 80 clinical antibodies, suggesting that increasing the number of clinical antibodies in the training set would not improve the model.
Figure 8. Test set performance with varying training-set size. The number of clinical antibody sequences used in the training set increased from 10 sequences to 339. Performance on a standardize hold-out test set plateaus after 80 clinical antibodies are used in the training set.
Additionally, in this study, only logistic regression was explored for model construction. However, other approaches for building a classifier exist, such as random forest. Further studies probing these alternative strategies could improve the model. We also did not explore molecular dynamics-based descriptors. These types of descriptors provide an additional avenue to refine TA-DA, as dynamics likely affect the molecular surface presented by an antibody. These types of descriptors are under investigation. However, molecular dynamics calculations significantly increase computational complexity. Thus, the benefits of these descriptors must outweigh the significant increase in runtime added.
To gain insight between the TA-DA score and biophysical properties, we compared the TA-DA score of clinical antibodies to an array of biophysical properties measured by Jain et al.Citation9 Intriguingly, TA-DA correlated best with polyspecificity assays, such as ELISA, BVP ELISA, and poly-specificity reagent. The rank-order correlations are low, with values between 0.2 and 0.3 for these polyspecificity assays (). However, considering that model fitting did not include any information from these assays, it is notable that any relationship exists.
Table 1. TA-DA vs. biophysical assays. A rank-order correlation metric is calculated between TA-DA and a dozen biophysical assays measured by Jain et al.Citation9
As with other in silico developability tools, TA-DA has several shortcomings and thus only provides a guideline for evaluating lead candidates and is not intended to be a strict rule or used in place of experimental data. For instance, TA-DA does not consider chemical modifications, which can occur to an antibody during production, storage, or in vivo circulation. Antibody chemical modifications can affect antigen binding, immunogenicity, and product homogeneity. As our understanding of chemical liabilities improves, future improvements to TA-DA may incorporate antibody chemical modifications.Citation37
Another important limitation to note is that four of the five TA-DA descriptors depend on a predicted antibody structure. Thus, the performance of TA-DA is connected to the accuracy of antibody homology models. The H3 region, by far the most challenging to predict,Citation26 could therefore create a significant hurdle for TA-DA. However, TA-DA shows limited sensitivity (TA-DA difference = 0.04) to structural differences in the predicted H3 loop of adalimumab vs. the crystal structure (4NYL), despite the inaccuracy of the H3 loop in the homology model (C⍺ RMSD = 3.2 Å). The tolerance of TA-DA to H3 misprediction stems from the structure-based descriptors focusing on the framework region of the antibody as well as the light chain CDRs. The remaining structure-based descriptor, All_Atomic_Contact_Energy, evaluates the entire variable domain, of which the H3 only makes a small portion.
The results we report here describe generation of a novel therapeutic developability score, termed TA-DA. This approach both complements and builds on current tools to assess antibody developability that are appealing from many perspectives including: 1) identifying potential issues early, 2) saving time and cost, and 3) rapid analysis requiring only minutes on a single CPU. For these reasons and advantages described, the TA-DA in silico tool addresses the need to supplement biologics discovery and development with computational approaches that can be an important contributor for selection of lead-antibody candidates.
Materials and methods
Datasets
All clinical antibody sequences were obtained from Thera-SAbDab’s dataset as of February 20, 2020.Citation24 This list of sequences was then further culled by considering only antibodies assigned a “Whole mAb” format. Furthermore, human, humanized, and a limited number of chimeric antibodies were kept in the set. The resulting list contains 339 sequences. The international nonproprietary names (INN) of the final set of sequences are provided in Table S3. As an additional orthogonal test set, 13 clinical stage antibodies that were assigned as “Bispecific mAb” by TheraSAbDab were selected for further benchmarking.
The Vander Heiden snapshot set of antibody repertoire sequences (14072) was downloaded from http://opig.stats.ox.ac.uk/resources.Citation20,Citation25 4929 sequences were randomly selected for the construction of antibody homology models. Sequences were triaged to simplify the computational complexity. Sequence identifiers for the training and test set are provided as an excel spreadsheet in the supplementary material (TA_DA_dataset.xlsx), along with descriptor values and TA-DA score.
Building homology models
Antibody homology models of variable regions were built using the BioLuminate 2019–1 release with the following command:
$SCHRODINGER/run -FROM bioluminate build_antibody.py -scheme Kabat -identity_cutoff 0.99 < FASTA_File_Name.fasta>
BioLuminate’s homology modeling protocol has been described previously.Citation26 Briefly, sequence similarity scores are calculated between the query sequence and a database of antibodies of known variable domain structure. The closest match is then used as a template for the framework region of the query sequence. A maximum sequence identity cutoff of 0.99 is set to prevent the selection of a framework crystal structure template that may exist for a clinical antibody. After framework template selection, a unique template is selected for each CDR of the antibody based on sequence similarity, CDR stem geometry, and cluster size. The advance H3 loop remodeling protocol was not implemented in this study due to its high computational cost and the number of sequences analyzed in this work.
Calculating protein descriptors
BioLuminate 2019–1 release was used to generate 910 descriptors that rely on either antibody sequence or structure using the following command:
$SCHRODINGER/run -FROM psp calc_protein_descriptors.py -i < input directory path> -o < output directory path> -jobname <jobname> -p 7.4
As stated earlier, descriptors cover a range of published models.Citation29–32 The full list of descriptors can be found in Table S1. Additionally, a random-number generator, not found in BioLuminate, was used to assign a value between 0 to 1 for all antibodies in this study.
Calculating ROC curves and performing logistic regression
The pROC package was installed and run in R version 3.4.1.Citation38 The roc() command was used to generate ROC curves and report the area under the curve (AUC). All clinical and repertoire antibodies were used in the ROC analysis. Logistic regression was performed with the glm() command using the following functional form:Citation39
Clinical_Category = X1* FR_AggScore + X2* +LFR1_AggScore + X3* + CDRL_Positive_Patch_Energy + X4* + Disorder_Propensity_TOP_IDP+ X5* + All_Atomic_Contact_Energy + Const
The training set consisted of 2800 antibody sequences. Clinical antibody sequences (totaling 1400) were randomly selected with replacement from 319 clinical antibodies. The other 1400 sequences are repertoire sequences that were pulled from the 4929 repertoire sequences without replacement. Clinical sequences were assigned a category of 1, while repertoire sequences were assigned a category of 0.
Supplemental Material
Download Zip (82.2 KB)Acknowledgments
Thanks to Schrodinger and Johannes Maier for aid with running protein descriptor code in BioLuminate.
Disclosure statement
No potential conflict of interest was reported by the author(s).
Supplementary material
Supplemental data for this article can be accessed online at https://doi.org/10.1080/19420862.2022.2080628
Additional information
Funding
References
- Buss NA, Henderson SJ, McFarlane M, Shenton JM, De Haan L. Monoclonal antibody therapeutics: history and future. Curr Opin Pharmacol. 2012;12:615–9. doi:10.1016/j.coph.2012.08.001.
- Posner J, Barrington P, Brier T, Datta-Mannan A. Monoclonal antibodies: past, present and future. Handb Exp Pharmacol. 2019;260:81–141.
- Ministro J, Manuel AM, Goncalves J. Therapeutic antibody engineering and selection strategies. Adv Biochem Eng Biotechnol. 2020;171:55–86. doi:10.1007/10_2019_116.
- Kennedy PJ, Oliveira C, Granja PL, Sarmento B. Monoclonal antibodies: technologies for early discovery and engineering. Crit Rev Biotechnol. 2018;38:394–408. doi:10.1080/07388551.2017.1357002.
- Lu RM, Hwang YC, Liu IJ, Lee CC, Tsai HZ, Li HJ, Wu HC. Development of therapeutic antibodies for the treatment of diseases. J Biomed Sci. 2020;27(1):1. doi:10.1186/s12929-019-0592-z.
- Lowe D, Dudgeon K, Rouet R, Schofield P, Jermutus L, Christ D. Aggregation, stability, and formulation of human antibody therapeutics. Adv Protein Chem Struct Biol. 2011;84:41–61.
- Walsh RE, Lannan M, Wen Y, Wang X, Moreland CA, Willency J, Knierman MD, Spindler L, Liu L, Zeng W, et al. Post-hoc assessment of the immunogenicity of three antibodies reveals distinct immune stimulatory mechanisms. mAbs. 2020;12(1):1764829. doi:10.1080/19420862.2020.1764829.
- Nowak C, Cheung K, Dellatore J,M, Katiyar S, Bhat A, Sun R, Ponniah J, Neill G, Mason A, Beck B, et al. Forced degradation of recombinant monoclonal antibodies: a practical guide. mAbs. 2017;9(8):1217–30. doi:10.1080/19420862.2017.1368602.
- Jain T, Sun T, Durand S, Hall A, Houston NR, Nett JH, Sharkey B, Bobrowicz B, Caffry I, Yu Y, et al. Biophysical properties of the clinical-stage antibody landscape. Proc Natl Acad Sci. 2017;114(5):944–49. doi:10.1073/pnas.1616408114.
- Makowski EK, Wu L, Gupta P, Tessier PM. Discovery-stage identification of drug-like antibodies using emerging experimental and computational methods. mAbs. 2021;13(1):1895540. doi:10.1080/19420862.2021.1895540.
- Hötzel I, Theil FP, Bernstein LJ, Prabhu S, Deng R, Quintana L, Lutman J, Sibia R, Chan P, Bumbaca D, et al. A strategy for risk mitigation of antibodies with fast clearance. mAbs. 2012;4(6):753–60. doi:10.4161/mabs.22189.
- Xu Y, Roach W, Sun T, Jain T, Prinz B, Yu TY, Torrey J, Thomas J, Bobrowicz P, Vásquez M, et al. Addressing polyspecificity of antibodies selected from an in vitro yeast presentation system: a FACS-based, high-throughput selection and analytical tool. Protein Eng Des Sel. 2013;26(10):663–70. doi:10.1093/protein/gzt047.
- Jacobs SA, Wu SJ, Feng Y, Bethea D, O’Neil KT. Cross-interaction chromatography: a rapid method to identify highly soluble monoclonal antibody candidates. Pharm Res. 2010;27(1):65–71. doi:10.1007/s11095-009-0007-z.
- Grinshpun B, Thorsteinson N, Pereira JN, Rippmann F, Nannemann D, Sood VD, Fomekong Nanfack Y. Identifying biophysical assays and in silico properties that enrich for slow clearance in clinical-stage therapeutic antibodies. mAbs. 2021;13(1):1932230. doi:10.1080/19420862.2021.1932230.
- Tomar DS, Kumar S, Singh SK, Goswami S, Li L. Molecular basis of high viscosity in concentrated antibody solutions: strategies for high concentration drug product development. mAbs. 2016;8(2):216–28. doi:10.1080/19420862.2015.1128606.
- Apgar JR, Tam ASP, Sorm R, Moesta S, King AC, Yang H, Kelleher K, Murphy D, D’Antona AM, Yan G, et al. Modeling and mitigation of high-concentration antibody viscosity through structure-based computer-aided protein design. PLoS One. 2020;15(5):e0232713. doi:10.1371/journal.pone.0232713.
- Halley J, Chou YR, Cicchino C, Huang M, Sharma V, Tan NC, Thakkar S, Zhou LL, Al-Azzam W, Cornen S, et al. An industry perspective on forced degradation studies of biopharmaceuticals: survey outcome and recommendations. J Pharm Sci. 2020;109(1):6–21. doi:10.1016/j.xphs.2019.09.018.
- Chennamsetty N, Voynov V, Kayser V, Helk B, Trout BL. Prediction of aggregation prone regions of therapeutic proteins. J Phys Chem B. 2010;114(19):6614–24. doi:10.1021/jp911706q.
- Lauer TM, Agrawal NJ, Chennamsetty N, Egodage K, Helk B, Trout BL. Developability index: a rapid in silico tool for the screening of antibody aggregation propensity. J Pharm Sci. 2012;101(1):102–15. doi:10.1002/jps.22758.
- Raybould MIJ, Marks C, Krawczuk K, Taddese B, Nowak J, Lewis AP, Bujotzek A, Shi J, Deane CM. Five computational developability guidelines for therapeutic antibody profiling. Proc Natl Acad Sci. 2019;116(10):4025–30. doi:10.1073/pnas.1810576116.
- Thorsteinson N, Gunn JR, Kelly K, Long W, Labute P. Structure-based charge calculations for predicting isoelectric point, viscosity, clearance, and profiling antibody therapeutics. mAbs. 2021;13(1):1981805. doi:10.1080/19420862.2021.1981805.
- Ahmed L, Gupta P, Martin KP, Scheer JM, Nixon AE, Kumar S. Intrinsic physicochemical profile of marketed antibody-based biotherapeutics. Proc Natl Acad Sci. 2021;118(37):e2020577118. doi:10.1073/pnas.2020577118.
- Shehata L, Maurer DP, Wec AZ, Lilov A, Champney E, Sun T, Archambault K, Burnina I, Lynaugh H, Zhi X, et al. Affinity maturation enhances antibody specificity but compromises conformational stability. Cell Rep. 2019;28(13):3300–3308.e4. doi:10.1016/j.celrep.2019.08.056.
- Raybould MIJ, Marks C, Lewis AP, Shi J, Bujotzek A, Taddese B, Deane CM. Thera-SAbDab: the therapeutic structural antibody database. Nucleic Acids Res. 2020;48(D1):D383–D388. doi:10.1093/nar/gkz827.
- Kovaltsuk A, Leem J, Kelm S, Snowden J, Deane CM, Krawczyk K. Observed antibody space: a resource for data mining next-generation sequencing of antibody repertoires. J Immunol. 2018;201:2502–09. doi:10.4049/jimmunol.1800708.
- Zhu K, Day T, Warshaviak D, Murrett C, Friesner R, Pearlman D. Antibody structure determination using a combination of homology modeling, energy-based refinement, and loop prediction. Proteins. 2014;82(8):1646–55. doi:10.1002/prot.24551.
- Salam NK, Adzhigirey M, Sherman W, Pearlman DA. Structure-based approach to the prediction of disulfide bonds in proteins. Protein Eng Des Sel. 2014;27:365–74. doi:10.1093/protein/gzu017.
- Beard H, Cholleti A, Pearlman D, Sherman W, Loving KA. Applying physics-based scoring to calculate free energies of binding for single amino acid mutations in protein-protein complexes. Salsbury,Jr F, editor. PLoS One. 2013;8:e82849. doi:10.1371/journal.pone.0082849.
- Tanford C. Contribution of hydrophobic interaction to the stability of the globular conformations of proteins. J Am Chem Soc. 1962;84:4240–74. doi:10.1021/ja00881a009.
- Kyte J, Doolittle RF. A simple method for displaying the hydropathic character of a protein. J Mol Biol. 1982;157(1):105–32. doi:10.1016/0022-2836(82)90515-0.
- Sankar K, Krystek SR Jr, Carl SM, Day T, Maier JKX. AggScore: prediction of aggregation-prone regions in proteins based on the distribution of surface patches. Proteins. 2018;86(11):1147–56. doi:10.1002/prot.25594.
- Campen A, Williams RM, Brown CJ, Meng J, Uversky VN, Dunker AK. TOP-IDP-scale: a new amino acid scale measuring propensity for intrinsic disorder. Protein Pept Lett. 2008;15(9):956–63. doi:10.2174/092986608785849164.
- Rabia LA, Zhang Y, Ludwig SD, Julian MC, Tessier PM. Net charge of antibody complementarity-determining regions is a key predictor of specificity. Protein Eng Des Sel. 2018;31(11):409–18. doi:10.1093/protein/gzz002.
- Zhang C, Vasmatzis G, Cornette JL, DeLisi C. Determination of atomic desolvation energies from the structures of crystallized proteins. J Mol Biol. 1997;267(3):707–26. doi:10.1006/jmbi.1996.0859.
- Camilloni C, Bonetti D, Morrone A, Giri R, Dobson CM, Brunori M, Gianni S, Vendruscolo M. Towards a structural biology of the hydrophobic effect in protein folding. Sci Rep. 2016;6:28285. doi:10.1038/srep28285.
- Krawczyk K, Raybould MIJ, Kovaltsuk A, Deane CM. Looking for therapeutic antibodies in next-generation sequencing repositories. mAbs. 2019;11(7):1197–205. doi:10.1080/19420862.2019.1633884.
- Delmar JA, Wang J, Choi SW, Martins JA, Mikhail JP. Machine learning enables accurate prediction of asparagine deamidation probability and rate. Mol Ther Methods Clin Dev. 2019;15:264–74. doi:10.1016/j.omtm.2019.09.008.
- Robin X, Turck N, Hainard A, Tiberti N, Lisacek F, Sanchez J, Müller M. pROC: an open-source package for R and S+ to analyze and compare ROC curves. BMC Bioinform. 2011;12:77. doi:10.1186/1471-2105-12-77.
- Friedman J, Hastie T, Tibshirani R. Regularization paths for generalized linear models via coordinate descent. J Statis Softw. 2010;33(1):1–22. doi:10.18637/jss.v033.i01.