
 ?Mathematical formulae have been encoded as MathML and are displayed in this HTML version using MathJax in order to improve their display. Uncheck the box to turn MathJax off. This feature requires Javascript. Click on a formula to zoom.
ABSTRACT
The reliable and cost-efficient manufacturing of monoclonal antibodies (mAbs) is essential to fulfil their ever-growing demand. Cell death in bioreactors reduces productivity and product quality, and is largely attributed to apoptosis. In perfusion bioreactors, this leads to the necessity of a bleed stream, which negatively affects the overall process economy. To combat this limitation, death-resistant Chinese hamster ovary cell lines were developed by simultaneously knocking out the apoptosis effector proteins Bak1, Bax, and Bok with CRISPR technology. These cell lines were cultured in fed-batch and perfusion bioreactors and compared to an unmodified control cell line. In fed-batch, the death-resistant cell lines showed higher cell densities and longer culture durations, lasting nearly a month under standard culture conditions. In perfusion, the death-resistant cell lines showed slower drops in viability and displayed an arrest in cell division after which cell size increased instead. Pertinently, the death-resistant cell lines demonstrated the ability to be cultured for several weeks without bleed, and achieved similar volumetric productivities at lower cell densities than that of the control cell line. Perfusion culture reduced fragmentation of the mAb produced, and the death-resistant cell lines showed increased glycosylation in the light chain in both bioreactor modes. These data demonstrate that rationally engineered death-resistant cell lines are ideal for mAb production in perfusion culture, negating the need to bleed the bioreactor whilst maintaining product quantity and quality.
Introduction
The application of death-resistant (DR) Chinese hamster ovary (CHO) cell lines to perfusion culture has been speculated as a mean of increasing viable cell density, viability, and product quality.1–Citation3 It has been hypothesized that such cell lines would benefit from a reduction of metabolic demands required to generate replacement biomass and may instead yield extra product or reduce media consumption, thereby reducing the cost of goods. DR cell lines would also theoretically reduce the bleed necessary to maintain a healthy culture and mitigate the associated losses in product and viable biomass. The reduction in dead cells and debris would also make purification easier and reduce filter clogging. Despite these very alluring hypotheses and the long history of perfusion culture, only limited forays have been made in this field,Citation4–7 due to the complexities of cell line development and perfusion bioreactor setup.
Since 2017, however, the rate of publications involving CHO cell culture in perfusion has increased dramatically, heralding a resurgence of interest in the culture method.Citation8 Recent publications from pharmaceutical companies, such as Amgen,Citation9,Citation10 Pfizer,Citation11,Citation12 Merck,Citation13–15 and Bristol-Myers-Squibb,Citation16–18 highlight the growing commercial interest in perfusion. This renewed interest coincides with profound developments in cell line engineering strategies, notably CRISPR technology, and several ‘omics tools, including the CHO-K1 genome.Citation19–22 The widespread use of CHO cells in the biopharmaceutical industry, and the growth of the industry itself, is driving demand for improved cell line development strategies. While traditional applications use clonal selection techniques and glutamine synthetase or dihydrofolate reductase systems to isolate cell lines with favorable characteristics, the possibility for systems biology and rational engineering approaches now holds great promise.Citation23–25
Historically, most bioprocesses have used fed-batch culture methods for production, but this method typically ends with a culture viability ‘crash’. Perfusion cultures, on the other hand, continuously supply fresh media and remove cell-free supernatant, which extends culture duration. As cell death still occurs in perfusion cultures, a bleed stream removes culture from the bioreactor to prevent the accumulation of dead cells and maintain high viability. As this stream is normally not purified separately, 10–30% of the culture volume are lost daily.Citation26 Attempts to reduce losses associated with the bleed stream have focused on the reduction of growth rate by the means of either temperature shift, a growth,Citation27 or perfusion rate,Citation12 while attempts to directly reduce cell death through genetic engineering are scarce. Nivitchanyong et al. showed that it was possible to increase the viability of baby hamster kidney cells at very low perfusion rates of 0.15 nL/cell/day with the overexpression of the anti-apoptotic genes Aven and E1B-19 K.Citation6
In fed-batch cultures, however, cell death has been reduced through genetic engineering strategies to extend the culture duration. Apoptosis, as a deliberate, controlled cellular process, has been the natural target for genetic engineering of such DR cell lines since the late 1980s.1,Citation2,Citation28 A broad range of apoptosis-related targets have been tested, including caspases, heat shock proteins, and cell cycle regulators. However, the most widely studied set of targets has been the Bcl-2 family of proteins (BFPs). BFPs are classified as activators, inhibitors, or effectors depending on their role in the signaling network, with the latter class being responsible for the initiation of apoptosis by the intrinsic, mitochondria-mediated pathway of apoptosis.Citation1
Bak1 and Bax are the two best-characterized BFP effectors and are known to cause mitochondrial outer membrane permeabilization (MOMP), at which point cell death is irreversible.Citation28–32 Owing to their pivotal effector role in MOMP-mediated apoptosis, and no reported adverse effects when deleted,Citation1 Bak1 and Bax are obvious targets for genetic engineering of DR cell lines. Knockout and knockdown of these genes have shown near-universally positive results in fed-batch, but have never been assessed in perfusion culture to our knowledge.Citation19,Citation33–36 Bok, the only other known BFP effector, shares structural homology to Bak1 and Bax.Citation37 Bok has been shown to elicit MOMP-mediated apoptosis in the absence of Bak1 and Bax, and is speculated to play a role in the unfolded protein response.Citation38–40 The Bok gene is present and annotated in the CHO-K1 genome, though its function has not been fully experimentally tested yet.Citation41 Nevertheless, with the relative simplicity offered by CRISPR-mediated genetic editing, the knockout of Bok is also a logical target in engineering DR to prevent any residual function it may have as an effector of apoptosis.
The knockout of all BFP effectors eliminates a major apoptotic pathway that is the main source of cell death seen in CHO cells in bioreactors under controlled conditions.Citation2,Citation42 These findings are expected to translate to perfusion processes due to the widespread use of standardized media formulations and bioreactor setups (retention device notwithstanding). In perfusion, however, cell death can be reduced by constant feeding and the removal of inhibitory substrates, thus leading to significantly increased cell densities. Whether high cell density can act as a stimulus for cell death or acts as an inhibitor of growth remains to be explored.
Here, we used a previously generated triple-knockout cell line, deficient in Bak1, Bax, and Bok, to manufacture a therapeutic monoclonal antibody (mAb).Citation43 These cell lines were cultured in fed-batch and perfusion bioreactors modes alongside control cell lines that had undergone the same cloning process, but with a nonfunctional transfection vector. Product quality was assessed in the context of fed-batch vs perfusion bioreactor conditions, and control vs DR cell lines. In doing so, we aimed to illustrate the capabilities of apoptosis-resistant cell lines to circumvent a bleed stream under perfusion conditions.
Results
Fed-batch
A total of five 1 L bioreactors (600 mL working volume) with 2 different cell lines, one DR (‘DR1’) and one control (‘X’) cell line were run in fed-batch mode. Runs were split up into run 1 (DR1-1 and X-1) and batch 2 (DR1-2, DR1-3, and X-2) and are displayed separately. Differences between DR and control cell lines were consistent between batches.
Viable cell density (VCD), viability, and cell size are displayed in . The DR1 cell line achieved higher maximum cell densities of 15 and 18 × 106 cells/mL compared to 11 and 15 × 106 cells/mL in batches 1 and 2, respectively. For all fed-batch bioreactors, the average viable cell size increased from 15 to 19.5 µm from the beginning of the run to the point of viability crash, which was day 14 for control cultures and day 23 for DR1 cultures. After this point, viable cell diameters decreased until the harvesting viabilities of less than 85% was reached. These harvest viabilities were reached on day 19 for the control cultures and on day 26 or 27 for DR1 cell cultures.
Figure 1. Viable cell density (VCD) in 106 cells/mL, viability in %, and cell diameter in µm for death- resistant cell line 1 (DR1, filled circles) and control cell line (X, empty triangles) over time in fed-batch cultures. Results for batch 1 and 2 are displayed on the left and right sides, respectively.
Similar trends with consistent, small differences were observed between cell lines when comparing osmolarity and the key inhibitory metabolites lactate and ammonia (). Lactate levels in all cultures increased to up to 25 mM within the first 6 days before cells switched to lactate consumption. Lactate levels in DR1 cultures were approximately 3 mM lower than the control, and lactate levels rose again gradually after the consumption period. In control cultures, lactate reached 6 mM prior to the termination of the run. However, the extended duration of DR1 cultures saw lactate concentrations reach 25 mM in an exponential manner. Ammonia and osmolarity increased steadily throughout the runs, but remained relatively constant during the lactate consumption period. DR1 cultures showed an average of 1 mM higher ammonium concentration and 30 mOsm lower osmolarities compared to control cultures during comparable periods. The control cultures' final ammonia and osmolarity levelswere approximately 5 mM and 500 mOsm, respectively. Due to the extended culture durations of DR1 cell lines, these levels were much higher, at 10–15 mM and 610 mOsm, respectively. This change is pronounced enough to suggest a second metabolic switch was activated exclusively in DR cell lines, most likely due to the culture conditions at this time point.
Figure 2. Lactate and ammonia in mM and osmolarity in mOsm for death-resistant cell line 1 (DR1, filled circles) and control (X, empty triangles) cell lines in fed-batch cultures over time. Results for runs 1 and 2 are displayed on the left and right sides, respectively.
Antibody titers for the control cell line increased up to day 18 before slightly dropping on the last day of culture when viability dropped below 85%. For DR1 cultures, titers peaked around day 21 and then continuously decreased (), despite viabilities of over 90% at the beginning of this period (). In particular, for X-2, an increase in titer for the control compared to the DR cell line was observed. The cell-specific productivity qp was calculated as the slope of the product titer plotted against the integrated viable cell density (IVCD) and averaged for DR1 (n = 3) and X (n = 2). Over comparable periods, the control cell line tended to have higher specific productivities than DR1 cultures. The same holds true when considering the biomass-specific productivity. The drop in titer from day 21 onwards in DR1 does partially explain the significantly lower qp as it was calculated over the entire duration of the culture.
Figure 3. Product titer over the time of fed-batch cultures for death resistant cell line 1 (DR1, filled circles) and control cell line (X, empty triangles) in batch 1 and 2 are displayed on the left and right side, respectively. The cell specific productivity (qp) and biomass specific productivity (qp,biomass) averaged for X and DR1 cultures is displayed at the bottom left and right, respectively. The bar height represents the mean and error bars indicate 1 standard deviation.
Perfusion
Three cell lines were each run once in perfusion culture. These included the aforementioned DR1 and X cell lines, along with another DR cell line from the same cloning process; DR2. Each perfusion run lasted between 27 and 32 days with a steady-state at approximately 65 × 106 cells/mL for 8 days.
VCD, viability, cell diameter, and the bleed rate are shown in . As indicated by the VCD, a ‘steady state’ was reached after 10 days for all cultures. DR1 grew beyond the intended cell density in the initial phase due to an unexpected decline in cell diameter, which was not detected by the capacitance-based biomass probe, requiring manual bleed control. The bleed rate necessary to maintain a stable cell density between days 10 and 18 varied substantially between runs. Values between 11% and 18% were seen for the control cell line. DR1 showed a high of 12% bleed before gradually decreasing for the remaining time of ‘steady state’ operation. DR2, did not trigger any bleed as cell densities remained at or below 65 × 106 cells/mL for the full run. The main difference between the DR and control cell lines was that the control cell line increased in VCD to 95 × 106 cells/mL after bleeding, before decreasing in number and viability. Conversely, the DR cell lines did not show any further growth, but increased in cell diameter by up to 2 µm more than the control. The DR cultures also did not crash after the bleed was halted, with DR1 remaining over 92% viability and DR over 96%.
Figure 4. Viable cell density (VCD) in 106 cells/mL, viability, and bleed rate in %, and cell diameter in µm for death resistant (DR1 and 2, filled circles) and control (X, empty triangles) cell lines in perfusion culture. From day 10 to 18 a capacitance probe-controlled bleed at approximately 65 × 106 cells/mL.
One of the main advantages of perfusion over fed-batch cultures is the constant removal of inhibitory by-products. This was confirmed here by comparing the main inhibitors, lactate, and ammonia (), against the values observed in fed-batch mode (). Even though similarly high lactate values of up to 27 mM were observed in the initial phase, lactate concentrations stayed below 5 mM in perfusion, despite much higher VCDs. DR2 and X showed a minor increase toward the culture end, coinciding with a decrease in viability for the latter. The perfusion process also reduced ammonium concentrations to consistently half the values seen in fed-batch. Similar to fed-batch, DR cell lines also had approximately 1 mM higher ammonium concentrations than controls. Osmolarities did not differ between cell lines, dropping sharply after day 5 (two days after starting perfusion) to remain consistently under 300 mOsm. Besides the low osmolarity observed, we concluded that the DR culture was not amino acid limited. Cell line specific differences in amino acid consumption patterns were observed, but only asparagine was completely consumed. Asparagine has been classified as not growth limitingCitation44 (Supplementary material Figure 1).
Figure 5. Lactate and ammonia in mM and osmolarity in mOsm for death resistant (DR1 and 2, filled circles) and control (X, empty triangles) cell lines in perfusion culture. The culture was run in batch mode up to day 3, then perfusion was initiated.
The antibody titer was monitored in the reactor supernatant and permeate stream throughout the runs (Supplementary material Figure 2). Cell-specific productivity qp and biomass-specific productivity qp,biomass were calculated for cultures during and after a capacitance probe-controlled bleed, designated as phase I and phase II, respectively ().
Figure 6. VCD with indicated phases I and II separation for death resistant (DR1 and 2, filled circles) and control (X, empty triangles) cell lines in perfusion culture (top panel). Phase I is defined as time during which a capacitance probe-based bleed was active. Phase II is the remainder of the culture time during no bleed was active. A dotted line represents the termination of the bleed stream post the sample on day 17. The corresponding daily cell specific productivity is displayed in the bottom panel to the left and the biomass specific productivity to the right. Bottom and top whiskers are presenting minimum and maximum values, respectively and lower and upper quartiles are represented by the box with the median as a line in between. Significance levels correspond to p < .01 = ** and p < .0001 = ****. In phase I n = 7 for all runs, in phase II n = 15, n = 10, n = 14 for DR1, DR2 and X, respectively.
Interestingly, the average titers of all cell lines were mostly comparable during both phases. The similar VCD profiles thus yielded consistent qp in phase I for all cell lines, and between phase I and phase II for DR cell lines that experienced growth arrest. The growth of the control cell line in phase II without a corresponding increase in titer, however, decreased qp during this period. The observations hold true when the increase in cell diameter is taken in consideration. Again, the biomass-specific productivity is comparable across cultures during phase 1, but decreases more significantly for the control culture in phase 2
Product quality
Aiming to assess the effects of the DR knockouts on the product quality, protein A purified supernatant samples from fed-batch cultures on days 19 (end of control culture) and 26 (end of DR1 cultures) were analyzed. Samples were run in reduced and non-reduced forms using capillary gel-electrophoresis (). Following the same principles of standard SDS-gel electrophoresis, the capillary setup allows for more reproducible quantification.Citation45 Regarding perfusion cultures, supernatant and permeate samples on day 17 (end of steady-state) and the end of the run were analyzed. Additional samples from the perfusion control culture (X) on day 28 (i.e., prior to the decline in viability) were included. As no significant, time-dependent differences within clones were observed (Supplementary Table 1 and Table 2), samples were pooled according to cell lines. Additionally, samples for the control cell lines on days 28 and 32 did not differ and were similarly pooled together.
Figure 7. Product quality data as obtained by capillary gel electrophoresis for fed-batch and perfusion runs are displayed on the left and right, respectively. Antibodies were analyzed in reduced (top) and non-reduced (bottom) forms. When reduced, the percentages of the glycosylated heavy chain (HC glyc.), non-glycosylated heavy chain (HC non-glyc.), glycosylated light chain (LC glyc.) and non-glycosylated light chain (LC non-glyc.) are displayed from left to right. For DR1 samples day19 and day26 n = 3, for X day19 n = 2.
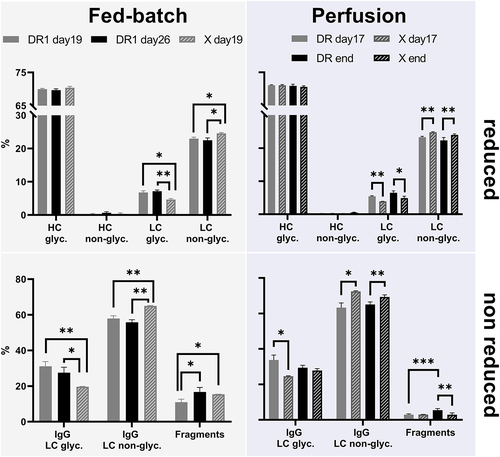
Overall, similar glycosylation patterns of heavy and light chains were observed (, top left and right). However, comparing the light chain’s glycosylation in fed-batch between harvest on day 19 (X) and on day 26 (DR), an increase in glycosylation of 54% was observed for the apoptosis-resistant cell line. A similar increase on average of 31% was seen in perfusion cultures.
The observed glycosylation of the light chain, even though uncommon for pharmaceutical mAbs, is to be expected for m104.2. Running the m104.2 produced under standard conditions did yield a similar pattern (Supplementary material Figure 3). However, the data was not included in the graph presented above, as differences in media, culture duration, and feeding regime do not allow a reliable comparison.
These differences in the light chain’s glycosylation were confirmed when samples were run in non-reduced form (, bottom left and right). An increase of the fully expressed antibody with glycosylated light chain compared to the non-glycosylated light chain was seen independent from the DR cell line’s culture mode compared to the control. Additionally, a clear reduction of mAb fragmentation in perfusion cultures was observed.
Aiming to reveal the potential impact of changing glycosylation patterns on antibody binding, association (ka) and dissociation constant (kd) were evaluated using a Biacore T800. No significant difference between cell lines and culture modes was observed, with a kd of 7.01 × 10–Citation5 ± 1.87*10–Citation5 ms−Citation1 and ka of 9.10 × 10⁴ ± 0.71 × 10⁴ s−1 across samples (Supplementary material Figure 4).
Additionally, glycans present were analyzed in their structure using mass spectrometry. Glycans discovered were compared to the standard for which glycans were confirmed previously by an external provider (). With the exception of DR1-1 and X-1, the same glycans identified in the standard were identified in all other fractions. Notably, all missing glycans are located on the light chain. Further, DR1-1 day 19 did not show data for the light chain at all, indicating that glycans missing might be a result of the mass spectrometry analysis, rather than the product itself.
Table 1. Glycans identified on the light and heavy chains of purified mAbs from fed-batch and perfusion compared to a standard produced under established standard manufacturing procedures. Samples for perfusion cultures were analyzed from the supernatant fraction. Glycan mass is given in m/z for the double oxidized form.
Discussion
The results of the fed-batch experiments provide important context for the application of DR cell lines in perfusion bioreactors. In this regard, growth rates, cell sizes, and metabolic profiles were very similar between cell lines. During periods of comparable culture conditions, the control culture showed approximately 15% higher overall volumetric productivity, which may be due to clonal variation or a tradeoff between product and biomass generation. The similarity of these parameters indicates that the cell lines have minimal biological variation and are suitable for comparison in a bioprocess context. Importantly, the fed-batch experiments showed that the DR1 cultures reached higher VCDs, and delayed and slowed viability crashes. These behaviors are in agreement with prior observations in the literature of Bak-/Bax- CHO cell lines.Citation19,Citation33,Citation34,Citation36 Generally, however, these profiles result in increased IVCDs, which yield increased titers.Citation1 In this case, the DR1 cultures had lower titers and increased product fragmentation than those of the control cultures. This was likely a result of the feed regime being poorly optimized for such long culture durations, leading to overconcentration and imbalanced nutrient profiles. This created extreme culture environments (>600 mOsm) for the DR1 cells that may have caused phenotypic changes and product degradation. Hyperosmolarity has further been linked to increased cell diameter and the formation of multiple nuclei.Citation46 Under optimized feed conditions, apoptosis-resistant cell lines, including Bak-/Bax- CHO cell lines, have characteristically shown higher titers, often based on prolonged culture durations.Citation1 It only can be speculated that this might hold true for the here presented cell line, as well once feeding regimes have been optimized. The longer-sustained viability of the DR1 cell lines under these sub-optimal conditions does, however, serve to verify the ‘death resistance’ of this mAb-producing cell line in a bioprocessing context.
Of even more interest was the behavior of the knockout cell line under perfusion condition as the potential of reducing the bleed stream is of significant industrial interest.Citation6,Citation12,Citation27,Citation47 This resilience was demonstrated early in the perfusion cultures, where the control culture viability was already steadily decreasing, while the DR cell lines remained over 98% viability. After the bleed period, the control culture’s viability had been raised back to comparable levels, and subsequently allowed growth to 95 × 106 cells/mL. The DR cell lines, on the other hand, did not increase in cell number after the steady-state, and instead increased in cell diameter. The total biomass remained relatively constant in phase II for both DR cell lines, but increased for the control (Supplementary material Figure 5). Without further application of bleed, however, the control culture steadily decreased in viability and crashed. Both DR cell lines reached apparently stable viabilities well over 90%. While the DR cell lines show a very gradual decrease in VCD, they both had consistently positive growth rates. The discrepancy is caused by the growth rates of DR cell lines being marginally lower than the daily sampling rate of 1.5% RV/d (Supplementary material Figure 6). The higher VCD but lower viability of DR1 compared to DR2 might suggest that these cell lines had similar death rates. More importantly, the death rates in these DR cell lines are low enough that filtration and/or disintegration of dead cells in a perfusion process is sufficient to maintain viabilities constantly over 90%. This negates the requirement for a bleed stream.
While the cost of such a high viability equilibrium is a reduced VCD compared to control cell lines, it is important to note that DR1 was bled at high viability to maintain VCD during the first steady-state. This bleed accounted for the removal of ~25 × 106 cells/mL during the steady-state period. The practical operating VCD of the control is also certain to be less than the maximum VCD, as a bleed would be required to maintain viability. Therefore, the lower VCDs of DR1 and DR2 may actually not differ from the control in a practical bioprocessing context. Additionally, cultures are often bled at high VCDs, regardless of viability, to prevent fouling and pump failure. In the case of DR cell lines, the reduced growth and biomass accumulation mitigate this need for bleed. Therefore, by eliminating the need to bleed perfusion reactors, DR CHO cell lines improve overall process productivity while simultaneously minimizing waste and reducing the complexity of the unit operation.
Ideally, without the need to replace bleed or dead cells, the cultures’ metabolic demands could be focused on productivity. Interestingly, in this case, each perfusion culture’s volumetric productivity, i.e., titer, was approximately equal, and relatively constant after approximately 10 days (Supplementary material Figure 2). This point of maximum, sustained productivity also coincided very closely with the growth arrests of each knockout cell line. In the control cell line, the termination of the bleed lead to an increased VCD and simultaneously reduced qp, which may potentially indicate a VCD or time-based metabolic switch in each of the cell lines tested. A specific medium limitation may also explain the phenomenon, though biomass generation still occurred in each cell line, whether by VCD or diameter, throughout the run. This again inadvertently benefits the DR cell lines, as their lower VCDs and biomass are compensated for by higher qp.
Finally, product quality in perfusion processes was similar to the fed-batch, but with a 3-fold reduction in incomplete fragments. The DR cell lines showed higher glycosylation in the mAb light chain, but the difference was less pronounced between knockouts and controls than in fed-batch. Binding activity assays showed no significant difference between the products of either process, and both were comparable to a control batch of the product. The same comparability was observed for the type of N-glycans present. Differences observed are likely due to detection limitations, as no trend was noted across replicates. The reduced fragmentation and increased glycosylation, but overall comparability in final product quality, is frequently observed as a result of both the transition to perfusion and in the engineering of DR cell lines.Citation10,Citation48–50 Further elution on the different glycans formed would be necessary to come to a definitive conclusion on the impact.
Our results were generated with a cell line deficient for bak1, bax, and bok. Effects of bok in CHO cells had not been previously studied and recent work has shown that its effects on the apoptosis-resistant properties of the cell line can be neglected.Citation43 Nevertheless, the above shown results are valid and show the potential of apoptosis-resistant cell cultures to avoid bleed streams in perfusion cultures.
While the phenomenon limiting cell division in DR cultures in perfusion culture was unexpected, it appears to be inadvertently beneficial to the overall process: maintaining the same overall productivity and product quality while negating the need for bleed. By avoiding a loss of on average 10–30% per day associated top the bleed stream, the upstream culture could be up to almost a third more productive. Putting this into a financial context, including work hours, materials, and operational setup, holds the potential for a tremendous gain on an industrial level. The metabolic and proteomic profiles of this unique and potentially very convenient culture profile may yield essential understandings in the improvement of perfusion-specific cell lines, as well as media and process conditions.
Material and methods
Cell line development
The parental cell line used in this study was derived from CHO-K1 and stably expresses the human mAb m104.2 against the Hendra and Nipah viruses.Citation51–53 This cell line was transfected via electroporation with CRISPR-Cas9-expressing, PX-458-based plasmids containing sgRNAs against Bak1, Bax, and Bok for DR cell lines, or a nonfunctional sgRNA (PX-458) for the control cell line (X). Cell lines were cloned via FACS (BD FACSAriaTM) enrichment by GFP+ sorting, and knockouts verified by Sanger sequencing and mass spectrometry. The anti-apoptotic properties of the cell line have been confirmed in previous work.Citation43 All cell lines were adapted for culture in CHOKO CELLCA SMD media (Sigma-Aldrich, US) supplemented with 0.4% anti-clumping agent (Gibco, US). Prior to culture in bioreactors, each cell line was cultured in shake flasks (Corning, US) at 37°C, 8% CO2, 130 rpm and 82% humidity for a minimum of two weeks of routine passaging. The cell lines show defined and reproducible phenotypes in terms of growth rate and response to apoptotic stimuli.
Fed-batch cultures
A total of five fed-batch cultures with two different cell lines, one DR (‘DR1’), and one control (‘X’) cell line were run in a 1 L Mini-Bioreactor (Applikon Biotechnologies, NL) and operated at 200 rpm, 36.5°C, pH 7.00, and dissolved oxygen (DO) at 50% air saturation. Stirrer speeds were increased to up to 350 rpm as necessary to maintain DO (Supplementary material Figure 7 and 8). pH was controlled by CO2 and sodium bicarbonate (Sigma-Aldrich, US) at 70 g/L. Bioreactors were inoculated at 0.5 × 10⁶ viable cells/mL at a starting volume of 600 mL of CHOKO Cellca SMD media (Sigma-Aldrich, US). Cultures were fed on days 3, 5, and then daily from day 7, with a discontinuous feed of 3.2% CHOKO Cellca FMA (FMA) and 0.32% CHOKO Cellca FMB (FMB) (Sigma-Aldrich, US). Glucose concentrations were monitored daily by a BioProfile® FLEX2™ or FLEX™ Automated Cell Culture Analyzer (Nova Biomedical, US). If glucose concentration dropped below 3 g/L, a 45% glucose solution was fed to increase concentrations to 6 g/L. Antifoam solution was similarly added when needed. To prevent accumulation over the prolonged culture durations, the daily sampling volumes were increased to offset the feed volumes when bioreactor volumes reached 600 mL. Cultures were terminated once viabilities dropped below 85%, as product quality and titers became reduced in all cell lines beyond this point.
Perfusion culture
Perfusion cultures were performed in a 3 L stirred tank (Sartorius, DE) with 1.2 L working volume. An ATF2 with 0.2 µm hollow fibre membrane (Refine Technologies, US) was used for cell retention. Cultivation began with CHOKO Cellca SMD media (Sigma-Aldrich, US) supplemented with 0.4% anti-clumping agent and cells were seeded at 0.5 × 10⁶ viable cells/mL. The temperature was controlled at 36.5°C and pH 7.00 was maintained throughout the run by addition of CO2 or sodium bicarbonate at 70 g/L. DO was set to 50% and controlled by the addition of O2 and stirring speed ranging from 150 to 350 rpm. After 72 hours, CHOKO Cellca SMD media (Sigma-Aldrich, US) containing 3.2% CHOKO Cellca FMA (FMA) and 0.32% CHOKO Cellca FMB (FMB) (Sigma-Aldrich, US) was perfused at a rate of 1.2 L per day (i.e., 1 RV/d). The perfusion rate was controlled using Shell Software (Sartorius, DE) and balances under the reactor, feed medium, and permeate. Biomass was measured online by a capacitance-based biomass probe (ABER, US) (Supplementary material Figure 5). Where applicable, a semi-discontinuous bleed was automatically triggered based on readings from the biomass probe correlating to the desired cell density. This bleed was achieved through a double-headed pump, facilitating simultaneous bleed and media compensation. An additional glucose feed using 45% w/v glucose (Sigma-Aldrich, US) was continuously fed as necessary to maintain glucose concentrations of 1 g/L. FoamAway (Gibco, US) was also added continuously as needed.
Sampling and analyses
Daily samples of culture and supernatant were taken for cell counts and metabolites and product quantification. VCD, viability, and cell diameter were measured using a Vi-CELL BLU Cell Viability Analyzer (Beckman Coulter, US). From the supernatant, quantification of glucose, lactate, ammonia, glutamine, glutamate concentrations, and osmolarity was performed using a BioProfile® FLEX2™ or FLEX™ Automated Cell Culture Analyzer (Nova Biomedical, US). Antibody titers were determined using a Biacore T100 SPR-system with HBS-P+ buffer and Protein A chip (Cytivia, US). Supernatant for later product quality analysis was stored at −80°C.
Antibodies were isolated from the culture supernatant using the NabTM Protein A Plus Spin Kit, 0.2 mL (Thermo Scientific, US) according to the manufacturer’s instructions. The purified product was stored at −80°C until analyzed using the SciEx MW ladder kit (SciEx, US) in combination with a photodiode array-detector equipped PA-800 Pharmaceutical Analysis System (SciEx, USA). Purified antibodies were run in reduced and non-reduced forms and analyzed using the 32 Karat™ software package v10.1 (SciEx, US).
Binding kinetics of the produced mAbs were assessed using a Biacore 8 K+ equipped with a Protein A sensor chip (Cytiva, SE), with HBS-P+ buffer (Cytiva, SE). Antibodies were captured over Fc2 for 10 seconds at a flow rate of 30 µL/min at a concentration of 1 µg/mL, before being exposed to 127 nM, 42 nM, 14 nM, 4.7 nM, and 1.6 nM of antigen over both flow cells using a single-cycle kinetics format. The surface was regenerated using 10 mM glycine, pH 1.5 between each cycle. The reference subtracted sensorgrams were analyzed using a 1:1 binding model using the BiaEvaluation software. M104.2 standard was kindly provided by the Queensland node of the National Biologics Facility.
Estimation of biomass percentage
For the calculation of the biomass per volume of culture in cm3/mL a spherical cell shape was assumed as per Equationequation 1(1)
(1) . The cell diameter dcell is given in µm and the VCD as 106 cells/mL.
Estimation of specific rates
In fed-batch cultures, the cell-specific productivity (qp) in pg/cell/day for fed-batch cultures was calculated as the slope of the trend line when plotting IVCD on the x and product titer on the y-axis. The IVCD was calculated as per Equationequation 2(2)
(2) , with the VCD the viable cell density at the time point. IVCD−1 and VCD−1 were the IVCD and VCD, respectively, recorded at the previous time point and Δt as the difference between the time point the and the previous time point.
For perfusion cultures, the cell-specific productivity qp was calculated according to EquationEquation 3(3)
(3) . Where ‘D’ is the dilution rate in reactor volumes per day, ‘cp’ the product concentration in µg/mL and ‘x’ the number of cells per mL.
The biomass-specific productivity qp,biomass in mg/cmCitation3/ day was calculated similarly to equation 3 as per Equationequation 4(4)
(4) with biomass in cm3/mL as calculated in equation 1.
Mass spectrometry analysis of N-glycan structures
Protein A purified mAb samples were reduced using 40 mM dithiothreitol and incubated for 60 min at 70°C. Proteins were alkylated using 66 mM of iodoacetamide and incubated at room temperature in the dark for 30 minutes. Proteins then were trypsin digested at 47°C for 1 h before the pH was reduced by formic acid at a final concentration of 0.8%.
Peptides were analyzed using a liquid chromatography-mass spectrometry system. A high-performance liquid chromatography Ultimate 3000 RSLCnano system (ThermoFisher, Germany) was used with 0.1% aqueous formic acid as mobile phases A and 80% acetonitrile in phase A as phase B. 2 µL sample was injected onto a C18 nanoEaseTM M/Z CSH C18 1.8 µm (150 µm x 100 mm) column (Waters, US) and eluted over 60 minutes at a gradient of 8% to 95% mobile phase B with a flow rate of 0.5 µL/min.
Eluted peptides were measured in their mass using an Exploris Mass Spectrometer (ThermoFisher, USA). Data was acquired in DDA mode with a resolution of 60,000 and scan range of 400–1100 m/z for full MS. For MS2, the isolation window was set to 1.6 m/z and the orbitrap resolution to 15,000. Glycans were identified manually using Protein Discoverer v3.0.
Abbreviations
BFP – BCL-2 family protein
CHO – Chinese hamster ovary
DR – Death-resistant
IVCD – Integral viable cell density
mAb – monoclonal antibody
MOMP – Mitochondrial outer membrane permeabilization
Qp – cell-specific productivity
Qp, biomass – biomass-specific productivity
VCD – Viable cell density
Supplemental Material
Download MS Word (461 KB)Acknowledgments
Elements of this research utilized equipment and services provided by the Queensland node of the National Biologics Facility, which is supported by Therapeutic Innovation Australia (TIA). TIA is supported by the Australian Government through the National Collaborative Research Infrastructure Strategy (NCRIS) program.
Disclosure statement
No potential conflict of interest was reported by the author(s).
Supplementary material
Supplemental data for this article can be accessed online at https://doi.org/10.1080/19420862.2022.2083465.
Additional information
Funding
References
- Henry MN, MacDonald MA, Orellana CA, Gray PP, Gillard M, Baker K, Nielsen LK, Marcellin E, Mahler S, Martínez VS, et al. Attenuating apoptosis in Chinese hamster ovary cells for improved biopharmaceutical production. Biotechnol Bioeng. 2020;117(4):1187–13. doi:10.1002/bit.27269.
- Krampe B, Al-Rubeai M. Cell death in mammalian cell culture: molecular mechanisms and cell line engineering strategies. Cytotechnology. 2010;62(3):175–88. doi:10.1007/s10616-010-9274-0.
- Templeton N, Xu S, Roush DJ, Chen H. (13)C metabolic flux analysis identifies limitations to increasing specific productivity in fed-batch and perfusion. Metab Eng. 2017;44:126–33. doi:10.1016/j.ymben.2017.09.010.
- Fassnacht D, Rössing S, Singh RP, Al-Rubeai M, Pörtner R. Influence of bcl-2 on antibody productivity in high cell density perfusion cultures of hybridoma. Cytotechnology. 1999;30(1–3):95–106. doi:10.1023/A:1008055702079.
- Mercille S, Massie B. Apoptosis-resistant E1B-19K-expressing NS/0 myeloma cells exhibit increased viability and chimeric antibody productivity under perfusion culture conditions. Biotechnol Bioeng. 1999;63(5):529–43. doi:10.1002/(SICI)1097-0290(19990605)63:5<529::AID-BIT3>3.0.CO;2-X.
- Nivitchanyong T, Martinez A, Ishaque A, Murphy JE, Konstantinov K, Betenbaugh MJ, Thrift J. Anti-apoptotic genes Aven and E1B-19K enhance performance of BHK cells engineered to express recombinant factor VIII in batch and low perfusion cell culture. Biotechnol Bioeng. 2007;98(4):825–41. doi:10.1002/bit.21479.
- Tey BT, Al-Rubeai M. Suppression of apoptosis in perfusion culture of Myeloma NS0 cells enhances cell growth but reduces antibody productivity. Apoptosis. 2004;9(6):843–52. doi:10.1023/B:APPT.0000045792.63249.5a.
- MacDonald MA, et al. Perfusion culture of Chinese hamster ovary cells for bioprocessing applications. In: Critical reviews in biotechnology. 2021. p. 1–17. Taylor and Francis Online. doi:10.1080/07388551.2021.1998821.
- Gomez N, Barkhordarian H, Lull J, Huh J, GhattyVenkataKrishna P, Zhang X. Perfusion CHO cell culture applied to lower aggregation and increase volumetric productivity for a bispecific recombinant protein. J Biotechnol. 2019;304:70–77. doi:10.1016/j.jbiotec.2019.08.001.
- Gomez N, et al. Improving product quality and productivity of bispecific molecules through the application of continuous perfusion principles. In: Biotechnol Prog. 2020. p. e2973. doi:10.1002/btpr.2973.
- Gagnon M, Nagre S, Wang W, Coffman J, Hiller GW. Novel, linked bioreactor system for continuous production of biologics. Biotechnol Bioeng. 2019;116(8):1946–58. doi:10.1002/bit.26985.
- Gagnon M, Nagre S, Wang W, Hiller GW. Shift to high‐intensity, low‐volume perfusion cell culture enabling a continuous, integrated bioprocess. Biotechnol Prog. 2018;34(6):1472–81. doi:10.1002/btpr.2723.
- Xu S, Chen H. High-density mammalian cell cultures in stirred-tank bioreactor without external pH control. J Biotechnol. 2016;231:149–59. doi:10.1016/j.jbiotec.2016.06.019.
- Xu S, Gavin J, Jiang R, Chen H. Bioreactor productivity and media cost comparison for different intensified cell culture processes. Biotechnol Prog. 2017;33(4):867–78. doi:10.1002/btpr.2415.
- Xu S, Jiang R, Chen Y, Wang F, Chen H. Impact of Pluronic((R)) F68 on hollow fiber filter-based perfusion culture performance. Bioprocess Biosyst Eng. 2017;40(9):1317–26. doi:10.1007/s00449-017-1790-2.
- Xu J, Rehmann MS, Xu M, Zheng S, Hill C, He Q, Borys MC, Li ZJ. Development of an intensified fed-batch production platform with doubled titers using N-1 perfusion seed for cell culture manufacturing. Bioresour. Bioprocess 2020;7(1):17. doi:10.1186/s40643-020-00304-y.
- Xu J, Xu X, Huang C, Angelo J, Oliveira CL, Xu M, Xu X, Temel D, Ding J, Ghose S, et al. Biomanufacturing evolution from conventional to intensified processes for productivity improvement: a case study. MAbs. 2020;12(1):1770669. doi:10.1080/19420862.2020.1770669.
- Yongky A, Xu J, Tian J, Oliveira C, Zhao J, McFarland K, Borys MC, Li ZJ. Process intensification in fed-batch production bioreactors using non-perfusion seed cultures. MAbs. 2019;11(8):1502–14. doi:10.1080/19420862.2019.1652075.
- Grav LM, Lee JS, Gerling S, Kallehauge TB, Hansen AH, Kol S, Lee GM, Pedersen LE, Kildegaard HF. One-step generation of triple knockout CHO cell lines using CRISPR Cas9 and fluorescent enrichment. Biotechnol J. 2015;10(9):1446–56. p. n/a-n/a. doi:10.1002/biot.201500027.
- Sergeeva D, Lee GM, Nielsen LK, Grav LM. Multicopy targeted integration for accelerated development of high-producing Chinese hamster ovary cells. ACS Synth Biol. 2020;9(9):2546–61. doi:10.1021/acssynbio.0c00322.
- Xu X, Nagarajan H, Lewis NE, Pan S, Cai Z, Liu X, Chen W, Xie M, Wang W, Hammond S, et al. The genomic sequence of the Chinese hamster ovary (CHO)-K1 cell line. Nat Biotechnol. 2011;29(8):735–41. doi:10.1038/nbt.1932.
- Orellana CA, Martínez VS, MacDonald MA, Henry MN, Gillard M, Gray PP, Nielsen LK, Mahler S, Marcellin E. ‘Omics driven discoveries of gene targets for apoptosis attenuation in CHO cells. Biotechnol Bioeng. 2021;118(1):481–90. doi:10.1002/bit.27548.
- Kildegaard HF, Baycin-Hizal D, Lewis NE, Betenbaugh MJ. The emerging CHO systems biology era: harnessing the ‘omics revolution for biotechnology. Curr Opin Biotechnol. 2013;24(6):1102–07. doi:10.1016/j.copbio.2013.02.007.
- Kuo CC, Chiang AW, Shamie I, Samoudi M, Gutierrez JM, Lewis NE. The emerging role of systems biology for engineering protein production in CHO cells. Curr Opin Biotechnol. 2018;51:64–69. doi:10.1016/j.copbio.2017.11.015.
- Lee JS, Grav LM, Lewis NE, Faustrup Kildegaard H. CRISPR/Cas9-mediated genome engineering of CHO cell factories: application and perspectives. Biotechnol J. 2015;10(7):979–94. doi:10.1002/biot.201500082.
- Lin H, Leighty RW, Godfrey S, Wang SB. Principles and approach to developing mammalian cell culture media for high cell density perfusion process leveraging established fed-batch media. Biotechnol Prog. 2017;33(4):891–901. doi:10.1002/btpr.2472.
- Wolf MKF, Closet A, Bzowska M, Bielser J-M, Souquet J, Broly H, Morbidelli M. Improved performance in mammalian cell perfusion cultures by growth inhibition. Biotechnol J. 2019;14(2):e1700722. doi:10.1002/biot.201700722.
- Grilo AL, Mantalaris A. Apoptosis: a mammalian cell bioprocessing perspective. Biotechnol Adv. 2019;37(3):459–75. doi:10.1016/j.biotechadv.2019.02.012.
- Kale J, Osterlund EJ, Andrews DW. BCL-2 family proteins: changing partners in the dance towards death. Cell Death Differ. 2018;25(1):65–80. doi:10.1038/cdd.2017.186.
- Kalkavan H, Green DR. MOMP, cell suicide as a BCL-2 family business. Cell Death Differ. 2018;25(1):46–55. doi:10.1038/cdd.2017.179.
- Pena-Blanco A, Garcia-Saez AJ. Bax, Bak and beyond - mitochondrial performance in apoptosis. FEBS J. 2018;285(3):416–31. doi:10.1111/febs.14186.
- Shamas-Din A, Kale J, Leber B, Andrews DW. Mechanisms of action of Bcl-2 family proteins. Cold Spring Harb Perspect Biol. 2013;5(4):a008714. doi:10.1101/cshperspect.a008714.
- Cost GJ, Freyvert Y, Vafiadis A, Santiago Y, Miller JC, Rebar E, Collingwood TN, Snowden A, Gregory PD. BAK and BAX deletion using zinc-finger nucleases yields apoptosis-resistant CHO cells. Biotechnol Bioeng. 2010;105(2):330–40. doi:10.1002/bit.22541.
- Misaghi S, Qu Y, Snowden A, Chang J, Snedecor B. Resilient immortals, characterizing and utilizing bax/bak deficient Chinese hamster ovary (CHO) cells for high titer antibody production. Biotechnol Prog. 2013;29(3):727–37. doi:10.1002/btpr.1722.
- Xiong K, Marquart KF, Cour Karottki KJ, Li S, Shamie I, Lee JS, Gerling S, Yeo NC, Chavez A, Lee GM, et al. Reduced apoptosis in Chinese hamster ovary cells via optimized CRISPR interference. Biotechnol Bioeng. 2019;116(7):1813–19. doi:10.1002/bit.26969.
- Lim SF, Chuan KH, Liu S, Loh SOH, Chung BYF, Ong CC, Song Z. RNAi suppression of bax and bak enhances viability in fed-batch cultures of CHO cells. Metab Eng. 2006;8(6):509–22. doi:10.1016/j.ymben.2006.05.005.
- Hsu SY, Kaipia A, McGee E, Lomeli M, Hsueh AJW. Bok is a pro-apoptotic Bcl-2 protein with restricted expression in reproductive tissues and heterodimerizes with selective anti-apoptotic Bcl-2 family members. Proc Natl Acad Sci U S A. 1997;94(23):12401–06. doi:10.1073/pnas.94.23.12401.
- Echeverry N, Bachmann D, Ke F, Strasser A, Simon HU, Kaufmann T. Intracellular localization of the BCL-2 family member BOK and functional implications. Cell Death Differ. 2013;20(6):785–99. doi:10.1038/cdd.2013.10.
- Llambi F, Wang Y-M, Victor B, Yang M, Schneider D, Gingras S, Parsons M, Zheng J, Brown S, Pelletier S, et al. BOK is a non-canonical BCL-2 family effector of apoptosis regulated by ER-associated degradation. Cell. 2016;165(2):421–33. doi:10.1016/j.cell.2016.02.026.
- Schulman JJ, Szczesniak LM, Bunker EN, Nelson HA, Roe MW, Wagner LE, Yule DI, Wojcikiewicz RJH. Bok regulates mitochondrial fusion and morphology. Cell Death Differ. 2019;26(12):2682–94. doi:10.1038/s41418-019-0327-4.
- Singh A, Kildegaard HF, Andersen MR. an online compendium of CHO RNA-Seq data allows identification of CHO cell line-specific transcriptomic signatures. Biotechnol J. 2018;13(10):e1800070. doi:10.1002/biot.201800070.
- Cotter TG, al-Rubeai M. Cell death (apoptosis) in cell culture systems. Trends Biotechnol. 1995;13(4):150–55. doi:10.1016/S0167-7799(00)88926-X.
- MacDonald MA, et al. Modeling apoptosis resistance in CHO cells with CRISPR-mediated knockouts of bak1, bax, and bok. 2022;119(6). doi:10.1002/bit.28062.
- Ghaffari N, Jardon MA, Krahn N, Butler M, Kennard M, Turner RFB, Gopaluni B, Piret JM. Effects of cysteine, asparagine, or glutamine limitations in Chinese hamster ovary cell batch and fed-batch cultures. Biotechnol Prog. 2020;36(2):e2946. doi:10.1002/btpr.2946.
- Zhu Z, Lu JJ, Liu S. Protein separation by capillary gel electrophoresis: a review. Anal Chim Acta. 2012;709:21–31. doi:10.1016/j.aca.2011.10.022.
- Romanova N, Niemann T, Greiner JFW, Kaltschmidt B, Kaltschmidt C, Noll T. Hyperosmolality in CHO culture: effects on cellular behavior and morphology. Biotechnol Bioeng. 2021;118(6):2348–59. doi:10.1002/bit.27747.
- Wolf MKF, et al. Improved performance in mammalian cell perfusion cultures by growth inhibition. Biotechnol J. 2018:1700722.
- Downey B, Schmitt J, Beller J, Russell B, Quach A, Hermann E, Lyon D, Breit J. A system identification approach for developing model predictive controllers of antibody quality attributes in cell culture processes. Biotechnol Prog. 2017;33(6):1647–61. doi:10.1002/btpr.2537.
- Walther J, Lu J, Hollenbach M, Yu M, Hwang C, McLarty J, Brower K. Perfusion cell culture decreases process and product heterogeneity in a head-to-head comparison with fed-batch. Biotechnol J. 2019;14(2):e1700733. doi:10.1002/biot.201700733.
- Zhuang C, Zheng C, Chen Y, Huang Z, Wang Y, Fu Q, Zeng C, Wu T, Yang L, Qi N, et al. Different fermentation processes produced variants of an anti-CD52 monoclonal antibody that have divergent in vitro and in vivo characteristics. Appl Microbiol Biotechnol. 2017;101(15):5997–6006. doi:10.1007/s00253-017-8312-7.
- Playford EG, Munro T, Mahler SM, Elliott S, Gerometta M, Hoger KL, Jones ML, Griffin P, Lynch KD, Carroll H, et al. Safety, tolerability, pharmacokinetics, and immunogenicity of a human monoclonal antibody targeting the G glycoprotein of henipaviruses in healthy adults: a first-in-human, randomised, controlled, phase 1 study. Lancet Infect Dis. 2020;20(4):445–54. doi:10.1016/S1473-3099(19)30634-6.
- Zhu Z, Bossart KN, Bishop KA, Crameri G, Dimitrov AS, McEachern JA, Feng Y, Middleton D, Wang L-F, Broder CC, et al. Exceptionally potent cross-reactive neutralization of nipah and hendra viruses by a human monoclonal antibody. J Infect Dis. 2008;197(6):846–53. doi:10.1086/528801.
- Bausch M, Schultheiss C, Sieck JB. Recommendations for comparison of productivity between fed-batch and perfusion processes. Biotechnol J. 2019;14(2):e1700721. doi:10.1002/biot.201700721.