
 ?Mathematical formulae have been encoded as MathML and are displayed in this HTML version using MathJax in order to improve their display. Uncheck the box to turn MathJax off. This feature requires Javascript. Click on a formula to zoom.
ABSTRACT
Monoclonal antibodies targeting the programmed cell death protein 1 (PD-1) remain the most prevalent cancer immunotherapy both as a monotherapy and in combination with additional therapies. Despite the extensive success of anti-PD-1 monoclonal antibodies in the clinic, the experimental relationship between binding affinity and functional potency for anti-PD-1 antibodies in vivo has not been reported. Anti-PD-1 antibodies with higher and lower affinity than nivolumab or pembrolizumab are entering the clinic and show varied preclinical efficacy. Here, we explore the role of broad-ranging affinity variation within a single lineage in a syngeneic immunocompetent mouse model. By developing a panel of murine anti-PD-1 antibodies with varying affinity (ranging from KD = 20 pM – 15 nM), we find that there is a threshold affinity required for maximum efficacy at a given dose in the treatment of the MC38 adenocarcinoma model with anti-PD-1 immunotherapy. Physiologically based pharmacokinetic modeling complements interpretation of the experimental results and highlights the direct relationship between dose, affinity, and PD-1 target saturation in the tumor.
Introduction
Programmed cell death protein 1 (PD-1) is currently the most widely exploited checkpoint blockade target.1 ,Citation2 PD-1 is induced on T cells following activation and inhibits the signals of the T cell receptor and costimulatory molecules such as CD28,Citation3,Citation4 slowing an ongoing effector immune response to prevent immune-mediated damage.Citation1,Citation2 Checkpoint blockade immunotherapy of cancer seeks to prevent these inhibitory signals from slowing the immune response, reinvigorating effector T cell activity, and promoting tumor cell killing.Citation5–7 The U.S. Food and Drug Administration (FDA) first approved checkpoint blockade immunotherapy against PD-1 in the form of monoclonal antibodies in 2014 for the treatment of melanoma.Citation7 Evidence of the success of PD-1 checkpoint blockade immunotherapy can be seen in a number of further FDA approvals for a plethora of tumor types, including non–small-cell lung cancer, renal cell carcinoma, and Hodgkin’s lymphoma.Citation8–10
Despite the rampant success of anti-PD-1 monoclonal antibodies (mAbs) in the clinic, the relationship between binding affinity and functional potency for clinical anti-PD-1 antibodies is unpredictable.Citation11 Two widely used FDA-approved anti-PD-1 antibodies, nivolumab and pembrolizumab, have similar single digit nanomolar equilibrium binding constants (KD).Citation12 Only recently, anti-PD-1 antibodies were developed with picomolar affinity, such as sintilimab, which has a KD of 74 pM as measured by SPR.Citation13 When compared with nivolumab and pembrolizumab in a human tumor xenograft model in immunodeficient NOG mice, sintilimab performed significantly better across a number of metrics including tumor growth delay, CD8 + T cell recruitment to the tumor and an increased IFN-γ response.Citation13 Preclinical testing of candidate drugs, like sintilimab, has limitations although, as a humanized mouse model will not fully recapitulate a functional immune system response to anti-PD-1 checkpoint blockade.Citation14,Citation15 Humanized mouse models require immunocompromised mice to prevent host-vs-xenograft disease and rely on the transfer of active immune cells by PMBC injection.Citation14,Citation15 The immune response is often limited by incomplete reconstitution of important human immune subpopulations, and thus, does not accurately demonstrate therapeutic efficacy.Citation15 Additionally, conclusions about affinity cannot be drawn by comparing antibodies with different epitopes. The ability of an antibody to more fully block target-ligand interactions will likely dominate any effect due to relative affinities.Citation11,Citation16 Here, we explore the role of wide-ranging affinity variation within a single lineage in a syngeneic immunocompetent mouse model.
By developing a panel of murine anti-PD-1 antibodies with varying affinity (ranging from KD = 20 pM – 15 nM), we find that there is a threshold affinity required for maximum efficacy at a given dose in the treatment of the MC38 adenocarcinoma model with anti-PD-1 immunotherapy. Alternatively, we show that for a given affinity, there is a dose threshold required to achieve maximum efficacy. Physiologically based pharmacokinetic modeling complemented these experimental results and highlights the direct relationship between dose, affinity, and target saturation in the tumor.
Results
Engineering anti-PD-1 antibodies with varying affinity to murine PD-1
To determine what role antibody affinity played in the efficacy of anti-PD-1 immunotherapy, we developed a panel of murine anti-PD-1 antibodies of the same lineage with varying affinity. We started with a parental anti-PD-1 clone, 29F.1A12.Citation17 We displayed a single-chain variable fragment (scFv) format of the murine anti-PD-1 clone 29F.1A12 on the surface of yeast using established methods.Citation18,Citation19 We confirmed that the scFv displayed on the surface of yeast bound to a murine PD-1 monoFc fusion protein (Figure S1). Murine PD-1 was solubly expressed as a fusion to an engineered monovalent human IgG1 Fc region to increase HEK cell expression levels and prevent dimer formation.Citation20 The murine PD-1 monoFc fusion protein was also validated by enzyme-linked immunosorbent assay (ELISA) to commercially purchased 29F.1A12 antibody (BioXcell) (Figure S1). We generated a library of yeast displaying 29F.1A12 mutants using established methodsCitation18,Citation19,Citation21 and used equilibrium incubations to sort for lower affinity binders to murine PD-1. We determined that a single mutation (S102P) in the CDR H3 diminished binding to mPD-1 (Figure S2). We proceeded to make a new library from our mutant scFv and isolated additionally lower affinity clones. We determined that the combination of the CDR H3 mutation (S102P) and a CDR L3 mutation (D99N) confer further diminished binding to mPD-1 as compared to our single mutant scFv (Figure S2).
To find higher affinity binders to mPD-1, we generated a library of yeast displaying 29 F.1A12 mutants and used kinetic incubation and sorting strategies. We determined that a mutation in the same position in the CDR H3 (S102T) but with a different residue substitution conferred tighter binding to mPD-1 (Figure S3). After further library generation and sorting, a number of other mutations across the CDR H1 (S25P and T28I) and CDR L2 (L51P, F60L, and S61P) combined with our previous mutation (S102T) to elicit additionally strong binding to mPD-1 (Figure S3).
Affinity characterization of monovalent antibodies
?Although we presumed to have a wide range of affinity antibodies from our affinity maturation of scFvs via yeast surface display, we then characterized the affinity of the full-length antibody constructs. We expressed all our mutant clones as monovalent antibodies, using Fab arm exchange by combining a bivalent antibody with an Fc only construct (, Figure S4).Citation27,Citation28 Murine PD-1 is expressed as a monomer on the cell surface, and thus, we wanted to make monovalent antibodies to yield 1 to 1 interactions between drug and target. This would allow direct comparison between the clones without the interpretation being complicated by 2 to 1 drug-target avid interactions. The mAbs were produced with a murine IgG2c isotype with a kappa light chain with the LALA-PG mutations.Citation22 The LALA-PG mutations ablate Fc effector functions and prevent target cell (T cell, dendritic cell, macrophage, etc.) clearance via the complement-dependent cytotoxicity and antibody-dependent cellular cytotoxicity pathways.Citation22 Note that this is not the standard format available commercially (standard format is rat IgG2a, κ). Additionally, we generated a homology model of the variable heavy and light chains using the ROSIE platform,Citation23–26 which allowed us to confirm that the residue mutations were surface exposed as well as illustrating the expected paratopic location.
Figure 1. Engineered anti-PD-1 monovalent mutants. (a) Mutations across complementary determining regions (CDR) compared to the parental murine anti-PD-1 clone, 29 F.1A12. (b) Bivalent and monovalent antibody formats including LALA-PG mutations to silence Fc effector function.Citation22 (c) Homology model generated using the ROSIE platform.Citation23–26 Colors match the CDR as indicated in panel (a). (d) Fitted association and dissociation curves generated via Octet (FortéBio, Sartorius AG) for the monovalent antibody panel. Figure 1 shows the sequences of the antibody variants, a graphical model of the protein structures, a homology model, and the biolayer interferometry results displaying a range of affinity for mouse PD-1
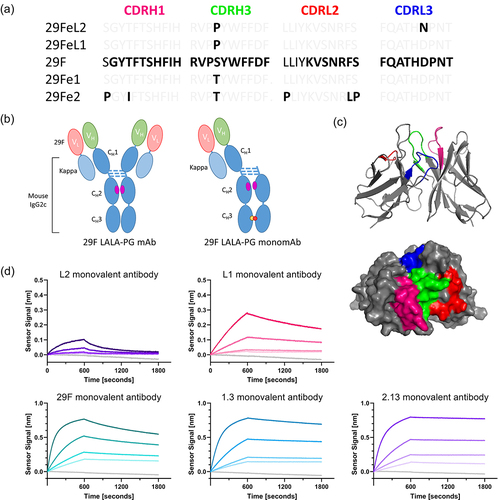
We measured the affinity of the monovalent antibodies to the murine PD-1 monoFc fusion protein by ELISA (Figure S5) and determined the equilibrium binding constant for the parental antibody and the low-affinity clones (). The ELISA was not sufficient to determine the equilibrium binding constant of the high-affinity clones as depleting conditions eliminate any expected positive signal at low subnanomolar concentrations. We measured the dissociation rates of the full panel of monovalent antibodies using a bead-based assay (Figure S5) and saw an expected wide range of values (). Additionally, we performed a modified kinetic exclusion assay to confirm the affinity of the parental 29 F.1A12 monovalent antibody and calculated an equilibrium binding constant of 0.0925 nM (0.0226, 0.1625, 95% confidence interval) (Figure S5). Finally, the association and dissociation rates of the monovalent antibodies were measured using an Octet instrument (FortéBio, Sartorius AG) (). Additionally, we performed a cross-blocking assay to confirm that all the clones maintain binding to the same epitope on murine PD-1 (Figure S6). The affinity-related constants are summarized in . Thus, we confirmed that these clones do indeed bind soluble murine PD-1 when expressed as full-length antibodies and cover a wide range of affinities with equilibrium binding constants spanning from 15 nM to 20 pM.
Table 1. Affinity measurements of monovalent antibody panel (fitted value and standard deviations reported).
Consistent internalization and pharmacokinetic clearance of monovalent antibodies
Despite the range in affinity, the antibodies demonstrate similar rates of PD-1-mediated internalization on CD8 + T cells. Ex vivo activated CD8 T cells isolated from murine splenocytes were incubated with our fluorophore-conjugated antibodies, and internalization was measured via flow cytometry using established methods.Citation29 The internalization rate of the monovalent antibodies aligned closely with the expected half-life of the bivalent antibody of around 30 hours on the cell surface (, Figure S7).Citation30 The faster internalization rate of the lowest affinity antibody may be a result of the lack of saturated surface binding due to its poor affinity. The internalization rate is a function of the exposure to surface-bound antibodies over time. With the lowest affinity antibody, a lack of full surface binding at the time of measurement may underestimate the exposure to surface-bound antibodies. Thus, the ratio between the internalized signal and the signal of surface-bound antibodies over time may be overestimated, leading to an elevated internalization rate.
Figure 2. Internalization and clearance of antibodies. (a) Log rate of internalization of the full panel of monovalent antibodies as well as the bivalent parental antibody. (b) Log half-life of internalization of the full panel of monovalent antibodies and the bivalent parental antibody. (c) Biexponential decay curve fit of clearance rate of the full panel of monovalent antibodies and the parental bivalent antibody. shows the internalization rates, internalization half lives, and pharmacokinetic clearance rates of the full panel of monovalent antibodies and the bivalent parental antibody.
Next, we sought to understand the pharmacokinetic clearance rate of our antibodies. Clearance rates were determined by measuring the concentration of the fluorophore-conjugated antibodies in the blood of tumor-bearing C57CL/6 mice over time (). All the antibodies in our panel demonstrate similar rates of clearance both in a first rapid phase of tissue distribution and then a slow phase of excretion. Similar clearance rates were measured in non-tumor-bearing C57CL/6 mice (Supplemental Figure 8). As expected, for a low concentration target such as PD-1, pharmacokinetic curves do not show evidence of target-mediated drug disposition when comparing clearance rates in tumor-bearing and non-tumor bearing mice ( and Figure S8). Thus, stoichiometric depletion is not expected to play a significant role in drug trafficking. The data show a somewhat slower clearance rate of the low-affinity antibodies, which may result from protein diffusion back from the tissue, as they do not bind as tightly to the target. While we expected a difference between the monovalent and bivalent constructs resulting from the differences in protein size,Citation31 the data do not demonstrate any significant differences. These data demonstrated the consistent internalization and pharmacokinetic clearance rates of all our antibody constructs.
Physiologically based pharmacokinetic model predicts duration of target saturation
To understand and predict how a treatment’s pharmacokinetic properties impact therapeutic efficacy, we built the kinetic and transport dynamics that occur following an intraperitoneal injection of our antibody into a computational model (Supplemental Tables 1–3). Following an intraperitoneal injection, the antibody diffuses into the blood and into the tissue. From the blood, the drug can diffuse back into the tissue or be cleared entirely from the body at a given rate (kclear). Since high interstitial pressures within tumors prevent the formation of fluid pressure gradients across vessel walls into the interstitium, we model drug transport via diffusion rather than convection.Citation32 Protein diffusion is defined by a capillary permeability validated by Schmidt et al.Citation33 In the tumor microenvironment, the drug can interact with its target on activated immune cells. Protein-binding interactions are driven by association (kon) and dissociation (koff) rate constants and the concentration of the drug and its receptor. The target receptor, both free and bound by drug, can be internalized from the cell surface at a given rate (kint). Increasing concentrations of target receptor due to new molecule synthesis, cell proliferation, and cell surface receptor recycling can be estimated by a logistic growth function dictated by a growth rate (ksyn/growth) and population capacity (PD1Steady-State). These rates were determined experimentally as described above or derived from established models in the literature.Citation30,Citation32,Citation33 We define these kinetic, transport, and cellular dynamics using a system of ordinary differential equations (ODEs) (Supplementary Tables 1–3). Solving the ODEs allows us to predict the expected concentration of drug in the plasma, the total drug in the tumor, and the amount of free and bound target receptors in the tumor over time ().
Figure 3. Physiological-based pharmacokinetic model of anti-PD-1 immunotherapy. (a) Simplified diagram of a two-compartment model with relevant parameters. (b) Concentration of drug in the plasma over time for a 100-µg dose given every three days. (c) Concentration of free receptor in the tumor. (d) Concentration of free drug in the tumor. (e) Concentration of receptor bound by drug in the tumor. shows a graphical depiction of the pharmacokinetic model and the resulting curves produced by the model. The curves include the drug concentration in the blood, the free drug concentration in the tumor, the free receptor concentration in the tumor, and the concentration of drug bound to the receptor in the tumor.
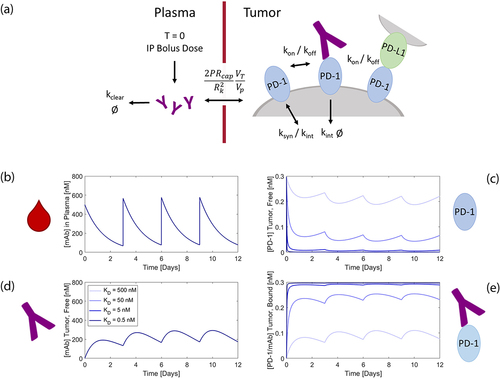
Due to low receptor expression and low T cell abundance, most of the drug is cleared from the body without any receptor interaction. Thus, the clearance rate of the drug, kclear, significantly impacts the timescale of full receptor saturation by the drug. Fortunately, we have shown above that the clearance rate is fairly consistent across our panel of monovalent antibodies (). By varying the experimentally determined parameters, we demonstrate that our model is most sensitive to the overall clearance rate of the antibodies as compared with the association rate and internalization rate (Figure S9). The slow internalization rate and low antigen concentration allow the antibodies to fully saturate the target until there is insufficient drug trafficking from the blood due to clearance. Thus, the model predicts that drug dose, which dictates the bolus concentration of drug in the blood, and the affinity (dissociation rate, in particular) will most significantly influence the saturation of our target receptor in the tumor over time.
Threshold of affinity required to attain maximum efficacy in MC38 adenocarcinoma model
Using our panel of varying affinity monovalent antibodies to murine PD-1, we sought to understand the relationship between antibody-receptor affinity and in vivo efficacy. We treated mice bearing established subcutaneous flank MC38 tumors intraperitoneally with our monovalent antibodies at a high dose of 135 µg (a molar equivalent to the commonly used 200 µg doseCitation34–36 of the commercially available bivalent 29 F.1A12 clone) three times starting six days after tumor inoculation (). Under this dosing paradigm, the lower affinity antibodies show worse efficacy in terms of overall survival compared to the parental antibody (). On the other hand, the higher affinity antibodies show equivalent efficacy as compared to the parental antibody (). The model demonstrates that both the high-affinity and parental antibodies fully saturate the PD-1 in the tumor for over a week with this high dose, even with a single dose (). This is in stark contrast to the two lower affinity antibodies, which would never fully saturate the PD-1 in the tumor, thus yielding low efficacy (). Even at this high dose, a subnanomolar affinity is required to achieve maximum efficacy.
Figure 4. In vivo efficacy in MC38 adenocarcinoma model. (a) Dosing paradigm. (b) Model timescale prediction of PD-1 saturation in the tumor above a 99% threshold for an antibody of a given affinity for this 135 ug dose. (c) Overall survival in vivo for the full panel of monovalent antibodies using this dosing paradigm. (d) Adjusted dosing paradigm. (e) Model timescale prediction of PD-1 saturation in the tumor above a 99% threshold for an antibody of a given affinity for these adjusted doses. (f) Overall survival in vivo for the parental 29 F and L1 lower affinity monovalent antibodies using the adjusted dosing paradigm. shows two dosing schemes for the antibodies used to treat the MC38 adenocarcinoma model in C57BL/6 mice. The results from the model at these doses display the time of expected receptor occupancy for a range of antibody affinities. The survival results from the in vivo studies are shown.
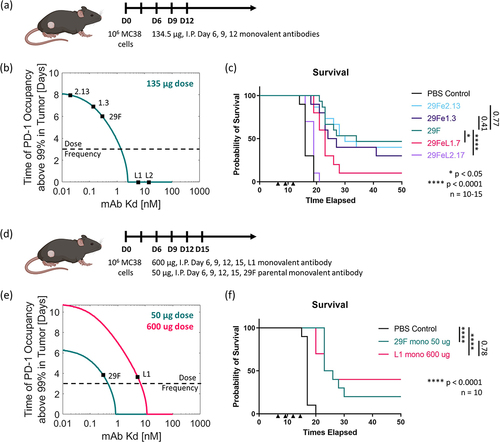
We then looked to adjust the dose of one of the lower affinity antibodies, such that this antibody’s low affinity would still surpass the threshold required to obtain maximum efficacy via saturating PD-1 (). The model predicted that if we increased the dose of the low-affinity antibody to 600 µg, we would expect full PD-1 saturation in the tumor for 3–4 days (). The model also demonstrated that we should expect 50 µg of the parental antibody to show similar PD-1 saturation levels (). The resulting in vivo study demonstrated that for a 600-µg dose, the low-affinity (~1-2 nM) antibody was above the threshold of affinity required to attain the maximum efficacy seen in the previous study and surpassed the efficacy achieved by the parental antibody at a similar predicted level of target saturation in the tumor (). This result demonstrates that anti-PD-1 efficacy follows an expected receptor occupancy model, where treatment dose can be tuned according to the drug’s affinity.
Limited differences in efficacy between high-affinity clones
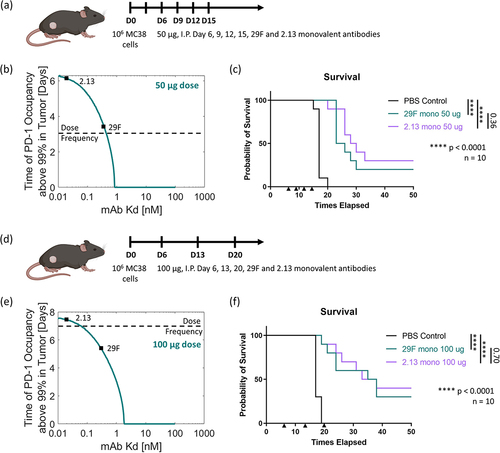
We next looked to assess whether we would expect any difference in efficacy between our high-affinity clones for various dosing strategies. At a large 135 ug dose, all the high-affinity antibodies (29 F, 1.3 and 2.13) perform similarly. Thus, we recognized that there were two additional dosing strategies to pursue: (1) decreasing the dose, such that only the highest affinity antibody would fully saturate the PD-1 in the tumor between doses, and (2) increasing the time between the doses, such that only the highest affinity antibody would fully saturate the PD-1 in the tumor between these extended doses. First, we treated mice bearing established subcutaneous flank MC38 tumors intraperitoneally with our monovalent antibodies at a lower dose of 50 µg every three days for four doses starting six days after tumor inoculation (). The model predicted that at this dose, the highest affinity antibody (2.13) would saturate the PD-1 in the tumor for more than four days, while the parental clone would saturate the tumor for just three days (). Under this dosing paradigm, the highest affinity antibody (2.13) performed similarly to the parental antibody (29 F) (). We then tried decreasing the dose further to 10 μg every three days continuously (Supplemental Figure 10). In this dosing paradigm, both antibody treatments resulted in a statistically similar decrease in efficacy. Next, we tried increasing the time between the doses. We treated mice bearing established subcutaneous flank MC38 tumors intraperitoneally with our monovalent antibodies at a dose of 100 µg every seven days for three doses starting six days after tumor inoculation (). The model predicted that at this dose, the highest affinity antibody (2.13) would saturate the PD-1 in the tumor for seven days, while the parental clone would saturate the tumor for five days (). Under this dosing paradigm, the highest affinity antibody (2.13) performed similar to the parental antibody (29 F) (). This is likely evidence of the diminishing returns in increasing the off-rate of the antibody at this high affinity level. We simply cannot dose any lower or less often without seeing undersaturation of the PD-1 in the tumor. This limit is likely due to the increasing PD-1 concentration in the tumor over time as more activated T cells enter the tumor. Thus, we expect that the parental 29 F antibody sits right at the affinity threshold where any further improvements in affinity will not lead to increased efficacy.
Figure 5. In vivo efficacy in MC38 adenocarcinoma model. (a) Dosing paradigm. (b) Model timescale prediction of PD-1 saturation in the tumor above a 99% threshold for an antibody of a given affinity for a 50 ug dose. (c) Overall survival in vivo comparing the parental 29 F and higher affinity 2.13 monovalent antibodies using this dosing paradigm. (d) Adjusted dosing paradigm. (e) Model timescale prediction of PD-1 saturation in the tumor above a 99% threshold for an antibody of a given affinity for a 100 ug dose. (f) Overall survival in vivo comparing the parental 29 F and 2.13 higher affinity monovalent antibodies using the adjusted dosing paradigm. shows two adjusted dosing schemes for the antibodies used to treat the MC38 adenocarcinoma model in C57BL/6 mice. The results from the model at these doses display the time of expected receptor occupancy for a range of antibody affinities. The survival results from the in vivo studies are shown.
Discussion
With the availability of directed evolution to obtain arbitrarily high-affinity antibodies, the question becomes how strong is strong enough? Here, we report a comparison of in vivo efficacy for a single-lineage family of anti-PD-1 antibodies with a three order of magnitude range of equilibrium binding constants. This family of antibodies share the same epitope and have similar internalization and clearance rates, thus differing only by affinity (). We found that for a given dose, there is a threshold of affinity below which all antibodies perform similarly with maximum efficacy (). Additionally, we demonstrated that an increasing dose can be used to overcome weakened affinity and rescue maximum efficacy (). This demonstrates that anti-PD-1 efficacy follows an expected receptor occupancy model, where treatment can be tuned by the dose-affinity relationship. Additionally, the results show that increasing the affinity of an antibody may not lead to increased efficacy and serves as an example of potential diminishing returns on affinity maturation efforts. Yet here, we did not explore whether increasing the affinity to decrease the dose can reduce toxicities. Anti-PD-1 immunotherapy typically leads to fewer severe immune-related adverse events (irAEs), as compared to other immunotherapies, such as anti-CTLA-4 antibodies.Citation37 Yet still, approximately 10% of patients receiving anti-PD-1 antibodies experience severe grade ≥3 irAEs.Citation37 While signs of toxicity are not evident in this particular murine tumor model, further work toward evaluating a limiting dose with regard to toxicity could provide a more clear boundary to surpass in terms of antibody affinity.
Using a simple two-compartment model, we recapitulate the most important parameters driving in vivo efficacy without overcomplicating our system. The model demonstrates the clear relationship between dose, affinity, and pharmacokinetics, which results in varying time scales of target saturation in the tumor. This model recapitulates similar dynamics to previous efforts,Citation30,Citation38 with simple rate-based terms in the tumor and peripheral blood, yet effectively captures the required drug-target occupancy to drive tumor growth inhibition. The maintained efficacy of our high-affinity clones demonstrates that anti-PD-1 antibodies do not demonstrate a binding-site barrier paradigm that limits tumor penetration and efficacy of high-affinity antibodies. This paradigm is most pronounced for antibodies targeting tumor antigens (e.g. carcinoembryonic antigen) or antigens expressed on host, tumor, and immune cells (e.g. PD-L1).Citation35,Citation39,Citation40 In the case of highly concentrated antigens such as PD-L1, poor pharmacokinetics due to healthy tissue binding can cause poor efficacy before tumor penetration even plays a role.Citation35 In our case with a low antigen concentration limited to infiltrating immune cells, the Thiele modulus, which dictates the relationship between binding and tumor penetration, scales with the surface concentration of antibody reaching the tumor periphery.Citation39 Thus, with a sufficient surface concentration, our model predicts full tumor saturation and spatial heterogeneity within the tumor, which can be ignored. Despite variability in immune infiltration and tumor microenvironment in human patients, similar models to the one developed here have been extrapolated to human systems and results show a similar receptor-occupancy-driven dose response in human patients.Citation30 While drug dose and saturation kinetics have been evaluated, further work to establish the proper affinity threshold is required in human models.
T cell activation, antigen recognition, and tumor cell killing are complex processes with temporal dynamics that are not fully recapitulated in this model. T cell activation requires a sustained synapse between an antigen-presenting cell and a naïve T cell in the lymph node or secondary lymph node organ.Citation41 Efficient PD-1 blockade by an antibody will prevent dephosphorylation of proximal signaling receptors, such as CD28.Citation5 This leads to sufficient secondary signaling from these coreceptors, effectively lowering the threshold for T cell activation.Citation42,Citation43 Proliferating T cells that traffic to the tumor need saturating concentrations of drug to ensure sufficient and sustained PD-1 blockade to allow for tumor cell recognition and killing.Citation5 Thus, we need both tumor and lymph node-saturating concentrations of drug and efficient blockade of receptors in the immunological synapse. Future work toward understanding lymph node saturation, temporal dynamics, and peripheral cell trafficking patterns could further enhance our understanding of this therapy.
While we do not expect that a monovalent construct would exhibit therapeutic advantages, we did find that monovalent antibodies performed similar to their bivalent counterparts and outperformed bivalent antibodies with the mIgG1 and rat IgG2a isotypes (Supplemental Figure 11). Similar superior performance of anti-PD-1 antibodies with a LALA-PG or other silent Fc isotypes over antibodies with activating isotypes has been previously reported.Citation36,Citation44,Citation45 The success of the monovalent constructs, combined with the silent Fc isotype, parallels the promise of several anti-PD-1 bispecific constructs in the clinic.Citation46–48 That being said, the advantage of avidity in the bivalent format should not be understated. PD-1 clusters at the immune synapse and inhibits T cell function through co-localization with CD28 in both human and mouse cells.Citation49–52 Thus, the bivalent antibody’s ability to bind multiple PD-1 on the surface should not only increase retention (through an improved off rate) but also improve inhibition of ligand interaction. Additionally, bivalent antibodies could potentially lead to T cell cross-linking and aggregation with other T cells or PD-1-expressing immune cells, possibly yielding stronger immune stimulation through cytokine cross-talk.Citation53 In the end, the anti-PD-1 affinity/dose relationship supports a straightforward receptor occupancy mechanism of action.
Materials and methods
Cloning
A DNA sequence encoding the ectodomain of murine PD-1 was purchased as a GeneBlock (IDT). This fragment was cloned with Q5 DNA polymerase (NEB) and NEBuilder® HiFi DNA Assembly (NEB) using customized primers (IDT) into the modified gWIZ vector (Genlantis) for expression as a mono Fc protein fusion.
A DNA sequence encoding the variable light and heavy fragments of the anti-PD-1 clone 29 F.1A12 were purchased as a GeneBlock (IDT) and cloned using the same reagents as above in the pCTCON2 vector (AddGene Plasmid #41843). This vector and vectors with desired mutations were then used to clone the full-length antibody into the gWiz vector (Genlantis) for protein expression.
Plasmid DNA encoding each protein was transformed and amplified in Stellar Competent Cells (Takara Bio Inc.) and subsequently purified using the NucleoBond Xtra Midi EF endotoxin-free midi-prep kit (Takara Bio Inc.).
Protein production and purification
Proteins were produced in-house using suspension HEK293-F (Life Technologies, R79007), which were cultured in Freestyle medium (Life Technologies). HEK293 cells were transfected with sterile-filtered plasmid DNA using polyethylenimine in OptiPro serum-free medium (Thermo Fisher). The murine PD-1 ectodomain monoFc protein fusion and monovalent antibodies were HIS-tagged and purified by gravity column using TALON resin (Takara Bio Inc.). All bivalent antibodies were purified by gravity column using rProtein A Sepharose Fast Flow resin (GE Healthcare). All proteins were characterized by Coomassie-stained SDS NuPAGE Bis-Tris protein gels (Thermo Fisher Scientific). Proteins were further purified by size exclusion chromatography, if aggregation was detected on the protein gel, using a HiLoad 16/600 Superdex 200 pg column (Millipore Sigma) on an ÄKTA FPLC system (GE Healthcare). After purification, all proteins were buffer exchanged into sterile phosphate-buffered saline (PBS) (Corning), 0.2 μm sterile-filtered (Pall Corporation), and confirmed to contain minimal endotoxin (<0.1 EU per injection) using a chromogenic LAL assay (Lonza). All proteins were flash-frozen by liquid nitrogen, stored at −80°C and thawed on ice before use.
Yeast surface display and affinity maturation
The antibody clone 29 F.1A12 was expressed on the surface of yeast in the scFv format as a fusion protein to Aga2p. Aga2p is natively expressed in S. cerevisiae and binds to Aga1p on the surface of the yeast cells. Yeast surface display takes advantage of this protein relationship.Citation18,Citation19 The vector pCTCON2 (Addgene) contains the scFv fragment flanked by c-myc and hemagglutinin epitope tags as well as the Aga2p protein. When EBY100 yeast is transformed with the relevant pCTCON2 plasmid and induced, expression of the scFv on the yeast surface can be detected by labeling the flanking tags as visualized via flow cytometry.Citation18,Citation19
Libraries were then constructed for affinity maturation. Libraries were constructed according to published protocols.Citation19,Citation21 Varying cycles (10–20) of error prone PCR were used to introduce mutations into the scFv in the pCTCON2 plasmid. Following DNA replication and backbone digestion, the libraries were transformed via electroporation into EBY100 yeast, a strain capable of homologous recombination. Affinity maturation, a cyclic process of DNA mutagenization, incubation of displaying yeast with target antigen, and fluorescence-activated cell sorting (FACS), was used to acquire higher and lower affinity binders to murine PD-1. For all yeast experiments, yeast was grown in SD-CAA medium (containing 20 g/L D-glucose, 6.7 g/L yeast nitrogen base, 5 g/L casamino acids, 7.4 g/L citric acid monohydrate, 10.4 g/L sodium citrate, pH 4.5) to an optical density at 600 nm (OD600) of 2–5 at 30°C. Yeast surface expression of the mutagenized scFv library was induced in SG-CAA medium (containing 18 g/L galactose, 2 g/L D-glucose, 6.7 g/L yeast nitrogen base, 5 g/L casamino acids, 5.4 g/L Na2HPO4, 8.6 g/L NaH2PO4− monohydrate, pH 6.0) overnight at 20°C for cultures with a starting OD600 of 1. All subsequent staining of yeast was performed in PBSA (PBS (Corning) with 1 mg/mL bovine serum albumin (BSA)). Equilibrium incubation and sorts were performed to find lower affinity binders. Equilibrium sorts consist of incubating displaying yeast with saturating concentrations of antigen (mPD-1 Fc) and sorting via FACS to collect low-binding signal clones. Kinetic sorts were used to find higher affinity binders. Kinetic sorts consist of incubating yeast with a saturating concentration of antigen and then incubating over a number of hours to days in higher concentration of non-labeled antigen. The non-labeled antigen acts as a sink to prevent dissociated labeled antigen from re-binding to weaker scFv binders. FACS is then used to sort yeast populations that still maintain antigen binding after the lengthy incubation. Kinetic sorts were performed over a range of times (24–96 hours) and a range of temperatures (25–37°C). After each sort, DNA was extracted from the sorted yeast population using a Zymoprep Yeast Plasmid Miniprep kit (Zymo Research), re-transformed into E. coli Stellar Cells (Takara Bio), mini-prepped again, and sent for Sanger sequencing (Quintara Biosciences).
Murine PD-1 ELISA
Ninety-six-well plates were coated with soluble murine PD-1 monoFc fusion protein overnight at 4°C. The coated plates were then blocked at room temperature for at least 2 hours with PBS (Corning) with 10 mg/mL BSA (Thermo Fisher Scientific) and 0.05% vol/vol Tween-20 (Millipore Sigma). The plates were then incubated overnight at 37°C with various concentrations of antibodies in PBSTA (PBS (Corning) with 1 mg/mL BSA (Thermo Fisher Scientific) and 0.05% vol/vol Tween-20 (Millipore Sigma)). Wells were washed with PBSTA four times and then incubated with horseradish peroxidase-conjugated streptavidin (Thermo Fisher Scientific) at a 1:3000 dilution in PBSTA for 1 hour at 37°C. Wells were washed again four times with PBSTA, and then 1-Step Ultra TMB-ELISA Substrate Solution (Thermo Fisher Scientific) was added for 5–10 min followed by 1 M sulfuric acid to stop the chromogenic reaction. Absorbance at 450 nm (corrected with a reference absorbance at 570 nm) was measured on an Infinite M200 microplate reader (Tecan).
Bio-layer interferometry
An Octet RED96e instrument (FortéBio, Sartorius AG) was used to perform binding experiments of the antibodies to soluble murine PD-1 monoFc fusion protein. The murine PD-1 fusion protein was biotinylated using EZ-Link sulfo-NHS-LC-Biotin (Thermo Fisher Scientific) according to the manufacturer’s instructions. Briefly, the biotin-conjugate was added to protein in 0.1 M sodium phosphate buffer at a ratio of 1:5 molar excess. The reaction proceeded at room temperature with continuous rocking and was stopped with 10x tris-buffered saline after 30 minutes. Any remaining unbound biotin was removed by Amicon® Ultra-15 centrifugal filters (Millipore Sigma) or Zeba Spin Desalting Columns (Thermo Fisher Scientific), and the protein was buffer exchanged to PBS (Corning). The biotinylated protein was then loaded onto SA sensors at 2 μg/mL for 60 seconds. These sensors were then first dipped into PBS (Corning) for 60 s to establish a baseline and then exposed to each antibody solution (varying concentrations) for 600 seconds to measure association. The sensors were then returned to PBS (Corning) for 1800 seconds for dissociation. Curve fitting to calculate apparent KD was performed using the Octet System Data Analysis software (FortéBio, Sartorius AG).
Off-rate bead assay
Soluble murine PD-1 monoFc fusion protein was labeled with Alexa Fluor 488 NHS Ester (Thermo Fisher Scientific) according to the manufacturer’s instructions. Briefly, the dye-conjugate was added to proteins in 0.1 M sodium phosphate buffer at a ratio of 1:5 molar excess. The reaction proceeded at room temperature with continuous rocking and was stopped with 10x tris-buffered saline after 30 minutes. Any remaining free dye was removed by Amicon® Ultra-15 centrifugal filters (Millipore Sigma) or Zeba Spin Desalting Columns (Thermo Fisher Scientific), and the protein was buffer exchanged to PBS.
Magnetic streptavidin Dynabeads (Thermo Fisher Scientific) were labeled with biotinylated monovalent antibodies. Briefly, 5 μL of beads per sample well were washed per manufacturer’s instructions. Beads were then resuspended with 20 pmol of protein per 5 μL of beads and incubated with continuous rocking at room temperature for 1–2 hours. Beads were then washed and resuspended in blocking buffer (PBS (Corning) with 0.05% v/v Tween-20 (Millipore Sigma) and 10 mg/mL BSA (Thermo Fisher Scientific)). The beads were then incubated with continuous rocking at room temperature in blocking buffer for 1 hour. The beads were then washed with PBS three times and then stored for up to a week at 4°C.
Samples were prepared with 10 μL of labeled beads in 0.3–0.5 mL of running buffer (PBS (Corning) with 0.01% v/v Tween-20 (Millipore Sigma)) with at least a 10 nM concentration of Alexa Fluor 488-labeled murine PD-1 monoFc fusion protein. Samples were incubated with continuous rocking at room temperature for 20–60 minutes. The beads were then washed three times and resuspended with a concentration of 10x excess unlabeled murine PD-1 monoFc fusion protein in 1 mL of running buffer. The samples were then incubated at 37°C until the various time points were reached. At each time point, a small volume of sample was removed (~50 μL) and washed three times. The sample was then resuspended in PBS (Corning) with 1 mg/mL BSA (Thermo Scientific Fisher) for flow cytometry. Controls were prepared to calculate the background signal (no Alexa Fluor 488-labeled antigen exposure) and 100% signal (time zero sample). Median fluorescence intensity in the Alexa Fluor 488 channel was determined using FlowJo_v10.7.2 (FlowJo, LLC). MATLAB (R2019b, Mathworks) was used to plot and derive an apparent koff rate using a single exponential decay equation.
Modified kinetic exclusion assay
This method was modified from previous works.Citation54,Citation55 Magnetic streptavidin Dynabeads (Thermo Fisher Scientific) were labeled with biotinylated soluble murine PD-1 mono Fc fusion protein as described above. Samples were prepared with a fixed 1 nM concentration of monovalent antibody and a varying concentration of mPD-1 fusion protein (1 pM to 10 nM) in separate tubes**.Citation56–63 The samples were then incubated at 37°C until equilibrium was reached (at least 72 hours). After incubation, the samples were briefly exposed (less than 5 seconds per sample) to the prepared beads to capture any unbound antibody and washed three times. The beads were then resuspended in detection buffer (blocking buffer with 1:1000 polyclonal goat anti-mouse AF647 secondary antibody (Thermo Fisher Scientific)) and incubated at 4°C for 15–20 minutes. The samples were then washed three times again, resuspended in PBSA (PBS (Corning) with 1 mg/mL BSA (Thermo Fisher Scientific)), and run on the flow cytometer. Median fluorescence intensity in the Alexa Fluor 647 channel was determined using FlowJo_v10.7.2 (FlowJo, LLC). MATLAB (R2019b, Mathworks) was used to plot and derive apparent Kd as shown in the following equation:
where [FL] (active fixed ligand concentration), Sig100, Sig0, and kD are solved for using the fitted data from the flow cytometry signal (Y) and the varied ligand concentration (X).
Cross-blocking assay Internalization assay on ex-vivo cultured CD8+ T cells
Ninety-six-well plates were coated with soluble murine PD-1 monoFc fusion protein overnight at 4°C. The coated plates were then blocked at room temperature for at least 2 hours with PBS (Corning) with 10 mg/mL BSA (Thermo Fisher Scientific) and 0.05% vol/vol Tween-20 (Millipore Sigma) (PBSTA). The plates were then incubated for 15 minutes at 4°C with the unlabeled blocking antibody in half of the wells, and the unblocked wells were incubated with PBSTA. The wells were washed four times with PBSTA. The plates were then incubated for 15 minutes at 4°C with the biotinylated antibody. Wells were washed with PBSTA four times and then incubated with horseradish peroxidase-conjugated streptavidin (Thermo Fisher Scientific) at a 1:6000 dilution in PBSTA for 20 minutes at 4°C. Wells were washed again four times with PBSTA, and then 1-Step Ultra TMB-ELISA Substrate Solution (Thermo Fisher Scientific) was added for 5–10 min followed by 1 M sulfuric acid to stop the chromogenic reaction. Absorbance at 450 nm (corrected with a reference absorbance at 570 nm) was measured on an Infinite M200 microplate reader (Tecan).
Internalization assay on ex-vivo cultured CD8+ T cells
Proteins were labeled with Alexa Fluor 488 NHS Ester (Thermo Fisher Scientific) according to the manufacturer’s instructions and as described above. Splenocytes were harvested from the spleen of a healthy C57BL/6 female mouse. The EasySep™ Mouse CD8 + T Cell Isolation Kit (Stemcell Technologies) was used to isolate CD8 + T cells. The T cells were then plated and activated with anti-CD3 (0.5 μg/mL) and anti-CD28 (5 μg/mL) for 48 hours followed by another 48-hour proliferation in media without antibodies. The T cells were cultured in RPMI (ATCC) supplemented with 10% fetal bovine serum (FBS) (Thermo Fisher Scientific), 1% penicillin–streptomycin (Thermo Fisher Scientific), 1x Gibco® MEM Non-Essential Amino Acids (Thermo Fisher Scientific), 1x sodium pyruvate 100 mM (Thermo Fisher Scientific), 1x 2-mercaptoethanol (Thermo Fisher Scientific), and 10 ng/mL mouse IL-2 (protein made in-house) for culture medium.
Internalization was then measured using established protocols.Citation29 The cultured and activated CD8+ T cells were seeded at 100,000 cells per well, and the Alexa Fluor 488-labeled antibodies were spiked in 10 μg/mL at each relevant time point. At the final time point, antibodies were spiked in to coat the surface protein and then excess antibody was washed away. The samples were then split into two. An Alexa Fluor 488 polyclonal quenching antibody (Thermo Fisher Scientific) was then added at 25 μg/mL to half of the wells to quench the surface-bound antibodies, and thus, the only remaining fluorescence in these samples was internal. All the samples were stained with 4′,6-diamidino-2-phenylindole (Thermo Fisher Scientific) and run on the flow cytometer. Median fluorescence intensity (gated on live cells) in the Alexa Fluor 488 channel was determined using FlowJo_v10.7.2 (FlowJo, LLC) to calculate total, internal, and surface fluorescence. Plots comparing the internal fluorescence and the integral of surface fluorescence over time were used to calculate the internalization rate (Figure S7).
Animal models and cell lines
All animal work complies with regulations established by the Massachusetts Institute of Technology Committee of Animal Care and Division of Comparative Medicine under a protocol approved by the Institutional Animal Care and Use Committee in accordance with federal, state, and local guidelines. Female B6 mice (C57BL/6NTac) between 6 and 8 weeks of age were purchased from Taconic.
MC38 cells (Kerafast, ENH204-FP) were cultured in Dulbecco’s modified Eagle’s medium (ATCC) supplemented with 10% FBS (Thermo Fisher Scientific). All cells were maintained at 37°C and 5% CO2 and tested negative for mycoplasma.
In vivo tumor survival studies and treatment
For inoculation of MC38 tumors, 106 cells resuspended in 50 μL of sterile PBS were injected subcutaneously into the right flanks of C57BL/6 female mice. For all tumor studies, treatment began 6 days after inoculation. Treatments were administered every 3, 6, or 7 days depending on the study design, as indicated. Anti-PD-1 treatment was administered at the indicated dose intraperitoneally in 50–100 μL of sterile PBS. Mice were sorted for equal tumor size distribution between the treatment groups immediately before the first treatment. Tumor size was measured as an area (longest dimension × perpendicular dimension) three times weekly, and mice were euthanized when tumor area exceeded 100 mm2. Mice that rejected tumors were re-challenged alongside age-matched naive C57CL/6 female mice with 105 MC38 tumor cells on the left flank at 14–19 weeks (98–133 days) after the first tumor inoculation and tumor growth was monitored. All analyses were performed in Prism 9 (GraphPad Software, Inc.), and statistical significance was calculated using a log-rank (Mantel-Cox) test.
Pharmacokinetic studies of drug in vivo
Proteins were labeled with Alexa Fluor 647 NHS Ester (Thermo Fisher Scientific) according to the manufacturer’s instructions and as described above. Proteins were injected intravenously by retro-orbital injection once at the indicated dose into C57BL/6 female mice 6 days after inoculation with 106 MC38 cells. At each time point, a few microliters of blood was collected in capillary tubes from the tail. The blood was allowed to settle for 48 hours after the final time point, which allowed for blood clotting and serum separation. The capillary tubes were then imaged using a LI-COR Odyssey instrument (LI-COR, Inc.). Grayscale images from the 700 and 800 nm channels were quantified in ImageJ (National Institutes of Health) and fit with exponential decay models in Prism 9 (GraphPad Software, Inc.).
Pharmacokinetic model
Details of the mathematical pharmacokinetic model can be found in the Supplementary Tables 1–3. Parameters for the pharmacokinetic model were experiementally-determined or found in literature.Citation56–63 The ordinary differential equations were solved with a stiff solver (ode15s) in MATLAB (R2019b, Mathworks).
Author contributions
S.C.C and K.D.W. conceived the study and wrote the manuscript. S.C.C. designed and performed the experiments and analyzed data. GJF aided in editing the manuscript. A.S., L.S., E.A.L., B.M.L., and J.R.P, aided in performing the experiments, analyzing data, and editing the manuscript.
Supplemental Material
Download Zip (10.6 MB)Acknowledgments
We thank the Koch Institute’s Robert A. Swanson (1969) Biotechnology Center, particularly the Animal Imaging and Preclinical Testing Core, High-Throughput Sciences Core, and Flow Cytometry Core Facilities for technical support. was created with The PyMOL Molecular Graphics System, Version 2.4.1 Schrödinger, LLC. were created with BioRender.com. Finally, we want to thank all past and present members of Wittrup laboratories for productive discussions and feedback regarding experiments and the manuscript.
Disclosure statement
GJF has patents/pending royalties on the PD-1/PD-L1 pathway from Roche, Merck MSD, Bristol-Myers-Squibb, Merck KGA, Boehringer-Ingelheim, AstraZeneca, Dako, Leica, Mayo Clinic, and Novartis. GJF has a patent on RGMb in cancer immunotherapy. GJF has served on advisory boards for Roche, Bristol-Myers-Squibb, Xios, Origimed, Triursus, iTeos, NextPoint, IgM, Jubilant, Trillium, GV20, IOME, and Geode. GJF has equity in Nextpoint, Triursus, Xios, iTeos, IgM, Trillium, Invaria, GV20, and Geode.
Data availability statement
The pharmacokinetic model, written and analyzed in MATLAB R2019b, has been published on GitHub at the following link: https://github.com/sarahcowles/PD1PharmacokineticModel
Supplementary material
Supplemental data for this article can be accessed online at https://doi.org/10.1080/19420862.2022.2088454
Correction Statement
This article was originally published with errors, which have now been corrected in the online version. Please see Correction (https://doi.org/10.1080/19420862.2024.2364972)
Additional information
Funding
References
- Sharpe AH, Wherry EJ, Ahmed R, Freeman GJ. The function of programmed cell death 1 and its ligands in regulating autoimmunity and infection. Nat Immunol. [ Internet] 2007;8:1–15. doi:10.1038/ni1443.
- Keir ME, Butte MJ, Freeman GJ, Sharpe AH. PD-1 and its ligands in tolerance and immunity. Annu Rev Immunol. [ Internet] 2008;26:677–704. doi:10.1146/annurev.immunol.26.021607.090331.
- Kuchroo JR, Hafler DA, Sharpe AH, Lucca LE. The double-edged sword: harnessing PD-1 blockade in tumor and autoimmunity. Sci Immunol. [ Internet] 2021;6:eabf4034. doi:10.1126/sciimmunol.abf4034.
- Hui E, Cheung J, Zhu J, Su X, Taylor MJ, Wallweber HA, Sasmal DK, Huang J, Kim JM, Mellman I, et al. T cell costimulatory receptor CD28 is a primary target for PD-1-mediated inhibition. Science. [ Internet] 2017;355:1428–33. doi:10.1126/science.aaf1292.
- Wei SC, Duffy CR, Allison JP. Fundamental mechanisms of immune checkpoint blockade therapy. Cancer Discov. [ Internet] 2018;8:1069–86. doi:10.1158/2159-8290.CD-18-0367.
- Ribas A, Wolchok JD. Cancer immunotherapy using checkpoint blockade. Science. [ Internet] 2018;359:1350–55. doi:10.1126/science.aar4060.
- Sharma P, Allison JP. The future of immune checkpoint therapy. Science. [ Internet] 2015;348:56–61. doi:10.1126/science.aaa8172.
- Xu JX, Maher VE, Zhang L, Tang S, Sridhara R, Ibrahim A, Kim G, Pazdur R. FDA approval summary: nivolumab in advanced renal cell carcinoma after anti-angiogenic therapy and exploratory predictive biomarker analysis. Oncologist. [ Internet] 2017;22:311–17. doi:10.1634/theoncologist.2016-0476.
- Peters S, Kerr KM, Stahel R. PD-1 blockade in advanced NSCLC: a focus on pembrolizumab. Cancer Treat Rev. [ Internet] 2018;62:39–49. doi:10.1016/j.ctrv.2017.10.002.
- Kasamon YL, de Claro RA, Wang Y, Shen YL, Farrell AT, Pazdur R. FDA approval summary: nivolumab for the treatment of relapsed or progressive classical Hodgkin lymphoma. Oncologist. [ Internet] 2017;22:585–91. doi:10.1634/theoncologist.2017-0004.
- De Sousa Linhares A, Battin C, Jutz S, Leitner J, Hafner C, Tobias J, Wiedermann U, Kundi M, Zlabinger GJ, Grabmeier-Pfistershammer K, et al. Therapeutic PD-L1 antibodies are more effective than PD-1 antibodies in blocking PD-1/PD-L1 signaling. Sci Rep. [ Internet] 2019;9:11472. doi:10.1038/s41598-019-47910-1.
- Zak KM, Grudnik P, Magiera K, Dömling A, Dubin G, Holak TA. Structural biology of the immune checkpoint receptor PD-1 and its ligands PD-L1/PD-L2. Structure. 2017;25:1163–74. doi:10.1016/j.str.2017.06.011.
- Wang J, Fei K, Jing H, Wu Z, Wu W, Zhou S, Ni H, Chen B, Xiong Y, Liu Y, et al. Durable blockade of PD-1 signaling links preclinical efficacy of sintilimab to its clinical benefit. MAbs. [ Internet] 2019;11:1443–51. doi:10.1080/19420862.2019.1654303.
- Richmond A, Su Y. Mouse xenograft models vs GEM models for human cancer therapeutics. Dis Model Mech. [ Internet] 2008;1:78–82. doi:10.1242/dmm.000976.
- De La Rochere P, Guil-Luna S, Decaudin D, Azar G, Sidhu SS, Piaggio E. Humanized Mice for the Study of Immuno-Oncology. Trends Immunol. [ Internet] 2018;39:748–63. doi:10.1016/j.it.2018.07.001.
- Fessas P, Lee H, Ikemizu S, Janowitz T. A molecular and preclinical comparison of the PD-1-targeted T-cell checkpoint inhibitors nivolumab and pembrolizumab. Semin Oncol. [ Internet] 2017;44:136–40. doi:10.1053/j.seminoncol.2017.06.002.
- Liang SC, Latchman YE, Buhlmann JE, Tomczak MF, Horwitz BH, Freeman GJ, Sharpe AH. Regulation of PD-1, PD-L1, and PD-L2 expression during normal and autoimmune responses. Eur J Immunol. [ Internet] 2003;33:2706–16. doi:10.1002/eji.200324228.
- Boder ET, Midelfort KS, Wittrup KD. Directed evolution of antibody fragments with monovalent femtomolar antigen-binding affinity. Proc Natl Acad Sci U S A. [ Internet] 2000;97:10701–05. doi:10.1073/pnas.170297297.
- Chao G, Lau WL, Hackel BJ, Sazinsky SL, Lippow SM, Wittrup KD. Isolating and engineering human antibodies using yeast surface display. Nat Protoc. [ Internet] 2006;1:755–68. doi:10.1038/nprot.2006.94.
- Ishino T, Wang M, Mosyak L, Tam A, Duan W, Svenson K, Joyce A, O’Hara DM, Lin L, Somers WS, et al. Engineering a monomeric Fc domain modality by N-glycosylation for the half-life extension of biotherapeutics. J Biol Chem. [ Internet] 2013;288:16529–37. doi:10.1074/jbc.M113.457689.
- Van Deventer JA, Wittrup KD. Yeast surface display for antibody isolation: library construction, library screening, and affinity maturation. Methods Mol Biol. [ Internet] 2014;1131:151–81. doi:10.1007/978-1-62703-992-5_10.
- Lo M, Kim HS, Tong RK, Bainbridge TW, Vernes J-M, Zhang Y, Lin YL, Chung S, Dennis MS, Zuchero YJY, et al. Effector-attenuating substitutions that maintain antibody stability and reduce toxicity in mice. J Biol Chem. [ Internet] 2017;292:3900–08. doi:10.1074/jbc.M116.767749.
- Sivasubramanian A, Sircar A, Chaudhury S, Gray JJ. Toward high-resolution homology modeling of antibody Fv regions and application to antibody-antigen docking. Proteins. [ Internet] 2009;74:497–514. doi:10.1002/prot.22309.
- Marze NA, Lyskov S, Gray JJ. Improved prediction of antibody VL-VH orientation. Protein Eng Des Sel. [ Internet] 2016;29:409–18. doi:10.1093/protein/gzw013.
- Weitzner BD, Jeliazkov JR, Lyskov S, Marze N, Kuroda D, Frick R, Adolf-Bryfogle J, Biswas N, Dunbrack RL Jr, Gray JJ. Modeling and docking of antibody structures with Rosetta. Nat Protoc. [ Internet] 2017;12:401–16. doi:10.1038/nprot.2016.180.
- Lyskov S, Chou F-C, Conchúir SÓ, Der BS, Drew K, Kuroda D, Xu J, Weitzner BD, Renfrew PD, Sripakdeevong P, et al. Serverification of molecular modeling applications: the Rosetta online server that includes everyone (ROSIE). PLoS One. [ Internet] 2013;8:e63906. doi:10.1371/journal.pone.0063906.
- Labrijn AF, Meesters JI, Priem P, de Jong RN, van den Bremer ETJ, van Kampen MD, Gerritsen AF, Schuurman J, Parren PWHI. Controlled Fab-arm exchange for the generation of stable bispecific IgG1. Nat Protoc. [ Internet] 2014;9:2450–63. doi:10.1038/nprot.2014.169.
- Labrijn AF, Meesters JI, Bunce M, Armstrong AA, Somani S, Nesspor TC, Chiu ML, Altintaş I, Verploegen S, Schuurman J, et al. Efficient generation of bispecific murine antibodies for pre-clinical investigations in syngeneic rodent models. Sci Rep. [ Internet] 2017;7:2476. doi:10.1038/s41598-017-02823-9.
- Schmidt MM, Thurber GM, Wittrup KD. Kinetics of anti-carcinoembryonic antigen antibody internalization: effects of affinity, bivalency, and stability. Cancer Immunol Immunother. [ Internet] 2008;57:1879–90. doi:10.1007/s00262-008-0518-1.
- Lindauer A, Valiathan CR, Mehta K, Sriram V, de Greef R, Elassaiss-Schaap J, de Alwis DP. Translational pharmacokinetic/pharmacodynamic modeling of tumor growth inhibition supports dose-range selection of the anti-PD-1 antibody pembrolizumab. CPT Pharmacometrics Syst Pharmacol. [ Internet] 2017;6:11–20. doi:10.1002/psp4.12130.
- Li Z, Krippendorff B-F, Shah DK. Influence of Molecular size on the clearance of antibody fragments. Pharm Res. [ Internet] 2017;34:2131–41. doi:10.1007/s11095-017-2219-y.
- Thurber GM, Schmidt MM, Wittrup KD. Factors determining antibody distribution in tumors. Trends Pharmacol Sci. [ Internet] 2008;29:57–61. doi:10.1016/j.tips.2007.11.004.
- Schmidt MM, Wittrup KD. A modeling analysis of the effects of molecular size and binding affinity on tumor targeting. Mol Cancer Ther. [ Internet] 2009;8:2861–71. doi:10.1158/1535-7163.MCT-09-0195.
- Selby MJ, Engelhardt JJ, Johnston RJ, L-S L, Han M, Thudium K, Yao D, Quigley M, Valle J, Wang C, et al. Preclinical development of ipilimumab and nivolumab combination immunotherapy: mouse tumor models, In Vitro Functional Studies, and Cynomolgus Macaque Toxicology. PLoS One. [ Internet] 2016;11:e0161779. doi:10.1371/journal.pone.0161779.
- Kurino T, Matsuda R, Terui A, Suzuki H, Kokubo T, Uehara T, Arano Y, Hisaka A, Hatakeyama H. Poor outcome with anti-programmed death-ligand 1 (PD-L1) antibody due to poor pharmacokinetic properties in PD-1/PD-L1 blockade-sensitive mouse models. J Immunother Cancer. [ Internet] 2020;8 doi:10.1136/jitc-2019-000400.
- Moreno-Vicente J, Willoughby JE, Taylor MC, Booth SG, English VL, Williams EL, Penfold CA, Mockridge CI, Inzhelevskaya T, Kim J, et al. Fc-null anti-PD-1 monoclonal antibodies deliver optimal checkpoint blockade in diverse immune environments. J Immunother Cancer. [ Internet] 2022;10. doi:10.1136/jitc-2021-003735.
- Martins F, Sofiya L, Sykiotis GP, Lamine F, Maillard M, Fraga M, Shabafrouz K, Ribi C, Cairoli A, Guex-Crosier Y, et al. Adverse effects of immune-checkpoint inhibitors: epidemiology, management and surveillance. Nat Rev Clin Oncol. [ Internet] 2019;16:563–80. doi:10.1038/s41571-019-0218-0.
- Shah DK, Betts AM. Towards a platform PBPK model to characterize the plasma and tissue disposition of monoclonal antibodies in preclinical species and human. J Pharmacokinet Pharmacodyn. [ Internet] 2012;39:67–86. doi:10.1007/s10928-011-9232-2.
- Thurber GM, Schmidt MM, Wittrup KD. Antibody tumor penetration: transport opposed by systemic and antigen-mediated clearance. Adv Drug Deliv Rev. [ Internet] 2008;60:1421–34. doi:10.1016/j.addr.2008.04.012.
- Rudnick SI, Adams GP. Affinity and avidity in antibody-based tumor targeting. Cancer Biother Radiopharm. [ Internet] 2009;24:155–61. doi:10.1089/cbr.2009.0627.
- Tai Y, Wang Q, Korner H, Zhang L, Wei W. Molecular mechanisms of T cells activation by dendritic cells in autoimmune diseases. Front Pharmacol. [ Internet] 2018;9 doi:10.3389/fphar.2018.00642.
- Riha P, Rudd CE. CD28 co-signaling in the adaptive immune response. Self Nonself. [ Internet] 2010;1:231–40. doi:10.4161/self.1.3.12968.
- Xia F, Qian C-R, Xun Z, Hamon Y, Sartre A-M, Formisano A, Mailfert S, Phelipot M-C, Billaudeau C, Jaeger S, et al. TCR and CD28 concomitant stimulation elicits a distinctive calcium response in naive T cells. Front Immunol. [ Internet] 2018;9:2864. doi:10.3389/fimmu.2018.02864.
- Dahan R, Sega E, Engelhardt J, Selby M, Korman AJ, Ravetch JV. FcγRs modulate the anti-tumor activity of antibodies targeting the PD-1/PD-L1 axis. Cancer Cell. [ Internet] 2015;28:285–95. doi:10.1016/j.ccell.2015.08.004.
- Arlauckas SP, Garris CS, Kohler RH, Kitaoka M, Cuccarese MF, Yang KS, Miller MA, Carlson JC, Freeman GJ, Anthony RM, et al. In vivo imaging reveals a tumor-associated macrophage-mediated resistance pathway in anti-PD-1 therapy. Sci Transl Med. [ Internet] 2017;9. doi:10.1126/scitranslmed.aal3604.
- Tian T, Li Z. Targeting tim-3 in cancer with resistance to PD-1/PD-L1 blockade. Front Oncol. [ Internet] 2021;11:731175. doi:10.3389/fonc.2021.731175.
- Coward J, Frentzas S, Mislang A, Gao B, Lemech C, Jin X, Li B, Wang M, Kwek KY, Zhou Y, et al. 427 Efficacy and safety of AK112, an anti-PD-1/VEGF-A bispecific antibody, in patients with platinum-resistant/refractory epithelial ovarian cancer in a Phase 1 study. J Immunother Cancer. [ Internet] 2021;9. [cited 2022 Mar 8]. https://jitc.bmj.com/content/9/Suppl_2/A457.
- Robert C. LAG-3 and PD-1 blockade raises the bar for melanoma. Nat Cancer. [ Internet] 2021;2:1251–53. doi:10.1038/s43018-021-00276-8.
- Pentcheva-Hoang T, Chen L, Pardoll DM, Allison JP. Programmed death-1 concentration at the immunological synapse is determined by ligand affinity and availability. Proc Natl Acad Sci U S A. [ Internet] 2007;104:17765–70. doi:10.1073/pnas.0708767104.
- Riley JL. PD-1 signaling in primary T cells. Immunol Rev. [ Internet] 2009;229:114–25. doi:10.1111/j.1600-065X.2009.00767.x.
- Yokosuka T, Takamatsu M, Kobayashi-Imanishi W, Hashimoto-Tane A, Azuma M, Saito T. Programmed cell death 1 forms negative costimulatory microclusters that directly inhibit T cell receptor signaling by recruiting phosphatase SHP2. J Exp Med. [ Internet] 2012;209:1201–17. doi:10.1084/jem.20112741.
- Fenwick C, Loredo-Varela J-L, Joo V, Pellaton C, Farina A, Rajah N, Esteves-Leuenberger L, Decaillon T, Suffiotti M, Noto A, et al. Tumor suppression of novel anti-PD-1 antibodies mediated through CD28 costimulatory pathway. J Exp Med. [ Internet] 2019;216:1525–41. doi:10.1084/jem.20182359.
- Garris CS, Arlauckas SP, Kohler RH, Trefny MP, Garren S, Piot C, Engblom C, Pfirschke C, Siwicki M, Gungabeesoon J, et al. Successful anti-PD-1 cancer immunotherapy requires T cell-dendritic cell crosstalk involving the cytokines IFN-γ and IL-12. Immunity. [ Internet] 2018;49:1148–1161.e7. doi:10.1016/j.immuni.2018.09.024.
- Bee C, Abdiche YN, Stone DM, Collier S, Lindquist KC, Pinkerton AC, Pons J, Rajpal A. Exploring the dynamic range of the kinetic exclusion assay in characterizing antigen-antibody interactions. PLoS One. [ Internet] 2012;7:e36261. doi:10.1371/journal.pone.0036261.
- Sapidyne Instruments Inc. KinExA Manual [Internet]. 2019. [Accessed 20 Mar 2022]. https://www.sapidyne.com/uploads/1/1/8/8/118887362/um200r1_kinexa_manual.pdf
- Tisdale AW New protein engineering approaches for potentiating and studying antibody-based EGFR antagonism [Internet]. 2019 [cited 2022 Mar 22]: https://dspace.mit.edu/handle/1721.1/122521?show=full
- Momin N, Palmeri JR, Lutz EA, Jailkhani N, Mak H, Tabet A, Chinn MM, Kang BH, Spanoudaki V, Hynes RO, et al. Maximizing response to intratumoral immunotherapy in mice by tuning local retention. Nat Commun. [ Internet] 2022;13:109. doi:10.1038/s41467-021-27390-6.
- Thurber GM, Dane Wittrup K. A mechanistic compartmental model for total antibody uptake in tumors. J Theor Biol. [ Internet] 2012;314:57–68. doi:10.1016/j.jtbi.2012.08.034.
- Juneja VR, McGuire KA, Manguso RT, LaFleur MW, Collins N, Haining WN, Freeman GJ, Sharpe AH. PD-L1 on tumor cells is sufficient for immune evasion in immunogenic tumors and inhibits CD8 T cell cytotoxicity. J Exp Med. [ Internet] 2017;214:895–904. doi:10.1084/jem.20160801.
- Hinterneder J, Hopkinton MA Measuring PD-L1 and PD-1 expression in human cells with LANCE ultraTR-FRET.
- Zhang X, Schwartz J-CD, Guo X, Bhatia S, Cao E, Lorenz M, Cammer M, Chen L, Zhang Z-Y, Edidin MA, et al. Structural and functional analysis of the costimulatory receptor programmed death-1. Immunity. [ Internet] 2004;20:337–47. doi:10.1016/s1074-7613(04)00051-2.
- Li K, Cheng X, Tilevik A, Davis SJ, Zhu C. In situ and in silico kinetic analyses of programmed cell death-1 (PD-1) receptor, programmed cell death ligands, and B7-1 protein interaction network. J Biol Chem. [ Internet] 2017;292:6799–809. doi:10.1074/jbc.M116.763888.
- Burr ML, Sparbier CE, Chan Y-C, Williamson JC, Woods K, Beavis PA, Lam EYN, Henderson MA, Bell CC, Stolzenburg S, et al. CMTM6 maintains the expression of PD-L1 and regulates anti-tumour immunity. Nature. [ Internet] 2017;549:101–05. doi:10.1038/nature23643.