
 ?Mathematical formulae have been encoded as MathML and are displayed in this HTML version using MathJax in order to improve their display. Uncheck the box to turn MathJax off. This feature requires Javascript. Click on a formula to zoom.
ABSTRACT
Affinity-capture self-interaction nanoparticle spectroscopy (AC-SINS) is an assay developed to monitor the propensity of antibody self-association, hence assessing its colloidal stability. It has been widely used by pharmaceutical companies to screen antibodies at the early discovery stages, aiming to flag potential issues with high concentration formulation. However, the original assay format is not suitable for certain formulation conditions, in particular histidine buffer. In addition, the previous data extrapolation method is suboptimal and cumbersome for processing large amounts of data (100s of molecules) in a high-throughput fashion. To address these limitations, we developed an assay workflow with two major improvements: 1) use of a stabilizing reagent to enable screening of a broader range of formulation conditions beyond phosphate-buffered saline, pH 7.4; and 2) inclusion of a novel algorithm and robust data processing schema that empowers streamlined data analysis. The optimized assay format expands the screening applicability to a wider range of formulation conditions critical for downstream development. Such capability is enhanced by a custom data management workflow for optimal data extraction, analysis, and automation. Our protocol and the R/Shiny application for analysis are publicly available and open-source to benefit the broader scientific community.
Introduction
In recent years, timelines on biologics discovery and development for unmet medical needs have been continually reduced. With the goals of higher success rates and less triaging at later stages of drug development, it is critical to identify and accelerate the discovery of therapeutic antibodies with both superior biologic activity and suitable developability profiles. Meanwhile, the increasing demand for liquid formulation for possible subcutaneous administration has driven device and formulation choices toward ease-of-use and products amenable to self-administration. This usually requires stable liquid formulation at high concentration (≥ 100 mg/mL) for efficacy and manageable viscosity (< 30 centipoise (cP)) for self-administration and patient compliance.Citation1 Therefore, proper colloidal stability has become an increasingly crucial aspect for therapeutic monoclonal antibody (mAb) development. However, assessing colloidal stability at the early stages on many discovery molecules with limited material availability remains challenging.
Affinity-capture self-interaction nanoparticle spectroscopy (AC-SINS) is one of the many surrogate methods developed for assessing the self-association tendency of therapeutic mAbs, with the intention to prioritize mAbs that have favorable developability attributes.Citation2–5 Fundamentally, AC-SINS takes advantage of the colloidal stability of gold nanoparticles (AuNPs) to capture the self-association propensity of mAbs, which is reflected by the plasmon wavelength shift upon AuNP aggregation. Since its origination in 2013,Citation5 many research groups have continued optimizing the method for improved sensitivity and consistency.Citation2–4,Citation6 Due to its low material consumption, low concentration requirement, and predictive potential for mAb solution behavior on colloidal stability, AC-SINS has garnered much attention among pharmaceutical companies and has become a method of choice for early developability assessment.Citation7–9
Two major implications have emerged from the reported uses of AC-SINS for mAb discovery and development. One relates to the screening nonspecific binding, which could result in undesirable pharmacokinetic effects.Citation10–12 Avery et al.Citation11 explored the correlations between in vitro physiochemical properties and in vivo human pharmacokinetics using 42 mAbs. Among the panel of in vitro assays tested, AC-SINS reasonably differentiated mAbs with faster in vivo clearance, by a Spearman correlation coefficient of 0.7 between AC-SINS assay score and observed clearance. Subsequently, Jones et al.Citation10 developed a mAb physiologically based pharmacokinetic prediction model that incorporated the nonspecific interaction aspect of mAbs represented by AC-SINS data for calibration. The final model, using AC-SINS data as input, was able to accurately predict the trend in pharmacokinetic properties across the 21 mAbs tested and correctly categorize those mAbs with poor in vivo properties.
The second implication, which is the focus here, relates to the colloidal stability and high-concentration behavior of mAbs. Several studies have reported that AC-SINS effectively identifies mAbs with either low solubility or high viscosity.Citation3,Citation5,Citation13–15 Considering that viscosity determination typically requires at least 20 mg of protein per condition, whereas AC-SINS consumes only microgram quantities of proteins, the potential of using AC-SINS to screen hundreds of molecules is particularly attractive for early-stage antibody discovery, where large numbers of molecules are available in minute amounts. The previous case studies, such as wild-type (WT) and variants, appear to be supportive of such use.Citation14,Citation16 Yet the general predictability of AC-SINS for high-concentration behavior across a diverse set of molecules remains elusive. Multiple factors may contribute to this, such as assay protocol variations including suboptimal data analysis, limited end-point results (e.g., viscosity), and misaligned formulation conditions between viscosity and AC-SINS. These complications prevented aggregating data for systematic analysis.
In 2020, Kingsury et al.Citation7 published a comprehensive study on high-concentration behavior of mAbs, investigating a variety of experimentally determined attributes and molecular descriptors for their predictive potential. Importantly, the researchers collected viscosity and opalescence data (10 mM histidine·HCl (pH 6.0)) across a diverse panel of therapeutic mAbs (total of 59) for correlation analysis. The study indicated that the diffusion interaction parameter (kD) measured at 10 mM histidine·HCl, (pH 6.0) is an effective predictor for high-concentration behavior. However, the Kingsury study did not reveal a correlation between AC-SINS data measured in phosphate-buffered saline (PBS) and viscosity data measured in histidine at pH 6.0. Protein colloidal stability, such as viscosity, is highly formulation-dependent. Buffer species, pH, salt, as well as excipients, can have a significant impact on viscosity. It would be more meaningful to correlate AC-SINS results measured in histidine (pH 6.0) with viscosity data measured in the same formulation (histidine), to evaluate the predictive potential of AC-SINS.
This highlights the alignment of AC-SINS assay conditions to the targeted formulation conditions for proper assessment of high-concentration colloidal behavior. According to a recent survey of therapeutic mAbs,Citation17 the most prevalent formulation is histidine-based, followed by acetate, with pH values around 5.7 +/− 0.4. Therefore, it is desirable to perform AC-SINS in histidine- and acetate-based conditions. However, the dominant AC-SINS assay condition is PBS, according to studies reported in the literature, likely due to the intrinsic hurdles associated with the AC-SINS assay, and the practical convenience offered by the PBS condition. In early discovery, hundreds of molecules are usually prepared and normalized in PBS (1 mg/mL) to be compatible with functional or activity assays, as well as the panel of developability screening assays commonly enlisted, including AC-SINS. Thus, discovery hits were usually compared in only one formulation condition (e.g., PBS) by high-throughput biophysical screeningsCitation9 due to scarcity of both sample and time. It is still a matter of debate as to how these high throughput predictive methods collectively inform overall mAb developability, especially when it comes to high-concentration risk assessment.
Given that formulation conditions have a major impact on the colloidal stability of mAbs, it is critical to screen mAbs for their high-concentration behavior in several representative formulation conditions. We have routinely applied PEG-induced precipitation for solubility screening and ranking order under designated formulation conditions.Citation18 While useful for solubility screening, PEG-induced precipitation does not distinguish opalescence and viscosity behavior. The gap has stimulated us to further develop an AC-SINS assay that can be performed in relevant formulation conditions, in addition to PBS. Our aspirational goal is to establish such methods and collect reliable, sizable data, in matching formulation conditions, to perform systematic correlation analysis on the predictability of AC-SINS or combinations of other assays with respect to high-concentration formulation.
The colloidal stability of gold nanoparticles (AuNPs) is sensitive to pH, buffer, small molecules and amino acids.Citation19,Citation20 Zakaria et al.Citation20 performed a systematic study investigating the interaction of AuNPs with amino acids and small molecules at variable pH. They presented models suggesting that charge reduction and bridging of linkers is a potential mechanism leading to AuNP aggregation. In part, colloidal gold is stabilized in the presence of anionic carboxyl (citrate-capped shell) at the last step of manufacturing. Neutralization by protonation at lower pH, or interaction with amino acids (such as histidine) or small molecules account for the accelerated AuNP agglomeration. Similarly, immunogold conjugates aggregate readily in the presence of histidine buffer.Citation15 We hypothesized that the carboxyl groups composed of citrate-capped shells on AuNP could react with the histidine moiety in solution at pH 6.0, which results in bead aggregation (bead and nanoparticle are used interchangeably in the following text). Based on this, we explored use of stabilizing reagents that could prevent histidine-induced instability of AuNPs by blocking potential reactive sites. Our engineered method significantly stabilized immunogold conjugates in histidine buffer, as well as citrate and acetate buffers, which enables meaningful and reliable evaluation for a wider range of formulation conditions that are relevant to high-concentration formulation. We have subsequently developed a streamlined assay format and incorporated it into our developability assessment drill for mAb discovery programs.
At or near the same time we performed our study, StarrCitation15 developed a method addressing the same limitation by use of poly-lysine to stabilize AuNPs in histidine·HCl (pH 6.0). The authors showed that co-adsorption of charged molecules (poly-lysine) is sufficient to stabilize the conjugates, and therefore sufficient to evaluate mAb self-association in histidine buffer. While Starr applies poly-lysine to increase bead charge for repulsive and stabilizing effects, we use an inert, stabilizing reagent (PEG2000) for masking bead surfaces, achieving a generic measure to control nonspecific bead agglomeration due to buffer or pH changes. The two approaches offer alternative and complementary ways to overcome the technical hurdles.
In our practice of running high-throughput, plate-based AC-SINS assays, another challenge is data processing and analysis. The original Excel sheet-based approach tends to be error prone and unstable (crashing during the process) when handling larger sets of data. This posed major hurdles for method development, productivity, reproducibility, as well as data aggregation. We developed an in-house data processing application to address these concerns and prepare for a long-term, structured data capture workflow. We first used “local estimated scatterplot smoothing” (LOESS) as a consistent means for characterizing the plasmon wavelength and more accurate peak extrapolation. Then, we developed an R/Shiny application to streamline data processing, as well as data visualization and comparison on demand. Finally, we devised a statistical analysis for data quality check, and built standardized outputs and reports. The customized design enabled us to integrate experimental flow, data uploading, and processing into one streamlined process, reducing the tedious hands-on steps while allowing transparent and flexible data analysis.
In summary, we report a solution that enables the performance of AC-SINS in several formulation conditions (histidine buffer at pH 6.0; citrate buffer at pH 6.0; and acetate buffer at pH 5.0) beyond PBS, by PEG2000-stabilized (PS) immunogold conjugates, which provides richer, relevant information for evaluating the self-association propensity of mAbs. Moreover, our enhanced data processing and automated data capture schema enable use of the AC-SINS assay’s full potential, providing multi-formulation profiling as needed for comprehensive decision-making. Our protocol and R/Shiny application is publicly available and open-source to ensure widespread dissemination and easy implementation. We anticipate that this will make the PS-SINS method substantially more accessible, robust, and easier to adopt by the scientific and industrial communities.
Results
Optimization of AC-SINS for screening mAbs in histidine formulation
We are able to perform the AC-SINS assay in either PBS or citrate (10 mM citrate, 150 mM NaCl pH 6.0) conditions with reproducible results, using the original protocol.Citation3,Citation6 As a first step toward optimizing our assay for analyzing mAbs in histidine formulation, we sought to establish the baseline of AuNP response to solution changes. As expected, histidine buffer induces gold particle aggregation of both unconjugated AuNP and immunogold conjugates under standard procedures, as evidenced by a pink-to-blue color change. The corresponding plasmon wavelength (pwl) for the conjugates (range 574 ~ 600 nm) is much higher than that of stable antibody-gold conjugates (~530 nm).Citation5,Citation6,Citation15
We view that controlling bead aggregation and reestablishing the normal profile of immunogold conjugates in histidine (pH 6.0) is a critical first step. Per manufacturer specifications, the 20 nm AuNPs are final polished with citrate capping. This standard treatment produces nanoparticles with surface electrostatically stabilized by adsorbed citrate anions. The negatively charged citrate shell, consisting of a large, negative zeta potential, stabilizes AuNP in a well-dispersed state in solution. It is believed that disruption of the negatively charged shell or reduction of surface charge leads to rapid aggregation of AuNPs.Citation15,Citation20
Based on the theory, we explored stabilization reagents that can block such reactivity between histidine and surface capping citrate. We experimented with several common blocking and stabilizing reagents (bovine serum albumin, non-capturing antibody, or polymer). As our initial results indicated that PEG2000 is most effective, further optimization efforts focused on this agent. In the original protocol, a low level of thiolated PEG2000 was added to the gold-antibody conjugates at the quenching step (final concentration of 0.2 µg/mL PEG2000) to prevent nonspecific interactions. We investigated if a higher level of PEG2000, introduced at different steps in the assay, can stabilize immunogold conjugates in histidine buffer.
Initially, we increased PEG2000 to 1 µg/mL at the quenching step after the conjugation reaction (conjugation of polyclonal goat-anti human Fc), with the intention of blocking the bead surface completely (citrate shell). When examining the beads alone, or beads with anti-Fc conjugation in histidine (pH 6.0), we observed pwl left shift, indicating bead aggregation was decreased, but not completely abolished (data not shown). Encouraged by the result, we supplemented an additional 0.1 µg/mL of PEG2000 in the final reaction mixture, when immunogold conjugates and testing mAbs were incubated in histidine buffer. This further reduced bead aggregation, resulting in a broad and low-intensity plasmon wavelength curve, peaking at ~ 544 nM (). This result was promising, yet not sufficient for screening purposes.
Figure 1. Stabilization of immunogold conjugates by incorporation of PEG2000 and low level of salt (30 mM NaCl). This can be seen in the absorbance spectra profile overlay (a) and table (b): Histidine buffer condition requires both PEG2000 and low level of salt to regain normal peak profile, while citrate-based buffer condition is indifferent to salt, only requires PEG2000 stabilization. H6: 10 mM histidine buffer, pH 6.0; H6N30: 10 mM histidine buffer, pH 6.0, 30 mM NaCl; C6: 10 mM citrate buffer, pH 6.0; C6N30: 10 mM citrate buffer, pH 6.0, 30 mM NaCl.(a) A graph showing four peaks from four different buffers, X-axis is wavelength, Y-axis is absorbance. H6 peak, in red, is broad and low intensity whereas C6, C6N30 and H6N30 peaks are higher intensity and less broad. Each buffer condition resulted in one single peak. (b) A table showing four buffer conditions (C6N30, C6, H6N30 and H6) in column 1, the unabreviated names of the buffers (citrate, citrate, histidine, histidine) in column 2, amount of PEG at wash step in column 3, amount of PEG at reaction in column 4, amount of salt (NaCl) in column 5, ave pwl in column 6 and std dev in column 7. Ave pwl in column 6 are color coded so that the top three rows are green and the bottom row (H6) is a dark orange with an ave pwl of 545.6.
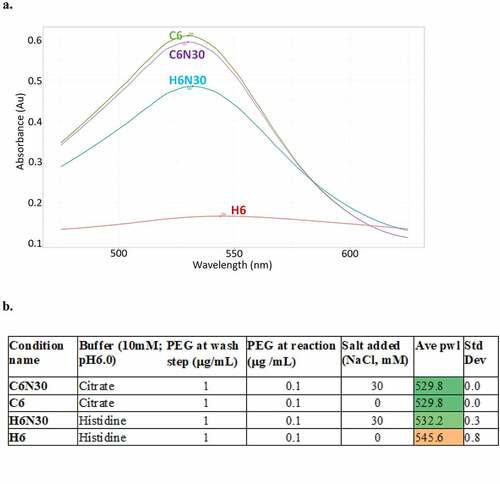
We then experimented with salt concentrations. We discovered that addition of salt (15 to 50 mM NaCl) can yield a plasmon wavelength profile (histidine pH 6.0) similar to that of PBS conditions, with buffer blank peak at ~ 530 nm (). The minimal salt concentration required for controlling bead aggregation is 15 mM NaCl. At the discovery stage, mAbs are routinely buffered in PBS at the last purification step and subsequently normalized to 1 mg/mL for a variety of characterization assays. We dilute mAb samples (prepared in PBS at 1 mg/mL) into the final reaction mixture to reach the targeted formulation conditions. In the case of the histidine buffer condition, this procedure yields a final assay condition around 10 mM histidine, 30 mM NaCl, at pH 6.0, which we considered a proxy of the desired formulation condition (10 mM histidine, pH 6.0) and useful for the initial phase of early screening. Thus, we opted for dilution, not buffer exchange of samples, for a practical and high-throughput process.
Table 1. Average plasmon wavelength (Ave pwl) of antibody−gold conjugates in various buffer conditions, with or without PEG2000 stabilization of conjugates, and at different levels of salt in the final reaction solution (NaCl). Standard Deviation (Std Dev) is based on 4 measurements.
In summary, our final optimized assay procedure includes the following changes: addition of 1 µg/mL of PEG2000 after the bead conjugation step, followed by an additional 0.1 µg/mL PEG2000 in the reaction mixture; and testing mAb (1 mg/mL in PBS), immunogold conjugates stock, diluted with corresponding formulation buffer. Interestingly, after PEG2000 treatment, immunogold conjugates in citrate buffer condition (pH 6.0) do not rely on salt for stabilization (; ), presenting similarly stable profiles regardless of C6 or C6N30. In addition, the performance of immunogold conjugates in PBS condition is unaffected by PEG2000 treatment or salt, suggesting PEG2000 treatment does not adversely affect assay performance. Based on these results, we uniformly prepare each batch of immunogold conjugates with PEG2000 as specified above. The PEG2000 stabilized immunogold conjugates are subsequently aliquoted for assays in the designated formulation conditions chosen for high-throughput screening, which we abbreviated as H6N30, C6N30, A5N30, or PBS ().
Robust and high-throughput PS-SINS workflow
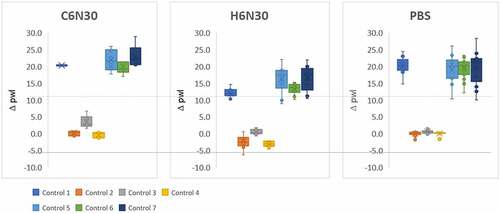
We use seven mAbs of known behavior as controls for calibration purposes when performing PS-SINS. The results of control mAbs are aggregated for variation analysis, displayed in a box and whisker plot grouped by the three formulation conditions (C6N30, H6N30, and PBS) (). We find that the PS-SINS results qualitatively correlate with the high-concentration behavior of the control mAbs previously characterized. Based on independent measurements shown in , mAbs of low Δpwl (controls 2, 3, and 4) have tight assay-to-assay variability. On the other hand, mAbs of high Dpwl (>10), such as controls 1, 5, 6, and 7, tend to have higher assay variability. Certain mAbs (such as controls 1, and 6) demonstrate significant Dpwl change in response to citrate, histidine buffer, or PBS, suggesting PS-SINS can capture the differential behavior of mAbs in a consistent manner. Substantial pwl right shift indicates higher aggregation levels of the immunogold conjugates induced by self-associative mAbs. The agglomerates are likely composed of heterogeneous clusters, which could manifest variably by pwl, therefore resulting in the higher variability of Dpwl seen in controls 5, 6, and 7. Based on the observations, we use Dpwl of 10 and 20 as empirical thresholds to categorize mAbs on their self-association risk (intermediate and high, respectively) for the respective formulations.
Figure 2. PS-SINS results of 7 control mAbs measured in C6N30, H6N30, and PBS over 10 times are displayed in box and whisker plot.Three, side-by-side box and whisker plots. The left plot, labeled C6N30, the middle labeled H6N30 and the right labeled PBS. The y-axis is labeled delta pwl. A dashed line is drawn across all 3 plots right above the number 10.0. Controls 2–4 are below the dashed line, close to 0, in all 3 plots. Controls 1, 5, 6 and 7 are above the dashed line in all 3 plots. The legend is located below the plot to the left, with the different controls having a different color assignment.
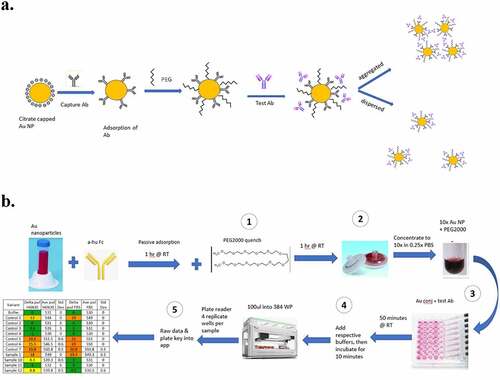
The calibrated and reliable performance of PS-SINS in several formulation conditions, including H6N30, C6N30, A5N30, and PBS, prompted us to pursue a workflow suited for high-throughput screening (). The material requirement is ~20 µg mAb per formulation condition, which covers quadruplicate measurement of each sample by default. Each result (Dpwl) is averaged from quadruplicates with standard deviation reported. The panel of control mAbs (shown in ) are included as internal references for all AC-SINS experiments. Moreover, the plate layout and data processing application support flexible custom designs, such as the number of formulation conditions or options for triplicate/duplicate measurements. Altogether, the wet lab work takes ~ 4 hours from start to finish. With the automation robot programmed for sample liquid handling, it is feasible to screen 100 ~200 mAbs per day.
Figure 3. Optimized PEG-stabilized SINS protocol (PS-SINS) and workflow. Major steps with optimizations are: 1) Couple Au beads and quench with PEG2000 at 1 mg/mL for one hour (a). 2) Elution by PBS (0.25x) into concentrated Au NP solution (10x). 3) Add PEG2000 of 0.1 mg/mL to the reaction mixture, with the mAb sample, PEG-stabilized immunogold conjugates, and the corresponding buffer solution. This resulted a final mAb concentration of 50 mg/mL in the respective buffer conditions. 4) Add buffer to bring up volume for robotic dispensation. 5) upload raw data obtained from plate reader to R/Shiny app for data processing and analysis.(a) A reaction flow, going from left to right, of a yellow circle surrounding by negative charge bubbles. An arrow points to the right, showing addition of Y-shaped antibodies onto the yellow circle. An arrow to the right of this new yellow circle with antibodies on the surface show the yellow circle now also with squiggly lines in between the antibodies, denoting PEG attachment. Another arrow to the right, showing Test Ab addition onto the yellow circle. There are then 2 different arrows, one going the upper right corner showing these yellow circles to be close to each other. The arrow going to the lower right corner show 3 yellow circles further apart. (b) A workflow going from left to right, then going down and looping back to the left. The workflow starts with a 50 ml conical, add anti-Fc antibody, incubation for 1 hr at RT, then add PEG and incubate for 1 hr at RT. Then, 2 syringe filters are shown, 1 with dark pink on the membrane and 1 that looks white. Arrow to the right shows concentration of 10x and a darker, smaller volume of the pink gold. The workflow the loopdowns to the bottom and shows a multi-channel pipet in the process of adding pink gold solutions onto a well plate. Continuing to the left shows incubation at RT for 50 minutes followed and the note “100ul into 384 WP” right above a liquid dispensing robot. It continues to the left with four replicate wells per sample” and a table showing Control and Sample names, with conditionally color coding of results.
We have applied PS-SINS to facilitate molecule selection for mAb discovery campaigns. For example, a panel of mAbs and their PS-SINS results in three formulation conditions are summarized in . The self-association propensity, reflected by Dpwl, reveals the pH and buffer species-dependent solution behavior of certain mAbs. It is notable that some mAbs are low signal (Dpwl ≤ 5, green, no concerns) across all three formulations tested, such as mAbs 2c, 3, 4, 5, 6, 7, 8, and 9; while some are high signal (pwl ≥ 10, orange to red, intermediate to high concern) across all three formulation conditions, such as mAbs 1, 1a, 10, 11, and 12. However, mAbs 1b, 1c, 2b, 13, 14, 15, and 16 demonstrated differential behavior among different formulations, ranging from low to high self-association. In one case study of mAbs 1, 1a, 1b, and 1c, which differ either by subtype only (1 vs 1a), or differ by CDR mutations (1a, 1b, 1c), PS-SINS captures the mutational effect or subtype impact on the mAb’s self-association behavior, consistent with their viscosity measurements (data not shown). Similarly, we were able to use PS-SINS to characterize mAb 2 and its engineered variants (mAbs 2a, 2b, 2c, 2d) in an effort to address viscosity and phase separation behavior of mAb 2 (WT). Among the engineered variants, mAb 2c shows most improvement, followed by 2b and 2a, while variant 2d has a WT-like profile. This is consistent with confirmatory viscosity measurements.
Table 2. Profiling of a panel of mAbs on their self-association propensity, under 3 formulation conditions.
Taken together, the results suggest that the PS-SINS assay is capable of screening molecules for their formulation-dependent behavior and is sensitive enough to distinguish closely related variants. In our practice, we flag molecules that show high pwl shifts (>10) across multiple formulation conditions. We recommend close examination of molecules bearing differential behavior, either high Dpwl in H6N30 or PBS, with orthogonal methods to assess the risk and compatibility by program and development needs.
Improving data extrapolation accuracy by LOESS
To enable high-throughput data processing with enhanced accuracy, we developed a systematic and automated approach for calculating the plasmon wavelength shift (Dpwl) of the test sample. Raw AC-SINS data consist of 151 absorbance reading data points for each sample, with each reading at a distinct wavelength value ranging from 475 nm to 625 nanometers (nm). When the absorbance is plotted against the wavelength range, the maximum value (i.e., peak), is used for calculating Dpwl for self-association assessment. The AC-SINS analysis methodCitation4,Citation5 commonly practiced by researchers has several drawbacks, including inaccuracy due to poor curve fitting as well as the use of an unstable Excel macro. The uncertain nature of the approach necessitated manual, ad-hoc discernment, which is not suitable for a high throughput format. The Excel macro approach called for a curve fit applied only to the clustered subset of higher-value data points (peak region) as a means of reducing bias of the curve fit to estimate the plasmon wavelength. Despite this, we found that the model applied did not fit the data points with accuracy or consistency. Due to the variation across curve profiles and lack of symmetry, the curve fit would often overshoot the true plasmon wavelength area, producing a calculated plasmon wavelength value that did not reflect the true result (). Furthermore, the workflow involved in obtaining this value was time-consuming and tedious, requiring manual manipulation of the data subset within an Excel workbook and visual review. Within a given Excel workbook, Excel Fit was implemented for the curve fit after the data had been subset per case. Overall, the previous method faced disadvantages, including inaccurate plasmon wavelength value estimations, excessive time consumption, and lack of a systematic approach due to custom adjustments per dataset.
Figure 4. Apply LOESS method for improved accuracy capturing the peak of plasmon wavelength (a). Peak of plasmon wavelength can be extrapolated robustly, regardless of suboptimal (left) or optimal (right) raw data, by drawing a smooth curve through the data points and unbiased by outlying values near the peak. LOESS method avoids the pitfall of the commonly practiced method (EXCEL macro and EXCEL fit), which can mis-calculate the peak of plasmon wavelength due to local fluctuation of readings (b). The top panel of (B) shows the raw data (entire scan) and the bottom panel is the zoom in of the peak area, the outlier points can challenge curve fitting of the traditional method.(a) Two panels of plasmon wavelength plots. Both plots show absorbance on the y axis and wavelength on the x axis. Each panel has plasmon wavelength data and a smooth line drawn through the data. The left panel has suboptimal data that is scattered about the line. The right panel has data that is mostly on the line. (b) Six plasmon wavelength plots in two rows of three. The plots in the bottom row zoom into the peak of the plots in the top row. The plots in the bottom row show how the outliers could lead to the incorrect maximum being determined.
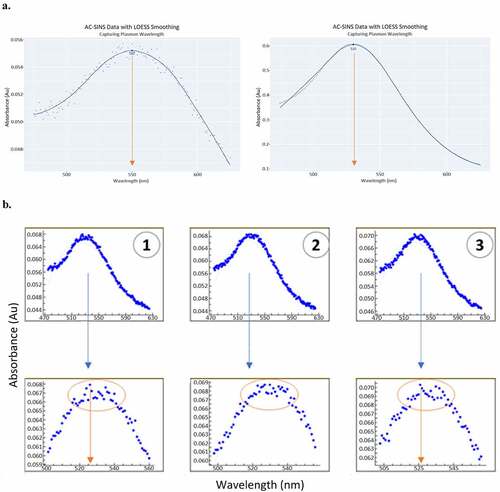
In an initial assessment of the commonly used AC-SINS analysis method, we replicated the process of curve fitting the data in order to check the effectiveness of the approach. We applied multiple curve fits to scatterplots of AC-SINS data across a representative sample of AC-SINS datasets and an array of polynomial functions of various degrees (Supplemental Figure 1). A comprehensive round of curve fitting led us to note excessive variation in reliability from dataset to dataset. A consequential portion of the curve fit applications misfit the data, inaccurately characterizing the data region around the peak. The most successful curve fit applications were those of the fifth- and sixth-degree polynomial functions, with their curve shape closest to that of the data. However, they indicated plasmon wavelength values that were several nanometers different than the more obvious value upon visual inspection. After replicating the previous AC-SINS analysis method with curve fitting and addressing its deficiencies, we concluded that curve fitting would not be an appropriate approach to obtaining plasmon wavelength values. To address the inaccuracies in the resulting plasmon wavelength extrapolation in the previously used analysis approach, we began exploring alternatives to conducting AC-SINS analysis.
At a pivotal juncture in method exploration, it became evident that AC-SINS analysis requires a description of the data. The ability to describe the data on a case-by-case basis would eliminate the conundrum of trying to find a mathematical function that would fit all cases of AC-SINS data. We focused on the fact that the plotted data always had only one global maximum, and we were interested in identifying the wavelength at the peak of the data after the removal of outlying points. The LOESS method was proposed as a candidate during our search for an approach that would meet this analytical need. LOESS (also associated with the term “local regression”) is a non-parametric method that involves fitting a scatterplot in data subsets using multiple regression models in a k-nearest-neighbor-based meta-model.Citation21 As opposed to a parametric fit, the LOESS curve is “obtained empirically rather than through stringent prior specifications about the nature of any structure that might exist within the data.”Citation22 For each local datapoint and its specified neighborhood, a separate regression is applied iteratively for each region. We found that by smoothing the data, we could remove noise around the peak and capture a reliable plasmon wavelength estimation, meeting the needs of AC-SINS analysis. In applying LOESS, a set of y-values are generated from the smoothing algorithm that corresponds to each nanometer value. In the workflow, once the smoothed absorbance values are generated by the algorithm, we select the maximum value. The associated nanometer reading (x–value) at that maximum (y-value) is the resulting plasmon wavelength estimation. A standard example of LOESS applied to a scatterplot of optimal and suboptimal AC-SINS data is shown in . A smooth curve is drawn through the data points regardless of the global trend and is not biased by outlying values near the peak.
The programming language R is a highly useful data science tool with an open-source format and a trove of libraries for statistical computing. We used a package called “LOESS” from the R Stats Package, which has the functionality of applying LOESS modeling to numerical vectors and producing new predicted values. This is highly pertinent for our goal to describe the AC-SINS data plot and find the peak, as the function performs local regression fitting for each absorbance value, producing a vector of “smoothed” y-values from which we can extract a plasmon wavelength result.
The three most influential parameters to be adjusted in the “LOESS” function application are: 1) smoothing span, also known as bandwidth; 2) the degree of polynomial for local fit; and 3) a weight function. The smoothing span determines how much of the data is used to fit each polynomial, i.e., the size of the neighborhood around each target point. Increasing the smoothing percentage increases the smoothing effect for the whole plot. The polynomial degree parameter can take on a value of 0, 1, or 2, respectively, corresponding to whether the local fit should be constant, linear, or quadratic. Finally, the weight function assigns weights to points based on their distance to the point of estimation; in other words, it dictates how strongly influenced the smoothed value is by its distance to the point of estimation.
In order to determine the smoothing span to apply in the LOESS function, we compared the performance of smoothing spans from 10% to 90%, applied to both optimal and suboptimal data. Optimal data included examples in which the absorbance varied minimally around the peak region, whereas suboptimal data included examples in which the absorbance varied significantly around the peak. In our initial exploration of LOESS performance, we found that a useful indicator to monitor was whether the LOESS-smoothed vector contained an inflection point near the peak. If an inflection point appeared around the absorbance peak area, we interpreted it as an indication that the LOESS curve was being influenced by an outlying value, and that the smoothing span was insufficient for an accurate plasmon wavelength estimation. If the LOESS curve appeared to disregard outlying points, we considered the smoothing span to be more appropriate. Supplemental Figure 2A demonstrates the difference in LOESS curves across nine different smoothing span values, applied to an example of AC-SINS data.
After an overview of the full range of smoothing span values across multiple datasets, we decided that we needed a statistical justification to pinpoint a smoothing span value between 40% and 60%, as the performance of these models appear highly comparable across the varied datasets. Overwhelmingly, the plasmon wavelength estimation was the same across these three smoothing span values. The data indicates the average difference in plasmon wavelength output across the entire data set, comparing 40% to 50% as well as 50% to 60%, for both optimal and suboptimal data (Supplemental Figure 2B). For AC-SINS analysis, we ultimately selected a smoothing span of 50% as the middle ground of the comparable smoothing span value range. We decided that a smoothing span of 50% was the safest and most reliable choice to apply across all scatter plot instances, as it has produced satisfactory performance across all data output that we have encountered thus far, after both quantitative and visual investigation.
The next important parameter to consider is the degree of polynomial used for each local fitting. By default, the LOESS function applies a quadratic polynomial within each neighborhood. Degrees 0 and 1 were obvious to eliminate as the subsets of data are neither constant nor linear. As the data takes on a somewhat Gaussian form, a quadratic polynomial appeared to be the best selection for our purposes.
The final parameter of the three important ones mentioned is the weight function. The integration of weights acts as a method of assigning more importance to points closer to the target. As noted by Cleveland and Loader,Citation23 “ … [the] weight function, w(u), that gives greater weight to the [data points] in the neighborhood that are close to [the target point] and lesser weight to those that are further”. We found that the LOESS function performed well without a need to specify starting weights, as the model adapted successfully to the data. The “LOESS” package in R includes a feature that allows the user to modify the fitting method as Ga ussian or Symmetric. The Gaussian method is the default for the function, utilizing least squares regression, which minimizes the sum of squared distances between the fitted LOESS value and the raw absorbance value in the neighborhood. The Symmetric method uses a re-descending M estimator with Tukey’s bi-weight function, which assigns weights valuing from 0 to 1 based on central tendency toward the estimation point. We conducted a comparison between Gaussian and Symmetric fits for the data, and Gaussian had superior performance – oftentimes, the Symmetric fit would not actually generate a LOESS curve that ran through the peak region of the scatter plot.
Streamlined data capture and report by R/Shiny application
After developing a new analytical approach to the AC-SINS method, we planned the implementation of a streamlined analysis workflow. We developed an R/Shiny application that would automate the AC-SINS analysis process, as well as provide a convenient interface for scientists. The application includes several useful features. Upon uploading a raw AC-SINS data file (i.e., the output derived from the plate reader) and corresponding sample name data, the user can view an array of tables and plots that provide insight on important outcomes. After an initial view of the uploaded raw data and verification that it is correct, the user can view the first summary table, which is in 384-well format, modeled after a plate in the context of the experiment. The 384-well summary table contains the sample, buffer, and control information, the plasmon wavelength peak determined by our implementation of the LOESS method, and additional information such as standard error and minimum and maximum absorbance values. The next table is the summary table in 96-well plate format, which combines the results from the quadruplicate wells corresponding to the same sample (). This allows the user to view the averaged plasmon wavelength value across four wells, the standard deviation of that value, and the individual readings for comparison. The user can also view the average plasmon wavelength values for the buffers and controls in the data. The 96-well view allows the user to see how the individual absorbance readings vary for a given sample. In addition, an interactive view of the table allows the user to set a threshold value for the number of standard deviations away from the average plasmon wavelength. This helps to systematically remove outliers from the results, giving the user a more concise view of the data. Additionally, if the user wants to manually select wells to exclude from analysis, this can be done in the summary table view. The user can select any rows in the table to be excluded and execute the exclusion command with an action button on the left-side panel. Those wells will not be used in the result calculations. If the user makes a mistake in excluding wells, the action can be reversed. The application also contains a table that orders all wells by one of two “goodness-of-fit” parameters (discussed below). This table provides a quick view of the most problematic data from the experiment and helps to identify any experimental data that need to be more closely examined.
Figure 5. R/Shiny app overview and features: bulk raw data upload, followed by guided, step-wise data processing, and customizable data output and report generation.(a) A screenshot of one of the many views on the R/Shiny app, the 96-well tab. The upper left of the screen shows blue lines for both raw data and sample name file upload. A text box below it reads “Bulk upload of raw data files.” Below that are different pull-down menus and a text box over those menu options read “Analyze user specified samples or conditions by curve overlay.” The right side of the screen shows views under one of the tabs, with a table of control data on top as well as a table of sample data with conditional formatting of delta pwl results. Text boxes on the right side of the screen indicate that results are from 384 to 96 well data aggregation, with a dashboard showing results of buffer blanks and controls, details of processed data with custom color schema. (b) A graph on the left shows an overlay of 5 peaks of different colors. The legend is too small to discern details. A text box reads “Select, toggle and visualize the shape of the pwl curve, peak and overall profile for comparison.” The screenshot on the right shows a detailed table of sample results on the R/Shiny app, under the 384-well tab. Three sample rows are highlighted in blue. The text box reads “Toggle between viewing options, either the detail zoom-in or for summary report. (c) A Screenshot of a view on the R/Shiny app. On the top left is a sliding scale for the analyst to tailor the results based upon the desired number of standard deviations away from the average pwl. The table shows rows of different samples and controls and details for each of those samples, such as sample name, buffer name, plasmon wavelength, standard deviation, well IDs and their corresponding pwl. The text box reads “Structured data capture allowing for data query, data aggregation and data mining.
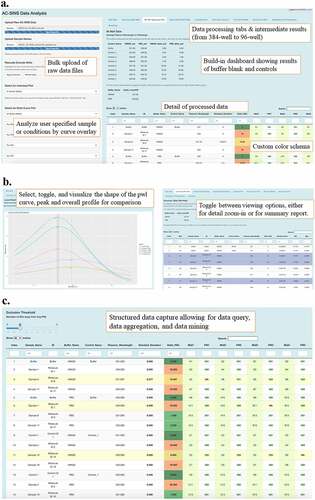
The application also has several visualization features (). First, there is a plot view for individual wells from the 384-well plate, which gives a detailed perspective of the data points and plasmon wavelength outcome for an absorbance reading for a single sample. The user can select the sample name and buffer name combination from a drop-down menu to view this individual plot. Next, the user can view two different plot grids, each showing the top eight plots of concern based on two parameters. One plot grid contains the top eight plots of concern based on the root mean squared error (RMSE), which gives us a measure of the noisiness of the data. That is, it tells us how much the error (i.e., the distance from raw datapoint to smoothed LOESS curve) varies. The formula for RMSE is the following:
The other plot grid contains the top eight plots of concern based on the “percent in range” goodness-of-fit parameter, which is calculated by taking the RMSE of the LOESS model and doubling it, then assessing what proportion of points in the plot fall within that distance from the LOESS curve. This number reflects how reliable the LOESS model is for a given plot, and functions as a pseudo-confidence-interval assessment. If it is a good “curve fit,” 90% of the data points should fall within 2 RMSE measurements (one RMSE distance in each direction from the curve). The final visualization feature available in the application is a multi-curve plot, which allows the user to combine up to eight LOESS smoothed curves in a single plot, each with a different sample-buffer combination (). Each LOESS curve and plotted plasmon wavelength value take on a different color, and the user can choose to activate a feature in which vertical lines intersect the plasmon wavelength value for each LOESS line. This is useful for comparison of plasmon wavelength outcomes, as well as visual assessment of data shape.
Discussion
AC-SINS presents a promising screening assay for colloidal, high-concentration behavior of mAbs by monitoring antibody self-association propensity at diluted concentrations. However, we and other scientists have recognized the necessity of screening self-association behavior in matching and relevant formulation conditions. Thus, it is invaluable to obtain AC-SINS data in multiple relevant formulation buffers for profiling and for proper assessment at the earlier stage of mAb discovery.
Here, we presented PS-SINS, which is an optimized AC-SINS method that enabled profiling of mAbs in several formulation conditions, including the previously unfeasible histidine formulation. The PS-SINS workflow is robust and high-throughput friendly, from process to data capture. Our experience suggests that the PS-SINS profiling data (beyond the single PBS condition) provide richer and more valuable information for early-stage antibody triaging.
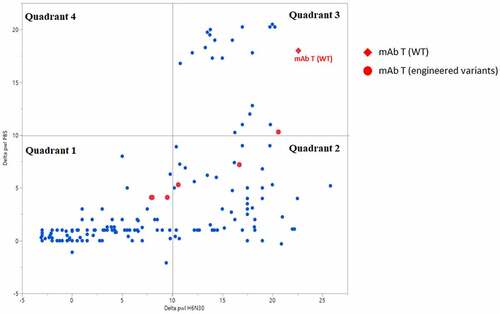
We investigated the relationship of PS-SINS results in two formulation conditions (PBS vs H630N), obtained from a collection of diverse molecules (189 mAbs), shown by scatterplot (). PBS represents physiological conditions and has implications in monitoring nonspecific binding and undesirable faster clearance. Histidine buffer with low salt is one of the preferred high-concentration formulations for mAbs. Together, they serve as two basic and minimal conditions screened by PS-SINS. The data points loosely clustered into several groups. Quadrant 1 represents molecules with low Dpwl (<10) in both PBS and H6N30 conditions, which we rate as low risk, indicating favorable high-concentration behavior in both formulations. Quadrant 3 includes molecules with high Dpwl (>10) in both PBS and H6N30, which we assign red flags for high risk of nonspecific binding and self-association. Quadrant 2 represents a large population of molecules that have high Dpwl (10 ~25) in H6N30, but low Dpwl (<10) in PBS. Interestingly, there are no data points in quadrant 4 (high Dpwl in PBS, and low Dpwl in H6N30). Applying PS-SINS, we successfully captured the risk presented in quadrant 2 molecules, which otherwise would have been overlooked if solely characterized in PBS. Many quadrant 2 molecules demonstrated high-concentration challenges in histidine formulation when characterized by conventional solubility or viscosity experiments in follow-up studies. Among the dataset, there are a few cases representing original lead molecule (WT) and engineered variants (mutants) targeted for addressing high-concentration risk, where PS-SINS was used as the first-tier screening method. For example, the lead molecule of project mAb T (, red diamond) has high risk assigned (Dpwl >10 at H6N30 and PBS). Conveniently, with minimal material consumption (microgram level), we monitored the variants by PS-SINS (red dots), along with other characterization data to guide the engineering selection. Compared with the original WT lead molecule (in quadrant 3), variants migrated into quadrants 1 and 2, suggesting improved self-association behavior in either PBS or histidine, or both. The final candidate of the mAb T project is selected from quadrant 1, supported by other orthogonal characterizations and desired activities.
Figure 6. PS-SINS data distribution of a collection of mAbs, parsed by formulation condition assayed (H6N30 and PBS). Shown in red are lead molecule of mAb T (WT; red diamond) and its engineered variants (red circles). When the empirical threshold of 10 is applied, the data points are categorized into quadrant 1, 2, 3 and 4. A graph with 4 quadrants. X-axis is Delta pwl H6N30 and Y-axis is Delta pwl PBS. Range is −5 to ~25 on both axes. The legend to the right, in red, is for mAb T (WT) as a red diamond and mAb T (engineered variants) as a red circle. Most of the blue dots are found in quadrants 1 & 2 (lower left & lower right, respectively). The red diamond (WT) is in the upper corner of quadrant 4 (upper right). This quadrant holds delta pwl values > 10 for both H6N30 and PBS conditions. The red circles (engineered variants) are found in the 2 lower quadrants (< 10 delta pwl in PBS) and 1 in the very bottom of the upper right quadrant 3. All red circles are to the left of the red diamond (WT) – lower delta pwl in H6N30.
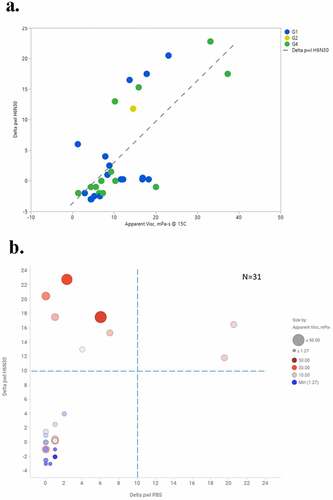
In addition, we performed correlation analysis on PS-SINS with viscosity, where both PS-SINS and viscosity data (125 mg/mL, histidine formulation) were available. As shown in , plotting viscosity against H6N30 (N = 31), we observed a general trend: higher PS-SINS correlated with higher viscosity, with Pearson correlation of 0.70 (R2 of 0.50, RMSE of 5.81). Remarkably, all molecules showing high Dpwl at H6N30 (> 10) have viscosity greater than 10 mPa-s, which is above our targeted viscosity limit. This suggests that PS-SINS can flag concerns (Dpwl ≥10) with high confidence before performing the confirmative yet material-heavy and labor-intensive high-concentration experiments. In this limited dataset, a few molecules have low Dpwl (H6N30) yet high viscosity (15 ~20 mPa-s), which cannot be explained by existing information or knowledge. One possibility is that these molecules are particularly sensitive to salt with respect to their viscosity behavior, and 30 mM NaCl resulted in dramatic reduction of self-association. There is the caveat that H6N30 (contains 30 mM NaCl) results may not be reflective of viscosity measured in histidine formulation with no salt. Moreover, the underlying mechanisms for mAb viscosity likely involve multiple pathways, such as Fab-Fab attractive interaction, Fab-Fc interaction, or a mixture of both.Citation24,Citation25 The current AC-SINS format with anti-Fc capture on beads could restrict the detection of Fc-related self-associations, which may account for the outliers observed in the correlation plot. Granted this is a small dataset, we will continue data aggregation and future data mining to deepen the understanding of high-concentration behavior by further exploring PS-SINS and other techniques.
Figure 7. Correlation analysis of PS-SINS result (H6N30), and viscosity measured in histidine formulation (a). Of the same set of molecules, their PS-SINS data parsed by H6N30 and PBS, and color and sized by viscosity readout. The higher viscosity is indicated by redder and bigger dots. Dpwl (> 10) in both PBS and H6N30 can capture most of the viscosity risks among the set of 31 molecules analyzed, and H6N30 (Y-axis) has more differentiation power compared with PBS (X-axis).(a) A graph showing blue dots and green dots with 1 yellow dot. The legend to the right reads blue dot is G1, yellow dot is G2, green dot is G4 and dashed line is Delta pwl H6N30. X-axis is Apparent Viscosity measured in mPa-s @ 15C, ranging from −10 to 50, from left to right. The Y-axis is Delta pwl H6N30, ranging from −5 to 25 from bottom to top. (b) A graph with 4 quadrants. X-axis is Delta pwl PBS and Y-axis is Delta pwl H6N30. N = 31 is written in the upper right. Legend shows little dots to be a minimum of 1.27 mPa-s and Large dot to be > 50 mPa-s. Lower left quadrant contains small dots, mostly blue and some shades of blue/gray. Lower left quadrant is delta pwl PBS from 0 to 10 and delta pwl H6N30 from −4 to 10. Lower right quadrant is empty. Upper left quadrant contains mostly red dots, some of which are large. Upper left quadrant is delta pwl 0 to 10 in PBS and delta pwl 10 to 24 in H6N30. Upper right quadrant contains 2 pink dots. Upper right quadrant is delta pwl 10–24 in PBS and delta pwl 10–24 in H6N30. All red and pink dots are above the horizontal dashed line at 10 delta pwl H6N30. All blue dots are < 5 delta pwl in both buffers.
Not surprisingly, we observed no correlation between viscosity and PBS results by PS-SINS (R2 = 0.048; data not shown) from the same dataset. The majority of the molecules (29 of 31) show low Dpwl signal in PBS (<10), yet 13 mAbs have viscosity greater than 10 mPa-s. Our data again indicated that PS-SINS in PBS cannot predict viscosity measured in histidine formulation, which is consistent with the previous report.Citation7 Data obtained in PBS are still valuable, suggesting nonspecific binding-related behavior. Taken together, we emphasize the significance of applying PS-SINS for multi-formulation profiling (beyond PBS) during molecule selection. Our data indicate that the PS-SINS method is effective at flagging major concerns (Dpwl>10) albeit with the occasional false negatives (Dpwl<10, yet high viscosity) noted.
Recently, Starr et al. developed a charge-stabilized SINS assay, which used polylysine to overcome the limitation of the conventional assay. Independently, we addressed the instability concern with PEG2000. Both approaches aim to stabilize the antibody-gold conjugates, and each uses different stabilizing tactics. Our method leverages PEG2000, which is an inert, neutral polymer, to block the exposed citrate shell on the surface of antibody-gold conjugates, with the intention of preventing histidine-induced bead aggregation. Starr’s method applies positively charged polymers to increase the overall charge of antibody-gold conjugates for a stabilization effect. The authors also experimented with negatively charged polymers and concluded that this reagent is not successful in yielding accurate measurement. The evidence corroborates the notion that colloidal gold maintains dispersity by the stabilizing, negatively charged citrate shell.Citation20 Hence, neutral blocking by PEG2000 or charge coating by polylysine likely functions similarly in protecting the reactive surface (charge-negative citrate shell) from histidine-induced agglomeration at pH 6.0. The two approaches could be complementary to each other, providing options if one wants to further enhance and expand the utility of AC-SINS. Contrary to the statement by Starr et al., our work suggests that AuNP and gold conjugate instability is pH-dependent and histidine-specific, not a general instability near pH 6.0. We have performed successful experiments with PS-SINS in citrate-based buffer (pH 6.0), as well as acetate-based buffer (pH 5.0), which yield reproducible and meaningful assay readouts, without the need for additional salt, as is currently required for the histidine condition. In addition to viscosity, suboptimal solubility or opalescence represents other concentrated formulation risks. With data available from our PEG-induced solubility screening, we do not observe a consistent correlation between PS-SINS and solubility (data not shown).
A reliable and efficient data processing method is integral to all high-throughput assays. This, however, was absent from traditional AC-SINS, which hindered assay exploration as well as data aggregation. Through iterative design cycles integrating user’s input, we created a robust data processing workflow and user-friendly interface. Several highlights include: 1) a LOESS approach that uniquely captures the nature of AC-SINS data and is more robust, without forcing curve fitting; 2) flexibility and adaptability (e.g., user bulk uploads raw data, records protocols and plate design; 3) auto-processing with multiple quality control matrices to monitor data quality and integrity; and 4) a user-friendly interface allowing curve overlay and various report generation schemas. Having an R/Shiny application that automates the process of analyzing experimental AC-SINS data significantly increases productivity and efficiency. The application automatically identifies the sample data for which the LOESS smoothing application is “poorest,” sorting a selection of well data that the user can inspect. Confirming that the worst of the data is still accurately described by LOESS, the user can feel confident about the systematic implementation of our method in R/Shiny. The R/Shiny application has accelerated our experimental method development and optimization. Additionally, the application conveniently toggles back-and-forth between several views, allowing raw data scrutinization and comparison (curve overlays and zoom-in), as well as providing a clear table summary highlighting the key metrics. Lastly but importantly, the application enabled standardized data capture, which prepared us for data aggregation and future data mining.
Our experience suggests that PS-SINS with a streamlined process supports better informed decision-making at the early stage of mAb discovery. Emphasizing formulation-related properties, we addressed the over-simplification concern (relying on PBS results only), by enabling complementary, high-throughput assessment of several formulations related to high-concentration colloidal stability. In addition to the PEG-induced precipitation assay, which evaluates mAbs in multiple formulation conditions, PS-SINS has become another screening assay capable of profiling mAbs for their projected high-concentration behavior in a variety of formulation conditions, with higher throughput, and low material cost (microgram level). Developability and functional activity may present trade-offs in certain aspects of therapeutic mAb development. It is crucial to take a holistic view and consider other relevant developability assessments and program needs for better decision-making and risk mitigation.
In summary, we present the optimized PS-SINS method and a high-throughput workflow for evaluating mAb colloidal stability in multiple, downstream relevant formulation conditions. The profiling approach provides an additional dimension for facilitating informed decision making. With the publication of the PS-SINS method, we also make the R/shiny application open-source for the broader scientific community to use and for further customization. In preparing for the biopharmaceutical industry’s digital transformation, big data and the age of artificial intelligence, we view this harmonized and standardized data capture as a critical step leading to higher quality data and larger data volumes for future predictive analytics. We hope this benefits more people in their research.
Material and methods
Material and reagents
Gold nanoparticles (20 nm) were purchased from BBI Solutions, product # EM. GC20. Anti-human Fc antibodies were purchased from Jackson ImmunoResearch Laboratories, product # 109–005-008. Buffers were prepared in-house, except for 1x PBS. 20 mM sodium acetate, pH 4.3 was used for the conjugation reaction. 0.25x PBS, prepared from 4x dilution of 1x PBS was used for conjugate elution and concentration. 10 mM histidine, pH 6.0 and 1x PBS were used for final reactions. Thiolated PEG (MW 2000) was purchased from JenKem. Syringes for gold-Ab clean up and concentration are from BD. 0.22 µm PVDF syringe filters are from Millipore, 13 mm and 33 mm. Deep 96-well polypropylene plates for sample preparation and incubation are from Thermo Scientific and 384-well polystyrene plates for final reads are from Greiner. Biomek i7 liquid handler was used for liquid transfer from 96 to 384 well plates. Tecan plate reader (475–625 nm, in increments of 1 nm, 20 flashes) was used for measuring absorbance. Data was analyzed using in-house developed apps. – AC-SINS app (R/Shiny) for analysis, Assay Dev Toolkit (ADT) for plate setup.
PS-SINS
Methods were adapted from previous published protocols.Citation2–4 Briefly, goat anti-human Fc antibodies were buffer exchanged into 20 mM sodium acetate, pH 4.3 using Zeba desalting spin columns and washed 3x. A solution of gold nanoparticles, diluted 2:1 with water, was added to the buffer-exchanged anti-Fc antibodies and allowed to incubate at room temperature for 1 hour. The conjugation was quenched with thiolated PEG2000 and allowed to incubate at room temperature for another hour. The coated nanoparticles were then concentrated using 0.22 µm syringe filters. The gold beads were retained on the filter and were subsequently eluted using 0.25x PBS, pH 7.4, using 1/10th of the original volume, hence making a 10x concentrated bead:Ab solution. A solution of PEG2000 was added to the concentrated gold nanoparticles to a final concentration of 0.2 µg/mL PEG2000.
Test antibodies were diluted to 1 mg/mL in 1x PBS. They were then diluted 4x to 0.25 mg/mL in either 1x PBS or 10 mM histidine, pH 6.0 (H6) buffers. 90 µl of each diluted mAb was added to a separate well on a 96-well plate, twice for each mAb, to be used for PBS or H6 buffers. 90 µl of each buffer was used as a blank. 90 µl of the concentrated gold solution was added to each mAb and buffer-containing well for a solution of 5x bead:anti-Fc conjugate and 0.125 mg/mL test mAb. After 50 minutes at room temperature, 270 µl of buffer was added to each well, respectively, and incubated for an additional 10 minutes at room temperature. The final solution was 50 µg/mL test mAb, 2x bead:anti-Fc conjugate and 0.04 mg/mL PEG2000.
100 µl of each conjugate-mAb solution was then transferred onto a 384-well plate (polystyrene) in quadruplicate using a Biomek liquid handler. The plate was then read in a Tecan plate reader. Absorbance was scanned from 475 to 625 nm in 1 nm increments. The raw data was plugged into the R/Shiny application, along with the plate template (created using an in-house developed app called ADT) to compile the data and apply a color-coded result color scheme. Results were extracted into an Excel format and further organized to present data in a more user-friendly view, as well as uploaded for storage.
Code repository
The code for the AC-SINS Analysis R Shiny Application has been made open-source and is available on GitHub under https://github.com/awalmer/AC-SINS_Analysis.
Viscosity
Viscosity measurements were done in-house using the Rheosense Initium viscometer. mAbs were buffer exchanged into 5 mM histidine, pH 6.0, and then concentrated and normalized to ~125 mg/mL for viscosity measurements at 15°C.
R/Shiny application
The workflow of AC-SINS analysis is as follows. To begin, the user prepares the raw AC-SINS data output from the experiment, as well as a sample name file, which contains sample information in a 384-well format. These two files are then uploaded to the AC-SINS Analysis R/Shiny application, and the application initiates the generation of all tables and visualizations that support the analysis process. The user may then view the resulting plasmon wavelength (as well as additional results) per sample quadruplicate, as determined by the LOESS method described earlier. Upon consideration of the results, plots, and data quality, the user can then optimize and download any visualization, and download conditionally formatted reports from the application to use for his or her presentation purposes, as well as uploading into a database.
Abbreviation
mAb – monoclonal antibody; AC-SINS – affinity-capture self-interaction nanoparticle spectroscopy; PS-SINS – PEG2000-stabilized self-interaction nanoparticle spectroscopy, pwl – plasmon wavelength, Dpwl – plasmon wavelength shift, ave – average, H6N30 – 10 mM histidine buffer, pH 6.0, 30 mM sodium chloride; H6 – 10 mM histidine, pH 6.0; PBS – phosphate-buffered solution, pH 7.4.
Supplemental Material
Download Zip (10.8 MB)Acknowledgments
The authors kindly acknowledge Craig Dickinson and Kristina Coleman for thoughtful discussions and suggestions. Thanks to Bryan Jones for advice and critical review. We also thank the Protein Bioscience group and Lilly Biotechnology Discovery Research for their support on experiments and analyses. We thank Helen Li and Lilly Research Information & Digital Solutions for investing in software package development.
Disclosure statement
No potential conflict of interest was reported by the author(s).
Supplementary material
Supplemental data for this article can be accessed online at https://doi.org/10.1080/19420862.2022.2094750
Additional information
Funding
References
- Shire SJ, Shahrokh Z, Liu J. Challenges in the development of high protein concentration formulations. J Pharm Sci. 2004 Jun;93(6):1390–16. doi:10.1002/jps.20079. PubMed PMID: 15124199.
- Geng SB, Wittekind M, Vigil A, Tessier PM. Measurements of monoclonal antibody self-association are correlated with complex biophysical properties. Mol Pharm. 2016 May 2;13(5):1636–45. doi:10.1021/acs.molpharmaceut.6b00071. PubMed PMID: 27045771.
- Wu J, Schultz JS, Weldon CL, Sule SV, Chai Q, Geng SB, Dickinson CD, Tessier PM. Discovery of highly soluble antibodies prior to purification using affinity-capture self-interaction nanoparticle spectroscopy. Protein Eng Des Sel. 2015 Oct;28(10):403–14. doi:10.1093/protein/gzv045. PubMed PMID: 26363633.
- Liu Y, Caffry I, Wu J, Geng SB, Jain T, Sun T, Reid F, Cao Y, Estep P, Yu Y, et al. High-throughput screening for developability during early-stage antibody discovery using self-interaction nanoparticle spectroscopy. MAbs. 2014 Mar-Apr;6(2):483–92. doi:10.4161/mabs.27431. PubMed PMID: 24492294; PubMed Central PMCID: PMCPMC3984336.
- Sule SV, Dickinson CD, Lu J, Chow CK, Tessier PM. Rapid analysis of antibody self-association in complex mixtures using immunogold conjugates. Mol Pharm. 2013 Apr 1;10(4):1322–31. doi:10.1021/mp300524x. PubMed PMID: 23383873.
- Geng SB, Wu J, Alam ME, Schultz JS, Dickinson CD, Seminer CR, Tessier PM. Facile preparation of stable antibody-gold conjugates and application to affinity-capture self-interaction nanoparticle spectroscopy. Bioconjug Chem. 2016 Oct 19;27(10):2287–300. doi:10.1021/acs.bioconjchem.6b00207. PubMed PMID: 27494306.
- Kingsbury JS, Saini A, Auclair SM, Fu L, Lantz MM, Halloran KT, Calero-Rubio C, Schwenger W, Airiau CY, Zhang J, et al. A single molecular descriptor to predict solution behavior of therapeutic antibodies. Sci Adv. 2020 Aug;6(32):eabb0372. doi:10.1126/sciadv.abb0372. PubMed PMID: 32923611; PubMed Central PMCID: PMCPMC7457339.
- Bailly M, Mieczkowski C, Juan V, Metwally E, Tomazela D, Baker J, Uchida M, Kofman E, Raoufi F, Motlagh S, et al. Predicting antibody developability profiles through early stage discovery screening. MAbs. 2020 Jan-Dec;12(1):1743053. doi:10.1080/19420862.2020.1743053. PubMed PMID: 32249670; PubMed Central PMCID: PMCPMC7153844.
- Jain T, Sun T, Durand S, Hall A, Houston NR, Nett JH, Sharkey B, Bobrowicz B, Caffry I, Yu Y, et al. Biophysical properties of the clinical-stage antibody landscape. Proc Natl Acad Sci USA. 2017 Jan 31;114(5):944–49. doi:10.1073/pnas.1616408114. PubMed PMID: 28096333; PubMed Central PMCID: PMCPMC5293111.
- Jones HM, Zhang Z, Jasper P, Luo H, Avery LB, King LE, Neubert H, Barton HA, Betts AM, Webster R. A physiologically-based pharmacokinetic model for the prediction of monoclonal antibody pharmacokinetics from in vitro data. CPT Pharmacometrics Syst Pharmacol. 2019 Oct;8(10):738–47. doi:10.1002/psp4.12461. PubMed PMID: 31464379; PubMed Central PMCID: PMCPMC6813168.
- Avery LB, Wade J, Wang M, Tam A, King A, Piche-Nicholas N, Kavosi MS, Penn S, Cirelli D, Kurz JC, et al. Establishing in vitro in vivo correlations to screen monoclonal antibodies for physicochemical properties related to favorable human pharmacokinetics. MAbs. 2018 Feb/Mar;10(2):244–55. doi:10.1080/19420862.2017.1417718. PubMed PMID: 29271699; PubMed Central PMCID: PMCPMC5825195.
- Kelly RL, Sun T, Jain T, Caffry I, Yu Y, Cao Y, Lynaugh H, Brown M, Vasquez M, Wittrup KD, et al. High throughput cross-interaction measures for human IgG1 antibodies correlate with clearance rates in mice. MAbs. 2015;7(4):770–77. doi:10.1080/19420862.2015.1043503. PubMed PMID: 26047159; PubMed Central PMCID: PMCPMC4622737.
- Mieczkowski C, Cheng A, Fischmann T, Hsieh M, Baker J, Uchida M, Raghunathan G, Strickland C, Fayadat-Dilman L. Characterization and modeling of reversible antibody self-association provide insights into behavior, prediction, and correction. Antibodies (Basel). 2021 Feb 15;10(1). doi:10.3390/antib10010008. PubMed PMID: 33671864; PubMed Central PMCID: PMCPMC7931086.
- Chow CK, Allan BW, Chai Q, Atwell S, Lu J. Therapeutic antibody engineering to improve viscosity and phase separation guided by crystal structure. Mol Pharm. 2016 Mar 7;13(3):915–23. doi:10.1021/acs.molpharmaceut.5b00817. PubMed PMID: 26849155.
- Starr CG, Makowski EK, Wu L, Berg B, Kingsbury JS, Gokarn YR, Tessier PM. Ultradilute measurements of self-association for the identification of antibodies with favorable high-concentration solution properties. Mol Pharm. 2021 Jul 5;18(7):2744–53. doi:10.1021/acs.molpharmaceut.1c00280. PubMed PMID: 34105965.
- Geoghegan JC, Fleming R, Damschroder M, Bishop SM, Sathish HA, Esfandiary R. Mitigation of reversible self-association and viscosity in a human IgG1 monoclonal antibody by rational, structure-guided Fv engineering. MAbs. 2016 Jul;8(5):941–50. doi:10.1080/19420862.2016.1171444. PubMed PMID: 27050875; PubMed Central PMCID: PMCPMC4968137.
- Falconer RJ. Advances in liquid formulations of parenteral therapeutic proteins. Biotechnol Adv. 2019 Nov 15;37(7):107412. doi:10.1016/j.biotechadv.2019.06.011. PubMed PMID: 31254660.
- Chai Q, Shih J, Weldon C, Phan S, Jones BE. Development of a high-throughput solubility screening assay for use in antibody discovery. MAbs. 2019 May/Jun;11(4):747–56. doi:10.1080/19420862.2019.1589851. PubMed PMID: 30913963; PubMed Central PMCID: PMCPMC6601704.
- Nivedhini Iswarya C, Kiruba Daniel SCG, Sivakumar M. Studies on l-histidine capped Ag and Au nanoparticles for dopamine detection. Mater Sci Eng C Mater Biol Appl. 2017 Jun 1;75:393–401. doi:10.1016/j.msec.2016.11.102. PubMed PMID: 28415477.
- Zakaria HM, Shah A, Konieczny M, Hoffmann JA, Nijdam AJ, Reeves ME. Small molecule- and amino acid-induced aggregation of gold nanoparticles. Langmuir. 2013 Jun 25;29(25):7661–73. doi:10.1021/la400582v. PubMed PMID: 23718319.
- Sicotte XB. Locally weighted linear regression (Loess). Data Blog. Data Science, Machine Learning and Statistics, implemented in Python; 2018.
- William GJ. Loess: a nonparametric, graphical tool for depicting relationships between variables. Elect Stud. 2000;19:577–613.
- Cleveland WS, Loader, C. Smoothing by local regression: principles and methods. In: Härdle W, Schimek MG, editors. Statistical theory and computational aspects of smoothing. Heidelberg: Physica-Verlag HD; 1996. p.10–49.
- Heads JT, Lamb R, Kelm S, Adams R, Elliott P, Tyson K, Topia S, West S, Nan R, Turner A, et al. Electrostatic interactions modulate the differential aggregation propensities of IgG1 and IgG4P antibodies and inform charged residue substitutions for improved developability. Protein Eng Des Sel. 2019 Dec 31;32(6):277–88. doi:10.1093/protein/gzz046. PubMed PMID: 31868219; PubMed Central PMCID: PMCPMC7036597.
- Arora J, Hu Y, Esfandiary R, Sathish HA, Bishop SM, Joshi SB, Middaugh CR, Volkin DB, Weis DD. Charge-mediated Fab-Fc interactions in an IgG1 antibody induce reversible self-association, cluster formation, and elevated viscosity. MAbs. 2016 Nov/Dec;8(8):1561–74. doi:10.1080/19420862.2016.1222342. PubMed PMID: 27560842; PubMed Central PMCID: PMCPMC5098451.