
 ?Mathematical formulae have been encoded as MathML and are displayed in this HTML version using MathJax in order to improve their display. Uncheck the box to turn MathJax off. This feature requires Javascript. Click on a formula to zoom.
ABSTRACT
Mass spectrometry (MS) has become an indispensable tool in structural characterization and quality control of monoclonal antibodies (mAbs). Intact-mass analysis is a particularly attractive option that provides a powerful and cost-effective means to not only confirm the structural integrity of the protein, but also probe its interactions with therapeutic targets. To a certain extent, this success can be attributed to relatively modest glycosylation levels exhibited by IgG molecules, which limits their structural heterogeneity and enables straightforward mass measurements at the intact molecule level. The recent surge of interest in expanding the repertoire of mAbs to include other classes of immunoglobulins places a premium on efforts to adapt the IgG-tailored experimental strategies to other classes of antibodies, but their dramatically higher levels of glycosylation may create insurmountable obstacles. The monoclonal murine IgE antibody explored in this work provides a challenging model system, as its glycosylation level exceeds that of conventional IgG mAbs by a factor of nine. The commercial sample, which included various IgE fragments, yields a poorly resolved ionic signal in intact-mass measurements, from which little useful information can be extracted. However, coupling MS measurements with the limited charge reduction of select polycationic species in the gas phase gives rise to well-defined charge ladders, from which both ionic masses and charges can be readily determined. The measurements reveal significant variation of the extent of glycosylation within intact IgE molecules, as well as the presence of low-molecular weight impurities in the commercial IgE sample. Furthermore, incubation of the monoclonal IgE with its antigen (ovalbumin) gives rise to the formation of complexes with varying stoichiometries, which can also be uniquely identified using a combination of native MS, limited charge reduction in the gas phase and data fitting procedures. This work demonstrates that following appropriate modifications, intact-mass analysis measurements can be successfully applied to mAbs beyond the IgG isotype, providing a wealth of information not only on the mass distribution of the intact IgE molecules, but also their large-scale conformational integrity, the integrity of their covalent structure, and their interactions with antigens.
Introduction
Mass spectrometry (MS) has become a standard analytical technique used in the biopharmaceutical field,Citation1 and it has been particularly successful as a tool for comprehensive characterization of the presently dominant class of therapeutic proteins, monoclonal antibodies (mAbs).Citation2 Intact-mass analysis is a type of measurements that continues to enjoy growing popularity in this field due to its ability to address multiple critical quality attributes (CQAs), including the extent of glycosylation,Citation3 charge variant profiling,Citation4 and evaluation of the cytotoxin conjugation.Citation5 When carried out under near-native conditions, intact-mass measurements also enable monitoring of the conformational integrity of stressed mAbsCitation6 and allow immune complexes to be detected and characterized.Citation7 More recently, intact-mass measurements have also been incorporated in pharmacokinetics studies, where they offer a unique advantage of allowing mAb quantitation to be performed in a glycoform- or, more generally, proteoform-specific fashion.Citation8 This success record is predicated, at least to some extent, on the relatively modest level of structural heterogeneity exhibited by mAbs, the vast majority of which are based on the IgG architecture. Indeed, the latter class of antibodies usually display only two glycan chains (one per each heavy chain of the proteinCitation9), and even significant glycan microheterogeneity within such mAbs does not preclude selective detection of individual glycoforms at the whole-protein level as long as they have unique masses.Citation10
Until very recently, all therapeutic mAbs were designed and built using the IgG blueprint,Citation11 but in the past decade there was a growing interest in expanding the repertoire of this class of medicines to include other immunoglobulin isotypes. Initially, this trend was largely stimulated by the progress in tumor immunotherapy and realization that the limitations of the IgG-based approaches can be alleviated to a substantial degree by exploiting anti-tumor antibodies of other isotypes, particularly IgA and IgE, whose action may be orthogonal and highly complementary to that of IgG molecules.Citation12 More recently, the emergence of COVID-19 and the ensuing world-wide healthcare crisis highlighted another therapeutic modality of non-IgG mAbs, such as the virus-neutralizing potential of monoclonal IgA.Citation13 While both IgA and IgE antibodies are actively explored in the field of immuno-oncology as alternatives/complements to IgG, it is the IgE isotype that shows a particular promise vis-à-vis acting synergistically with and enhancing anticancer efficacy of IgG due to their superior tissue residency characteristics, lack of inhibitory Fc receptors and exceptionally high affinity to FcεRI receptors that are abundantly expressed on a range of effector cells present in solid tumor microenvironments.Citation14–16
Currently, there is only one monoclonal IgE in clinical trials,Citation17 but there is little doubt that this class of therapeutic mAbs will expand in the near future. This expansion will undoubtedly place a premium on the ability to characterize such products. Designs for robust and reliable analytical characterization protocols for IgE- and IgA-based mAbs are likely to be derived from the experimental strategies that have already proven highly successful in the analyses of mAbs based on the IgG architecture, such as the intact-mass analysis. However, the unique challenges posed by IgA- and IgE-based mAbs may create obstacles that would prevent straightforward adoption of the IgG-targeting tools. For example, intact-mass analysis frequently fails to generate meaningful data when applied to biopolymers exhibiting extreme degrees of structural heterogeneity, as the broad mass distributions of macromolecular analytes result in a significant overlap of ionic signals representing different charge states, giving rise to convoluted mass spectra with few discernible features. Application of deconvolution routines to such data arrays fails to produce meaningful information,Citation18 necessitating the use of alternative approaches. In some instances the heterogeneity problem may be tackled by performing front-end separation first, then on-line intact-mass analysis with electrospray ionization (ESI) MS using a variety of formats, including reversed-phase,Citation3 size exclusion,Citation19 ion exchangeCitation20 and hydrophilic interactionCitation21 liquid chromatography, as well as electrophoresis.Citation22 However, this approach is insufficient when the biopharmaceutical products exhibit extreme degrees of structural heterogeneity.Citation23 In fact, meaningful characterization of intact heavily glycosylated non-IgG-based antibodies and their complexes is currently possible only when charge detection MS (CDMS)Citation24 is used as a means of measuring the masses of such macromolecular assemblies.Citation25 While CDMS is a powerful technique capable of addressing a range of challenging biological questions,Citation26 it cannot be implemented readily using the majority of commercially available mass spectrometers and requires a dedicated instrument with built-in CDMS functionality. These problems, however, can be frequently circumvented using the experimental tools from the armamentarium of gas-phase ion chemistry,Citation27 such as limited charge reduction (LCR), which can be used both as an alternativeCitation28 and a complementCitation23 to the front-end separations in intact-mass measurements.
In this work, we evaluate the feasibility of using intact-mass measurements to characterize monoclonal IgE from a commercial source. Supplementing intact-mass MS with LCR allows not only the mass distribution of the primary component to be determined, but also the purity of the sample to be assessed, and the conformational integrity of the monoclonal IgE molecules to be evaluated. Furthermore, native MS supplemented with LCR also enables characterization of the antibody/antigen interactions, indicating that this experimental technique will become an indispensable tool at all stages of the development and evaluation of biopharmaceutical products built on the IgE architecture.
Results
Intact-mass analysis of IgE: assessment of purity and conformational integrity
A mass spectrum of the unprocessed commercial monoclonal anti-ovalbumin (OVA) IgE acquired under near-native conditions features a broad and convoluted distribution of ionic signal over a wide m/z range (gray-filled curve in ). This behavior is in stark contrast to monoclonal IgGs, which typically feature well-resolved ion peaks confined to narrow m/z regions in native MS.Citation29 While the ionic signal in the high m/z region (> 6,500) of the mass spectrum shown in appears to be consistent with the notion of IgE molecules assuming a compact fold in solution, the abundant signal in the lower m/z range displays only a few discernible features and cannot be readily interpreted. It may represent lower molecular weight (MW) macromolecular species (including IgE fragments), as well as intact IgE molecules that unfold in solution and, therefore, accumulate a disproportionately higher number of charges in the course of ESI compared to their natively-folded counterparts.Citation30
Figure 1. An ESI mass spectrum of unprocessed monoclonal IgE sample acquired under near-native conditions (gray-filled curve). The charge ladders shown in color represent LCR MS measurements for precursor ions selected at m/z 3640 (maroon), 4200 (blue), 5200 (orange) and 6820 (white). See Supplementary Material for a more detailed view of the data presented in this figure.
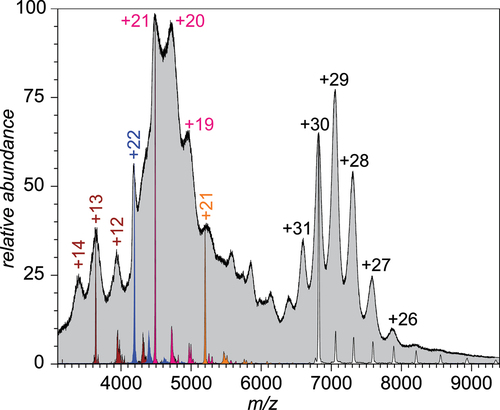
Because of the enormous complexity of the mass spectrum of unprocessed IgE, all attempts to interpret the data using available deconvolution routines failed to produce meaningful information on the ionic species’ mass distribution (see Figure S1 in the Supplementary Material for more detail). Au contraire, application of LCR allows masses to be measured for any ion contributing to the overall signal in the mass spectrum. For example, selecting narrow ionic populations close to the apex of any peak in the distinct signal cluster in the high m/z spectral region followed by their exposure to 1,3-dicyanobenzene anions in the gas phase gives rise to well-defined charge ladders, from which both ionic charges and masses can be readily deduced. This is illustrated in using ions centered around m/z 7060 (shown as a white-filled ladder), which produce an extended ladder that displays losses of up to eight charges with Δz = 1 increments (see also Figure S3 in the Supplementary Material). The masses of ions within this ensemble can be readily calculated as 204,770 ± 405 Da (with the spread reflecting the width of the precursor ion selection window, i.e., Δm = Δ(m/z)precursor·zprecursor). The total mass spread of ions populating the high m/z region can be calculated based on the actual widths of the ionic peaks in MS1, yielding the mass value of 204,770 ± 1,640 Da (half-width at half-maximum). Assuming Gaussian distribution of the ionic signal, masses of 95% of the high m/z ionic species fall within the 204,770 ± 4,230 Da interval. This significant mass spread is indicative of extensive glycosylation of the IgE molecules (vide infra). LCR also allows meaningful mass information to be obtained for macromolecular species giving rise to the ionic signal in the lower m/z region of the mass spectrum presented in . For example, selecting the ionic populations within narrow m/z windows corresponding to the apexes of the poorly resolved spectral features in the 3,500–5,500 m/z range gives rise to well-defined charge ladders, from which the following set of ionic masses can be readily obtained: 47,330 ± 2,960 Da (the corresponding ladder is shown in maroon in ; see Figure S2 in the Supplementary Material for a more detailed explanation), 92,180 ± 1,650 Da (blue), 95,600 ± 6,080 Da (magenta) and 109,470 ± 8,150 Da (orange). In all cases the mass spread is defined as the half-width at half-maximum (HWHM) of the Gaussian approximation of the mass distribution.
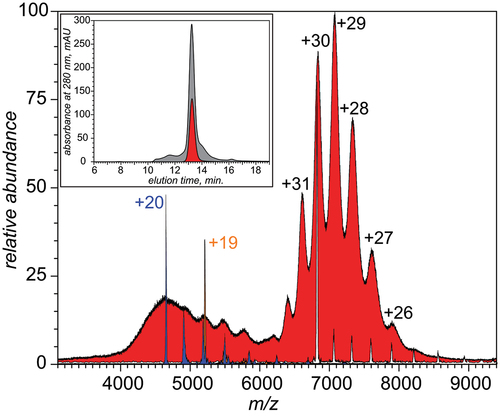
In order to remove the low MW impurities from the commercial sample of monoclonal IgE, it was fractionated by size using size exclusion chromatography (SEC), and the fraction representing the most abundant species (MW ca. 200 kDa based on column calibration) collected and re-analyzed by MS (). The high-m/z part of the mass spectrum of the purified IgE is nearly identical to that of the crude IgE sample, and LCR measurements confirm that the mass of these species is 204,622 ± 450 Da, with the mass spread being indicative of the precursor ion m/z selection window width. At the same time, the entire mass range populated by the high-m/z ions is notably larger, as even the charge ladder produced by reduction of the ionic species at the apex of the intensity distribution contains a minor contribution from a protein species with the mass as low as 197,422 ± 450 Da. Although the high-m/z species are predominant in the mass spectrum of SEC-purified IgE, the lower-m/z region of the spectrum is also populated with the ionic signal. Despite having very few discernible features, it can yield meaningful mass information following application of LCR. The latter reveals the presence of two highly heterogeneous components, one spanning the 78–102 kDa mass range (with 93 kDa being the mass of the most abundant species in this range, see the blue-shaded charge ladder in ) and another populating the 99–120 kDa range (the most abundant mass 109 kDa, orange ladder in and in Figure S4 in the Supplementary Material).
Figure 2. An ESI mass spectrum of SEC-purified monoclonal IgE sample acquired under near-native conditions (red-filled curve). The charge ladders shown in color represent LCR MS measurements for precursor ions selected at m/z 4650 (blue), 5200 (orange) and 6820 (white). The inset shows SEC chromatograms of the unprocessed and purified IgE samples (gray and red, respectively). See Supplementary Material for a more detailed view of the data presented in this figure.
Incubation of the purified monoclonal IgE with its antigen, OVA, results in a noticeable change in both SEC and MS profiles (). Although both the chromatogram and the mass spectrum acquired with sub-stoichiometric amounts of the antigen clearly preserve the features that were present in the absence of OVA, the new features point out at the antibody/antigen association. Indeed, the ionic signal in the native mass spectrum of the 2:1 (mole:mole) IgE/antigen mixture extends to higher m/z, while the SEC elution profile shows strong absorption at an elution time that is noticeably earlier than that of the free IgE molecule (compare the gray and red traces in ). At the same time, no distinct signal of free OVA could be detected in either MS or SEC, suggesting near-complete binding of the antigen to the antibody. Both native MS and SEC profiles of the IgE/antigen mixture continue to evolve upon increasing of the antigen fraction, and eventually a signal of free OVA becomes detectable in both MS and SEC. Importantly, the ionic signal corresponding to the remaining lower MW impurities in the purified IgE sample (m/z 4,500–6,700) does not appear to be affected by the presence of the antigen; this behavior is in contrast to the intact IgE molecules, whose signal is nearly eliminated from the mass spectrum when the relative concentration of OVA becomes sufficiently high.
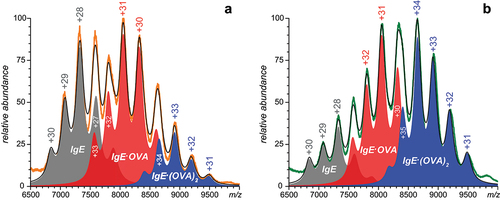
Figure 3. Native ESI mass spectra (a) and SEC chromatograms (b) of monoclonal anti-ovalbumin IgE incubated with ovalbumin at molar ratios 2:1 (red), 1:1 (gold), 2:3 (olive) and 1:2 (violet). The gray and black traces represent free antibody and antigen, respectively.
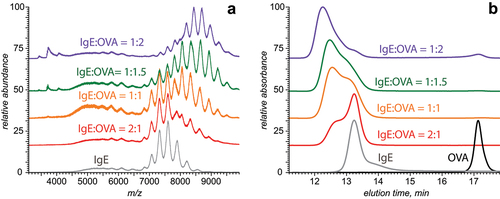
While both native MS and SEC provide clear evidence of the monoclonal IgE/antigen interaction, it is difficult to tease apart contributions of the antibody-antigen complexes with different stoichiometries, as well as the antigen-free IgE. Indeed, the relatively small size of OVA in comparison to the IgE molecules results only in a modest decrease of the SEC elution time for the OVA-bound IgE, and the chromatographic resolution is clearly insufficient for separating free IgE, IgE·OVA and IgE·(OVA)2 species (). The relatively low mass of the antigen is also responsible for the significant overlap of the ionic signal corresponding to two different immune complexes (IgE·OVA and IgE·(OVAdeconv)2), as well as the antigen-free IgE, as is evident in the mass spectra presented in . All attempts to deconvolute the mass spectra presented in using either commercial built-in software or more robust Bayesian algorithmsCitation31 failed to produce meaningful mass distributions (see Supplementary Material for more detail). Once again, this problem was circumvented by applying LCR to ESI-generated ions. For example, selecting narrow populations of ionic species within the apex regions of what appears to be well-defined ion peaks in the mass spectrum of the 1:1.5 IgE:OVA mixture gives rise to two distinct charge ladders ( and Figure S5 in Supplementary Material). Processing these ladders with the UniDEC deconvolution routineCitation31 allows the masses of the two distinct species to be determined as 205 kDa (free IgE) and 250 kDa (IgE·OVA complex). It is clear from examination of these charge ladders that even the seemingly well-defined peaks contain ionic signal contributions from both free IgE and the IgE·OVA complex, and their relative contributions change upon increase of the OVA concentration in solution. This (as well as the inherently broad mass distribution of IgE) gives rise to highly convoluted ionic peak shapes that change following variation of the antibody/antigen molar ratio. The highly complex appearance of the mass spectra makes the straightforward application of standard deconvolution routines meaningless (vide supra).
Figure 4. Charge state assignments of ionic signal in native ESI mass spectra of the IgE/OVA mixtures acquired at 2:3 (a) and 1:2 (b) molar ratios. Charge state assignments were carried out using LCR of ionic populations isolated within narrow m/z windows (see the text for more detail). The peak labels correspond to free IgE (italicized), IgE·OVA (regular font) and IgE·(OVA)2 (bold face). See Supplementary Material for a more detailed view of the data presented in this figure.
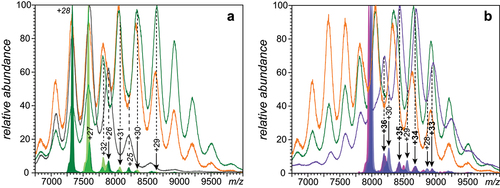
Similar analyses were carried out for the ionic signal populating other regions of the mass spectra up to m/z 8,000 (the hardware limit for precursor ion selectionCitation32), also revealing the contributions of more than just a single species to the ionic current at any given m/z value. For example, LCR measurements carried out on ionic populations selected within narrow m/z windows right below the instrumental limit for the precursor ion selection () clearly indicate the presence of ionic species with masses ranging from 246–248 kDa (assigned as IgE·OVA) and 287–294 kDa (assigned as IgE·(OVA)2). Variation of their relative abundance upon increasing the antigen content in solution, as well as the inherent heterogeneity of IgE, contribute to the evolving shape of the ionic signal at high m/z, giving rise to the apparent shifts of the ionic peak in the mass spectra (see showing the overlaid traces of the ionic signals acquired at different IgE/OVA ratios).
The extensive overlap of the ionic contributions of the free IgE with that of the immune complexes across the entire m/z region of interest revealed by the LCR measurements suggests that it is impossible to determine the relative abundance of the three species (IgE, IgE·OVA and IgE·(OVA)2) using peak heights/areas in the mass spectra of the IgE/OVA mixtures. We approached this task by fitting the raw data with the “pure” ionic contributions of the three individual species generated using the following approach. First, a mass distribution of the IgE molecules DIgE(m) was obtained by finding the best fit for the ionic signal in the m/z range above 6,500 in the mass spectrum of IgE by optimizing the set of signal amplitudes for each charge state Az(IgE) and the shape of the mass distribution function DIgE(m). This was done by finding the Euclidean minimum of the deviation of the calculated IgE signal
from that of the experimentally measured signal (as shown in ). A similar procedure was used to determine the mass distribution of the antigen DOVA(m). Next, the mass distribution of the IgE·OVA complexes was calculated by convoluting DIgE(m) and DOVA(m):
and the mass distribution of the IgE·(OVA)2 complexes was calculated in a similar fashion. The total ionic signal was modeled as
and the charge state amplitudes Az were optimized to obtain best fits of the calculated ionic signal intensity with each mass spectrum shown in . Two representative results (for the 1:1 and 2:3 IgE/OVA mixtures) are shown in .
Figure 5. Fitting the native ESI mass spectra of the IgE/OVA mixtures acquired at 1:1 (a) and 2:3 (b) molar ratios with calculated ionic signals for the IgE·(OVA)2 (blue) and IgE·OVA (red) complexes, and the antigen-free antibody (gray).
Consistent with the expectations, the relative contributions of the three species to the overall ionic signal at m/z > 6,500 in the mass spectra of the IgE/OVA mixtures change in concert with the decreasing antibody/antigen molar ratio in solution (). Although the relative abundance of the ionic signal in ESI MS depends on a variety of factors in addition to the fractional concentration of the analyte in solution,Citation33 the latter certainly correlates strongly with the signal intensity.Citation34 The relative abundance of the three high MW species (IgE, IgE·OVA and IgE·(OVA)2) whose presence is revealed by native MS was also extracted from the SEC profiles of the IgE/OVA mixtures across the range of the antibody/antigen ratios. These two sets (derived from native MS and SEC) cannot be compared directly, since one of them (native MS) correlates with molar concentrations, while the UV absorbance (used to quantitate proteins in SEC) correlates with the weight concentrations.Citation34 Although the absence of the precise amino acid sequence information (and, therefore, the exact number of aromatic residues contributing to the absorption at 280 nm) within the antibody does not allow the two data sets to be compared in a straightforward fashion, molar absorptivities of IgE·OVA and IgE·(OVA)2 can be estimated simply by summing the molar absorptivities of the constituents of these complexes. This allows the SEC-derived abundance of IgE, IgE·OVA and IgE·(OVA)2 to be converted to the molar concentration format and compared directly to the native MS-derived data.
Figure 6. Relative abundance of IgE and its complexes with the antigen (OVA) in solutions with varying IgE/OVA ratios derived from SEC (top) and native ESI MS (bottom).
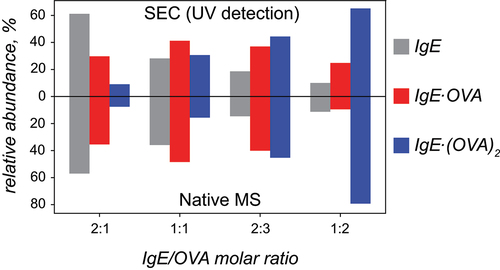
The analysis of both SEC and native MS data reveals similar trends vis-à-vis evolution of molar abundances of IgE, IgE·OVA and IgE·(OVA)2. As expected, the abundance of the antigen-free antibody decreases upon the increase of OVA concentration, while the relative abundance of IgE·(OVA)2 monotonously increases. The abundance of IgE·OVA reaches its maximum in the 1:1 antibody/antigen mixture, followed by its decrease in higher-stoichiometry mixtures. Overall, there is a remarkable agreement between the SEC and ESI MS-derived datasets shown in , suggesting that the quantitative information on IgE and its complexes with the antigen provided by native MS is surprisingly accurate (despite common – and justified – reservations related to using ESI MS as a means of quantitationCitation33).
Discussion
The use of intact-mass MS analysis is steadily growing in popularity in the field of biopharmaceutical analysis,Citation35 and its applications have been particularly successful in the realm of mAb structural characterization.Citation36 In our study, this technique was indispensable for determining the average mass of the intact IgE molecules and identifying the range of masses populated by these heterogeneous mAbs. The analyses of both the crude commercial sample and the purified IgE yielded a mass of 204.6 ± 4.2 kDa, with the mass spread being defined as a range harboring 95% of all protein species (vide supra). This number is notably higher than the estimates of the IgE mass provided in the current literature, for example, 190 kDa mentioned by Pomés et al.Citation37 While the exact masses of individual IgE molecules obviously vary depending on the composition of the variable regions and the extent of glycosylation, the commonly used estimates take into account the presence of an “extra” domain within the heavy chain of the antibody (compared to the G-isotype), bringing the total number of domains within the dimeric form of the protein to 14 (and the total polypeptide chain mass to ca. 170 kDa). This number is very close to the polypeptide mass that is estimated by using the amino acid sequence of the constant region of the mouse IgE heavy chains, domains CεH1-CεH4 (P06336, 60,990 Da) with the VH domain mass estimated using the so-called “averagine” massCitation38 for the 123 residues (13,669 Da) at the N-terminus of the heavy chain and adopting the average mass of the light chains of the κ-type (23,373 DaCitation39) as an estimate for the IgE light chain mass. This allows the glycan-free mass of the IgE molecule to be estimated as 168.7 kDa. The IgE extent of glycosylation is high (compared with IgG molecules), with seven N-glycosylation sites located within a single heavy chain of human IgE (of which only six are usually occupiedCitation9), and two additional N-glycosylation sites per each heavy chain of the mouse IgE (located within the Cε4 domain, which is glycan-free in human IgE molecules).Citation40 Although each glycosylation site displays notable micro-heterogeneity vis-à-vis glycan composition, eight of nine sites feature predominantly complex-type biantennary glycans HexNAc6Hex4Fuc1, and one is predominantly a high-mannose type chain HexNAc2Hex5.Citation40 The cumulative mass of these nine glycans is 17,319 Da, corresponding to a total carbohydrate mass of IgE upwards of 34.6 kDa and bringing the total IgE mass average to 203.4 kDa, a number that is remarkably close to the average intact protein mass we measured by native MS supplemented with LCR. Importantly, native MS also reveals a remarkable width of the mass range populated by the intact IgE molecules (spanning a range of ca. 8 kDa). While this range may seem unreasonably extensive, an estimate of the total span of the IgE glycan mass distribution based on the recent study by Shade et al., who documented the entire complement of glycans within a mouse IgE molecule,Citation40 results in a comparable, but somewhat smaller number, 5 kDa (see Figure S6 in the Supplementary Material for more detail).
Although intact mass analysis can be carried out under denaturing conditions, maintaining near-native conditions in solution during the MS analyses provides additional benefits, such as the reduced spectral crowding (for the ionic signal at lower charge states z) and the possibility to assess the conformational integrity of the macromolecules.Citation41 The drawbacks of denaturing ESI-based MS may be overcome in some instances by the application of the gas-phase charge reduction tools,Citation42 but it cannot be used for structural characterization of complex protein therapeutics comprising multiple subunits that are assembled together by non-covalent interactions, for which naive MS readily provides information on the composition and stoichiometry of the non-covalent complexes.Citation43 However, even single-polypeptide chain biotherapeutics, as well as multi-unit proteins comprising several distinct polypeptide chains that are covalently linked to each other via disulfide bonds benefit from native MS analysis, as it allows the protein compactness in solution to be evaluated by monitoring the shapes of the protein ion charge state distributions in the mass spectra.Citation30 Protein compactness in solution is directly related to the integrity of its higher order structure,Citation44 an important CQA for all protein therapeutics, including mAbs.Citation35 While this approach is relatively straightforward when applied to proteins exhibiting modest levels of heterogeneity (such as mAbs of the G isotype), extracting meaningful information from native MS data for highly heterogeneous systems could be challenging. Indeed, the ionic signal representing the putative partially unfolded macromolecules populates the lower m/z region of the mass spectrum (compared to their natively folded – and therefore compact – counterparts), where it may overlap with the signal representing macromolecular fragments (or other possible degradation products). The distinction between the misfolded states of the intact macromolecules and their fragments can be difficult/impossible to make when relying only on traditional MS tools, as was the case in the recently reported analysis of a stressed synthetic vaccine (a heavily haptenated immunogenic carrier protein – detoxified diphtheria toxin, CRM197).Citation18 The mass spectrum of the crude IgE sample () also displays an abundant signal in the lower m/z region (< 6,000), and even though some spectral features clearly indicate the presence of the low MW impurities (e.g., based on the spacing between the peaks in the m/z region 3,000–4,000), the presence of the partially unfolded IgE molecules (which would be represented by protein ions with high z values) cannot be ruled out either. It is the LCR measurements that provide unequivocal evidence that in this particular case the entire ionic signal at low m/z values represents low MW impurities, without any contribution from the unfolded states of the intact IgE molecules. Since the intact-mass MS measurements do not provide any structural information, it is not possible to identify these impurities based solely on the measurements presented in this work. It is not unreasonable to assume that these impurities are in fact various fragments of the IgE heavy chain. For example, a putative polypeptide spanning domains HCε2 through HCε4 should have a mass of ca.75 kDa; accounting for glycosylation and further fragmentation may cover the entire range of masses populated by the impurities. However, elucidation of the exact nature and structure of these impurities will require orthogonal methods of analysis and is beyond the scope of this work.
Above and beyond facilitating intact-mass analysis of the monoclonal IgE and impurities, LCR readily enables meaningful interpretation of native MS studies targeting interaction of this antibody with its antigen (). Native MS has been steadily gaining popularity in many areas of macromolecular assembly analysis,Citation41 including studies of antibody/antigen interactionsCitation7,Citation45,Citation46 (although all such studies were focused on antigen binding by IgG molecules or their fragments). Antibodies of other isotypes exhibit notably higher levels of glycosylation, making applications of native MS to such systems extremely challenging. The approach presented here allows common MS instrumentation to be used for detection and characterization of intact the IgE/antigen complexes despite their high mass and the extreme degree of structural heterogeneity exhibited by the antibody (with the total carbohydrate content accounting for ca. 17% of the protein mass). The ability to observe and quantify intact immune complexes formed by IgE antibodies provides an important dimension in their characterization, which is complementary to the local structural information that can be obtained by fragmenting highly heterogeneous antibodies in solutionCitation47,Citation48 or in the gas phase.Citation49,Citation50 Until recently, electron microscopy remained the only means of direct detection and stoichiometry analysis for intact complexes containing IgE molecules,Citation51 but the data interpretation (based on the negative stain image analysis) was not straightforward.
As used here, native MS supplemented with LCR allows unequivocal stoichiometry assignment for IgE/antigen complexes to be made and their fractional concentrations to be evaluated even when complexes with a range of different stoichiometries are present in solution (). This feature will be indispensable for native MS studies that aim at obtaining affinity information on IgE interactions with its physiological partners using either ligand titration methodsCitation46 or ligand competition/displacement assaysCitation52 previously applied to smaller and less heterogeneous proteins. Above and beyond its utility for characterization of therapeutic monoclonal IgE interactions with its physiological targets/antigens, native MS supplemented with LCR opens a host of exciting opportunities in the studies of anti-IgE biotherapeutics,Citation53 where IgE mAbs are used as model targets. Lastly, even though the MWs of the IgE/antigen complexes examined in this work were relatively modest (below 300 kDa), the ability of native MS and LCR to extract meaningful information on much larger macromolecular assemblies has been also demonstrated.Citation43,Citation54 This indicates the approach presented here should be applicable to the studies of large immune complexes with multiple IgE molecules tethered to a large polyvalent antigen, the triggers of the allergic and anaphylactic reactions.
Materials and Methods
Materials and sample preparation
Mouse monoclonal anti-OVA IgE PMP68 was purchased from Bio-Rad (Hercules, CA), and used with and without SEC purification using an XBridge Protein BEH200 (Waters Corp., Milford, MA) column. OVA was extracted from chicken egg white using a procedure described in detail elsewhere.Citation55 All protein solutions for MS analysis were prepared in 150 mM ammonium acetate, pH 7. All solvents and chemicals in this work were of analytical grade or higher.
Mass Spectrometry
All MS measurements were carried out with a Synapt G2Si (Waters Corp., Milford, MA) hybrid quadrupole/time-of-flight mass spectrometer equipped with a nanospray ionization source. The following set of parameters was used in the ESI interface region: capillary voltage, 1.6 kV; sampling cone voltage, 5 V; source offset, 80 V; trap CE, 4 V; trap DC bias, 3 V; and transfer CE, 0 V. Isolation of ionic populations in the trap cell for subsequent LCR measurements was performed by setting the quadrupole LM resolution values in the range of 4.0–4.5. Charge reduction of the selected polycationic ions was triggered by introducing 1,3-dicyanobenzene anions after setting the trap wave height to 0.2 V and optimizing the discharge current. The initial processing of MS data was carried out using the built-in MassLynx software, followed by additional processing using the Anaconda distribution of Python 3. Convolution of mass distributions was performed using a Fast Fourier transform-based algorithm implemented in SciPy library tools. Fitting of the raw signals in native MS data and SEC was done using Levenberg-Marquardt algorithm.
Abbreviations
CQA, critical quality attribute; ESI, electrospray ionization; LC, liquid chromatography; LCR, limited charge reduction; MS, mass spectrometry; MW, molecular weight; OVA, ovalbumin; SEC, size-exclusion chromatography.
Authors’ contributions
WY prepared the samples, carried out MS measurements and interpreted the data; DI developed the data processing algorithms and interpreted the data; IK designed the study, interpreted the data and wrote the manuscript. All authors participated in editing the manuscript and have given their consent to its final (submitted) version.
Supplemental Material
Download MS Word (656.1 KB)Acknowledgments
This work was supported by grants R01 GM132673 from the National Institutes of Health and CHE-1709552 from the National Science Foundation. All MS measurements were carried out in the Mass Spectrometry Core facility at UMass-Amherst (RRID:SCR_019063).
Disclosure statement
No potential conflict of interest was reported by the author(s).
Supplementary material
Supplemental data for this article can be accessed online at https://doi.org/10.1080/19420862.2022.2103906
Correction Statement
This article has been corrected with minor changes. These changes do not impact the academic content of the article.
Additional information
Funding
References
- Kaltashov IA, Bobst CE, Abzalimov RR, Wang G, Baykal B, Wang S. Advances and challenges in analytical characterization of biotechnology products: mass spectrometry-based approaches to study properties and behavior of protein therapeutics. Biotechnol Adv. 2012;30:210–10. doi:10.1016/j.biotechadv.2011.05.006
- Jin Y, Lin Z, Xu Q, Fu C, Zhang Z, Zhang Q, Pritts WA, Ge Y. Comprehensive characterization of monoclonal antibody by Fourier transform ion cyclotron resonance mass spectrometry. MAbs. 2019;11:106–15. doi:10.1080/19420862.2018.1525253
- Dillon TM, Bondarenko PV, Rehder DS, Pipes GD, Kleemann GR, Ricci MS. Optimization of a reversed-phase high-performance liquid chromatography/mass spectrometry method for characterizing recombinant antibody heterogeneity and stability. J Chromatogr A. 2006;1120:112–20. doi:10.1016/j.chroma.2006.01.016
- Bailey AO, Han G, Phung W, Gazis P, Sutton J, Josephs JL, Sandoval W. Charge variant native mass spectrometry benefits mass precision and dynamic range of monoclonal antibody intact mass analysis. MAbs. 2018;10:1214–25. doi:10.1080/19420862.2018.1521131
- Valliere-Douglass JF, McFee WA, Salas-Solano O. Native intact mass determination of antibodies conjugated with monomethyl auristatin E and F at interchain cysteine residues. Anal Chem. 2012;84:2843–49. doi:10.1021/ac203346c
- Wang G, Bondarenko PV, Kaltashov IA. Multi-step conformational transitions in heat-treated protein therapeutics can be monitored in real time with temperature-controlled electrospray ionization mass spectrometry. Analyst. 2018;143:670–77. doi:10.1039/C7AN01655G
- Atmanene C, Wagner-Rousset E, Malissard M, Chol B, Robert A, Corvaia N, Dorsselaer AV, Beck A, Sanglier-Cianférani S. Extending mass spectrometry contribution to therapeutic monoclonal antibody lead optimization: characterization of immune complexes using noncovalent ESI-MS. Anal Chem. 2009;81:6364–73. doi:10.1021/ac9007557
- Jian W, Kang L, Burton L, Weng N. A workflow for absolute quantitation of large therapeutic proteins in biological samples at intact level using LC-HRMS. Bioanalysis. 2016;8:1679–91. doi:10.4155/bio-2016-0096
- Arnold JN, Wormald MR, Sim RB, Rudd PM, Dwek RA. The impact of glycosylation on the biological function and structure of human immunoglobulins. Annu Rev Immunol. 2007;25:21–50. doi:10.1146/annurev.immunol.25.022106.141702
- Pawlowski JW, Bajardi-Taccioli A, Houde D, Feschenko M, Carlage T, Kaltashov IA. Influence of glycan modification on IgG1 biochemical and biophysical properties. J Pharm Biomed Anal. 2018;151:133–44. doi:10.1016/j.jpba.2017.12.061
- Kang SH, Lee CH. Development of therapeutic antibodies and modulating the characteristics of therapeutic antibodies to maximize the therapeutic efficacy. Biotechnol Bioprocess Eng. 2021;2021:1–17.
- Kretschmer A, Schwanbeck R, Valerius T, Rösner T. Antibody isotypes for tumor immunotherapy. Transfus Med Hemother. 2017;44:320–26. doi:10.1159/000479240
- Ejemel M, Li Q, Hou S, Schiller ZA, Tree JA, Wallace A, Amcheslavsky A, Kurt Yilmaz N, Buttigieg KR, Elmore MJ, et al. A cross-reactive human IgA monoclonal antibody blocks SARS-CoV-2 spike-ACE2 interaction. Nat Commun. 2020;11:4198. doi:10.1038/s41467-020-18058-8
- Josephs DH, Spicer JF, Karagiannis P, Gould HJ, Karagiannis SN. IgE immunotherapy: a novel concept with promise for the treatment of cancer. MAbs. 2014;6:54–72. doi:10.4161/mabs.27029
- Chauhan J, McCraw AJ, Nakamura M, Osborn G, Sow HS, Cox VF, Stavraka C, Josephs DH, Spicer JF, Karagiannis SN, et al. IgE antibodies against cancer: efficacy and safety. Antibodies. 2020;9. doi:10.3390/antib9040055
- Fazekas-Singer J, Singer J, Jensen-Jarolim E. Precision medicine in clinical oncology: the journey from IgG antibody to IgE. Curr Opin Allergy Clin Immunol. 2020;20:282–89. doi:10.1097/ACI.0000000000000637
- Sutton BJ, Davies AM, Bax HJ, Karagiannis SN. IgE antibodies: from structure to function and clinical translation. Antibodies. 2019;8:41. doi:10.3390/antib8010019
- Bobst CE, Sperry J, Friese OV, Kaltashov IA. Simultaneous evaluation of a vaccine component microheterogeneity and conformational integrity using native mass spectrometry and limited charge reduction. J Am Soc Mass Spectrom. 2021;32:1631–37. doi:10.1021/jasms.1c00091
- Muneeruddin K, Thomas JJ, Salinas PA, Kaltashov IA. Characterization of small protein aggregates and oligomers using size exclusion chromatography with on-line detection by native electrospray ionization mass spectrometry. Anal Chem. 2014;86:10692–99. doi:10.1021/ac502590h
- Muneeruddin K, Nazzaro M, Kaltashov IA. Characterization of intact protein conjugates and biopharmaceuticals using ion-exchange chromatography with online detection by native electrospray ionization mass spectrometry and top-down tandem mass spectrometry. Anal Chem. 2015;87:10138–45. doi:10.1021/acs.analchem.5b02982
- Domínguez-Vega E, Tengattini S, Peintner C, van Angeren J, Temporini C, Haselberg R, Massolini G, Somsen GW. High-resolution glycoform profiling of intact therapeutic proteins by hydrophilic interaction chromatography-mass spectrometry. Talanta. 2018;184:375–81. doi:10.1016/j.talanta.2018.03.015
- Belov AM, Viner R, Santos MR, Horn DM, Bern M, Karger BL, Ivanov AR. Analysis of proteins, protein complexes, and organellar proteomes using sheathless capillary zone electrophoresis - native mass spectrometry. J Am Soc Mass Spectrom. 2017;28:2614–34. doi:10.1007/s13361-017-1781-1
- Muneeruddin K, Bobst CE, Frenkel R, Houde D, Turyan I, Sosic Z, Kaltashov, IA. Characterization of a PEGylated protein therapeutic by ion exchange chromatography with on-line detection by native ESI MS and MS/MS. Analyst. 2017;142:336–44. doi:10.1039/C6AN02041K
- Fuerstenau SD, Benner WH. Molecular weight determination of megadalton DNA electrospray ions using charge detection time-of-flight mass spectrometry. Rapid Commun Mass Spectrom. 1995;9:1528–38. doi:10.1002/rcm.1290091513
- den Boer MA, Lai SH, Xue X, van Kampen MD, Bleijlevens B, Heck AJR. Comparative analysis of antibodies and heavily glycosylated macromolecular immune complexes by size-exclusion chromatography multi-angle light scattering, native charge detection mass spectrometry, and mass photometry. Anal Chem. 2022;94:892–900. doi:10.1021/acs.analchem.1c03656
- Jarrold MF. Applications of charge detection mass spectrometry in molecular biology and biotechnology. Chem Rev. 2021;122:7415–41. doi:10.1021/acs.chemrev.1c00377
- Foreman DJ, McLuckey SA. Recent developments in gas-phase ion/ion reactions for analytical mass spectrometry. Anal Chem. 2020;92:252–66. doi:10.1021/acs.analchem.9b05014
- Abzalimov RR, Kaltashov IA. Electrospray ionization mass spectrometry of highly heterogeneous protein systems: protein ion charge state assignment via incomplete charge reduction. Anal Chem. 2010;82:7523–26. doi:10.1021/ac101848z
- Kaltashov IA, Bobst CE, Pawlowski J, Wang G. Mass spectrometry-based methods in characterization of the higher order structure of protein therapeutics. J Pharm Biomed Anal. 2020;184:113169. doi:10.1016/j.jpba.2020.113169
- Kaltashov IA, Abzalimov RR. Do ionic charges in ESI MS provide useful information on macromolecular structure? J Am Soc Mass Spectrom. 2008;19:1239–46. doi:10.1016/j.jasms.2008.05.018
- Marty MT, Baldwin AJ, Marklund EG, Hochberg GK, Benesch JL, Robinson CV. Bayesian deconvolution of mass and ion mobility spectra: from binary interactions to polydisperse ensembles. Anal Chem. 2015;87:4370–76. doi:10.1021/acs.analchem.5b00140
- Dawson P. 1976. Quadrupole mass spectrometry and its applications. Amsterdam: Elsevier Scientific Pub. Co.
- Cech NB, Enke CG. Practical implications of some recent studies in electrospray ionization fundamentals. Mass Spectrom Rev. 2001;20:362–87. doi:10.1002/mas.10008
- Wang G, Johnson AJ, Kaltashov IA. Evaluation of electrospray ionization mass spectrometry as a tool for characterization of small soluble protein aggregates. Anal Chem. 2012;84:1718–24. doi:10.1021/ac203017x
- Kaltashov IA, Wang S, and Wang G. 2021. Mass Spectrometry in Biopharmaceutical Analysis. Berlin, Germany/Boston, MA, USA: De Gruyter. doi:10.1515/9783110546187
- Hernandez-Alba O, Wagner-Rousset E, Beck A, Cianférani S. Native mass spectrometry, ion mobility, and collision-induced unfolding for conformational characterization of igg4 monoclonal antibodies. Anal Chem. 2018;90:8865–72. doi:10.1021/acs.analchem.8b00912
- Pomés A, Mueller GA, Chruszcz M. Structural aspects of the allergen-antibody Interaction. Front Immunol. 2020;11:2067. doi:10.3389/fimmu.2020.02067
- Senko MW, Beu SC, McLafferty FW. Determination of monoisotopic masses and ion populations for large biomolecules from resolved isotopic distributions. J Am Soc Mass Spectrom. 1995;6:229–33. doi:10.1016/1044-0305(95)00017-8
- Barnidge DR, Dasari S, Ramirez-Alvarado M, Fontan A, Willrich MA, Tschumper RC, Jelinek DF, Snyder MR, Dispenzieri A, Katzmann JA, et al. Phenotyping polyclonal kappa and lambda light chain molecular mass distributions in patient serum using mass spectrometry. J Proteome Res. 2014;13:5198–205. doi:10.1021/pr5005967
- Shade KT, Platzer B, Washburn N, Mani V, Bartsch YC, Conroy M, Pagan JD, Bosques C, Mempel TR, Fiebiger E, et al. A single glycan on IgE is indispensable for initiation of anaphylaxis. J Exp Med. 2015;212:457–67. doi:10.1084/jem.20142182
- Tong W, Wang G. How can native mass spectrometry contribute to characterization of biomacromolecular higher-order structure and interactions? Methods (San Diego. Calif). 2018;144:3–13.
- Bailey AO, Huguet R, Mullen C, Syka JEP, Russell WK. Ion–ion charge reduction addresses multiple challenges common to denaturing intact mass analysis. Anal Chem. 2022;94:3930–38. doi:10.1021/acs.analchem.1c04973
- Abzalimov RR, Bobst CE, Salinas PA, Savickas P, Thomas JJ, Kaltashov IA. Studies of pH-dependent self-association of a recombinant form of arylsulfatase A with electrospray ionization mass spectrometry and size-exclusion chromatography. Anal Chem. 2013;85:1591–96. doi:10.1021/ac302829k
- Frimpong AK, Abzalimov RR, Eyles SJ, Kaltashov IA. Gas-phase interference-free analysis of protein ion charge-state distributions: detection of small-scale conformational transitions accompanying pepsin inactivation. Anal Chem. 2007;79:4154–61. doi:10.1021/ac0704098
- Zhang H, Cui W, Gross ML. Mass spectrometry for the biophysical characterization of therapeutic monoclonal antibodies. FEBS Lett. 2014;588:308–17. doi:10.1016/j.febslet.2013.11.027
- Thangaraj SK, Arola H, Tullila A, Nevanen TK, Rouvinen J, Jänis J. Quantitation of thyroid hormone binding to anti-thyroxine antibody fab fragment by native mass spectrometry. ACS Omega. 2019;4:18718–24. doi:10.1021/acsomega.9b02659
- Plomp R, Hensbergen PJ, Rombouts Y, Zauner G, Dragan I, Koeleman CA, Deelder AM, Wuhrer M. Site-specific N-glycosylation analysis of human immunoglobulin e. J Proteome Res. 2014;13:536–46. doi:10.1021/pr400714w
- Wu G, Hitchen PG, Panico M, North SJ, Barbouche MR, Binet D, Morris HR, Dell A, Haslam SM. Glycoproteomic studies of IgE from a novel hyper IgE syndrome linked to PGM3 mutation. Glycoconj J. 2016;33:447–56. doi:10.1007/s10719-015-9638-y
- Greisch JF, den Boer MA, Beurskens F, Schuurman J, Tamara S, Bondt A, Heck AJR. Generating informative sequence tags from antigen-binding regions of heavily glycosylated IgA1 antibodies by native top-down electron capture dissociation. J Am Soc Mass Spectrom. 2021;32:1326–35. doi:10.1021/jasms.0c00461
- Greisch JF, den Boer MA, Lai SH, Gallagher K, Bondt A, Commandeur J, Heck AJR. Extending native top-down electron capture dissociation to MDa Immunoglobulin complexes provides useful sequence tags covering their critical variable complementarity-determining regions. Anal Chem. 2021;93:16068–75. doi:10.1021/acs.analchem.1c03740
- Lupinek C, Roux KH, Laffer S, Rauter I, Reginald K, Kneidinger M, Blatt K, Ball T, Pree I, Jahn-Schmid B, et al. Trimolecular complex formation of IgE, Fc epsilon RI, and a recombinant nonanaphylactic single-chain antibody fragment with high affinity for IgE. J Immunol. 2009;182:4817–29. doi:10.4049/jimmunol.0800726
- Leverence R, Mason AB, Kaltashov IA. Noncanonical interactions between serum transferrin and transferrin receptor evaluated with electrospray ionization mass spectrometry. Proc Natl Acad Sci USA. 2010;107:8123–28. doi:10.1073/pnas.0914898107
- Balbino B, Conde E, Marichal T, Starkl P, Reber LL. Approaches to target IgE antibodies in allergic diseases. Pharmacol Ther. 2018;191:50–64. doi:10.1016/j.pharmthera.2018.05.015
- Yang Y, Niu C, Bobst CE, Kaltashov IA. Charge manipulation using solution and gas-phase chemistry to facilitate analysis of highly heterogeneous protein complexes in native mass spectrometry. Anal Chem. 2021;93:3337–42. doi:10.1021/acs.analchem.0c05249
- Yang W, Tu Z, McClements DJ, Kaltashov IA. A systematic assessment of structural heterogeneity and IgG/IgE-binding of ovalbumin. Food & Function. 2021;12:8130–40. doi:10.1039/D0FO02980G