
 ?Mathematical formulae have been encoded as MathML and are displayed in this HTML version using MathJax in order to improve their display. Uncheck the box to turn MathJax off. This feature requires Javascript. Click on a formula to zoom.
ABSTRACT
An in-house antibody generation campaign identified a diverse, high affinity set of anti-interleukin-11 (IL-11) monoclonal antibodies (mAbs) to enable successful development of novel, custom ultra-sensitive target engagement assays for detection of “free” (unbound to the dosed anti-IL-11 therapeutic mAb) and “total” (free and mAb-IL-11 complexed form) IL-11 in preclinical species and human. Antibody hits from distinct epitope communities were screened on various platforms, including enzyme-linked immunosorbent assay, Meso Scale Discovery, Simoa HD-1 and Simoa Planar Array (SP-X), and used for assay development and sensitivity optimization. The ultra-sensitive SP-X format achieved a lower limit of quantitation of 0.006 pg/mL, enabling the first reported baseline levels of IL-11 in healthy control plasma determined by custom bioanalytical assays. These newly established baseline levels supported mechanistic pharmacokinetic/pharmacodynamic modeling in mouse, cynomolgus monkey, and human for a greater understanding of preclinical study design and in vivo dynamic interaction of soluble IL-11 with an anti-IL-11 antibody therapeutic candidate. Modeling and simulation also helped refine the utility of assays with respect to their potential use as target engagement biomarkers in the clinic.
Abbreviations IL-11: Interleukin-11, TE: Target engagement, PK/PD: Pharmacokinetic/pharmacodynamic, mAb: Monoclonal antibody, NHP: Non-human primate, IgG: Immunoglobulin G, Cyno: Cynomolgulus monkey, GFR: Glomerular filtration rate, BQL: Below quantitation levels, DRM: Disease relevant model, kDa: kilodaltons, SPR: Surface plasmon resonance, pSTAT3: phosphorylated STAT3, IL-11R: Interleukin-11 receptor, TPP: Target product protein, LLOQ: Lower limit of quantitation, RLU: Relative light units
Introduction
Measuring target engagement (TE) biomarkers following administration of monoclonal antibody (mAb) therapeutics is critical to maximize chances of success in preclinical research settings and later in development.Citation1 At the preclinical stage, it is important to determine TE in disease relevant animal models, commonly rodents, to establish the percent required to translate to desired downstream pharmacodynamic (PD) biomarker or efficacy readout. It is also critical to measure TE biomarkers in non-human primates (NHP) to enable calibration of pharmacokinetic (PK) and PD models to establish human translation. The human translation can then be linked to PK/TE/PD efficacy from the disease relevant model, and subsequently inform human efficacious dose prediction.Citation2
To enable a complete understanding of TE when blocking soluble antigen with an antibody therapeutic, the development of bioanalytical assays to measure “total” and “free” species are essential in both preclinical species and human. Measuring “total” target (free and bound to mAb as a complex) determines target accumulation post-drug in a chronic disease setting, while measuring “free” determines remaining active target, which is the most biologically relevant in the context of an antagonistic antibody therapeutic.Citation3 Each assay type has benefits and limitations. For example, “free” may be affected by dissociation over assay stepsCitation3,Citation4 and can be difficult to measure if the target exists in low abundance due to assay sensitivity required to measure levels remaining post-antibody dose. A “total” assay holds less pharmacological relevance since levels increase relative to baseline, therefore less sensitivity is required, and can serve as a qualitative confirmatory TE biomarker if the “free” assay does not achieve sufficient sensitivity.Citation5 However, developing a “total” assay can be challenging with small monomeric targets due to lack of available exposed epitopes for binding and steric hindrance of three antibodies binding to the target simultaneously (capture and detection mAbs binding to complexed mAb-target).
The “free” and “total” TE of cytokines are notoriously difficult to quantitate because these proteins typically have low abundance at baseline and are small in size.Citation5,Citation6 We identified a potential anti-interleukin-11 (IL-11) humanized immunoglobulin G (IgG) mAb therapeutic candidate, or “anti-IL-11 antibody therapeutic”, that antagonizes soluble IL-11 and has clinical potential for the treatment of fibrotic diseases.Citation7–9 Existing literature suggests the IL-11 cytokine exists in very low abundance, with reports near or below standard curve quantitation range as indicated by protocols in the kits used,Citation10–12 which highlights the need for more accurate quantitation in human. To our knowledge, custom bioanalytical assay results for IL-11 baseline levels of healthy-control preclinical species such as mouse or cynomolgus monkey (cyno) have not been reported. Commercially available kits used to detect various analytes have exhibited low sensitivity,Citation13,Citation14 lack of reproducibility,Citation15,Citation16 or even lack of target specificity,Citation17,Citation18 which limit their ability to measure the intended analyte. Therefore, we sought to develop custom, ultra-sensitive assays using in-house qualified antibody reagents and analytical standards to accurately quantitate both “free” and “total” IL-11 in preclinical species and human to fill this knowledge gap.
Due to the small size of the soluble IL-11 cytokine (19 kilodalton (kDa), monomer),Citation19 rapid turnover is likely, with clearance values within the human glomerular filtration rate (hGFR) in healthy male volunteers administered oprelvekin (Neumega®, recombinant marketed therapeutic human IL-11 protein)Citation20 in a single dose PK study, and in preclinical species.Citation21 Due to this rapid turnover, high accumulation may occur following administration of an anti-IL-11 mAb therapeutic, which, after binding to the IL-11 protein, extends its persistence in the central compartment and subsequent tissue space. Therefore “total” complexed levels of IL-11 are expected to rise significantly post-dose.
A mechanistic PK/PD model was built to estimate “free” vs. “total” IL-11 levels post an anti-IL-11 therapeutic mAb dose, with initial baselines below quantitation levels (BQL) of 31.2 pg/mL, as tested in-house with a small subset of healthy control plasma (BioIVT) using a commercial human IL-11 kit, following manufacturer’s instructions. Preliminary model estimates suggested ultra-sensitivity would be required for both “total” and “free” assays, particularly for the “free” assay to enable IL-11 detection in the presence of mAb with the desired TE (i.e., >90% blocking from baseline) since baseline levels were undetectable. Modeling would also be used to guide appropriate dose selection in disease-relevant mouse models (DRMs) with multiple dosing over a chronic setting, but also for single dose design for NHP studies for subsequent human translation.
As shown in , we needed a diverse set of anti-IL-11 “tool” mAbs targeting different epitopes on IL-11, which could be generated via a mouse immunization campaign with qualified IL-11 reference proteins, to enable custom development of ultra-sensitive “free” and “total” assays. For a “free” IL-11 assay, we needed a capture antibody with competing epitope to the dosed mAb therapeutic to enable a sandwich assay to detect unbound IL-11; the mAb-IL-11 complex does not bind and is washed away during assay steps. As sensitivity in immunoassays is driven primarily by affinity of the capture reagent,Citation13 the antibody generation campaign was also designed to identify differential epitope binders while prioritizing those with high affinity. For “total”, two non-competing antibodies targeting two distinct epitopes from the therapeutic were required to enable the assay. We anticipated challenges in generating these antibodies due to the possibility of steric hindrances that might occur from three 150 kDa antibodies binding simultaneously to a 19 kDa protein, even if these were expected to bind to different epitopes. Prioritized candidates were to be tested in a rigorous assay development screening funnel for sensitivity optimization to increase likelihood of success in this challenging bioanalytical endeavor.
Figure 1. Diagram of “free” vs. “total” IL-11 TE assays.
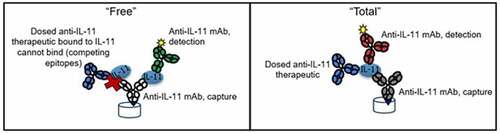
Alt Text: Cartoon depicting an anti-IL-11 mAb capture reagent bound to plate well, binding to IL-11 on the left in “free” format which is unbound to dosed anti-IL-11 therapeutic with competing epitopes to the capture anti-IL-11 mAb. On the right, the “total” assay format is shown, where capture, detection, and therapeutic anti-IL-11 mAbs are all bound simultaneously to the IL-11 for detection.
Results
Tool antibody generation and epitope binning
The anti-IL-11 tool antibody generation campaign yielded 124 hits, of which 96 were confirmed human IL-11 binders with various cross-species binding to cyno and/or mouse/murine IL-11 by surface plasmon resonance (SPR). These binders were also tested for signal inhibition in a phosphorylated STAT3 (pSTAT3) in vitro functional assay. Functional blockers and a subset of nonfunctional binders, prioritized by highest affinity and cross-species binding, were also evaluated due to the potential of development of a “total” assay, as lack of downstream pSTAT3 functional blocking may suggest binding to an epitope distinct to one that is required for blocking IL-11/IL-11 receptor (IL-11 R) interaction.Citation22 Profiling of each group is shown in .
Figure 2. Profiling of tool anti-IL-11 antibodies by affinity vs. pSTAT3 functional inhibition.
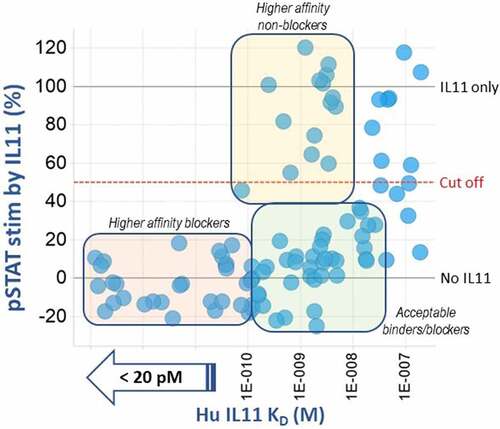
Alt Text: A graph representing each anti-IL-11 antibody tool hit as a bubble, sorted by binding affinity, KD (M), to human IL-11 on the x-axis and % stimulation of pSTAT3 on the y-axis. Three bins are indicated, including the highest affinity (< 20 pM) and lowest pSTAT3 stimulation (< 20%) (pale pink bin) and nonfunctional binders with higher affinities (80 pM to 3 nM) (pale yellow bin).
Epitope binning by classic sandwich competition binding was conducted on all confirmed binders. Ten epitope binding communities were identified, suggesting diverse epitope coverage by this set of anti-IL-11 tool mAbs compared to the anti-IL-11 mAb therapeutic (Group 5 epitope community). In each community, the antibodies were prioritized based on species cross-reactivity and highest affinity. A total of 15 high affinity anti-IL-11 tool mAbs, composed of 8 communities, were moved forward for their potential to enable “free” and “total” IL-11 TE assay development screening () and are listed as “Target Product Protein” TPP clone inventory identifiers, grouped by colors representing each unique community. Two communities (Group 3 and Group 7) were de-prioritized because of low or no cyno cross-reactivity.
Figure 3. Epitope binning results of in-house anti-IL-11 tool mAbs clustered into 10 community groups (left) depicted by circles (bi-directional binding) or squares (one directional binding) for each individual mAb surrounded in bubbles for each community. Binding affinities to human/cyno/murine IL-11, and pSTAT3 functional blocking activities of 15 antibodies chosen for TE assay development are shown in the table (right) along with their color-coded community groups. The final successful mAb pair for human/cyno “total” IL-11 is in maroon font, and the pair for “free” is in the light blue font.
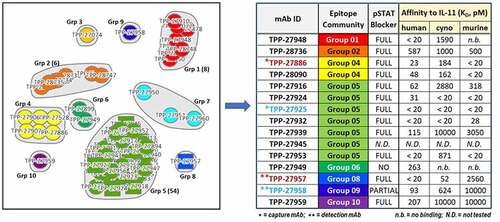
Alt Text: On the left, epitope binning results of in-house anti-IL-11 tool mAbs clustered into 10 community groups, depicted by circles or squares for each individual mAb surrounded in bubbles for each community. Each circle and square is assigned a TPP-number and the final antibodies chosen for TE assay development are selected by highest affinity from each community group and listed in a table on the right. Their binding affinities to human/cyno/murine IL-11, and pSTAT3 functional blocking activities are shown in the table, except for TPP-27945. The final successful mAb pairs in the assay are in maroon font for “total” assay and in light blue font for “free” assay; capture mAbs noted with one asterisk are from Group 5 for “total” and from Group 4 for “free”, and detection mAbs noted with two asterisks are from Group 9 for “total” and from Group 8 for “free”.
“Total” and “free” IL-11 TE assay development summary
The 15 in-house identified anti-IL-11 tool mAbs were taken through a bioanalytical assay development screening funnel (), along with a commercially available polyclonal goat anti-IL-11 antibody, making 16 total. These assays were performed to confirm the SPR results and test all potential pairs as capture and detection to optimize for highest sensitivity. A sandwich-based enzyme-linked immunosorbent assay (ELISA) was implemented as the simplest method for initial screening all 16 anti-IL-11 tool mAbs, requiring only one additional labeling step (biotin) for each mAb as a capture reagent. The initial ELISA screen compared all 16 antibodies as capture and detection combinations (i.e., 256 potential combinations), for binding to an IL-11 in-house protein standard with and without a pre-incubation of the anti-IL-11 antibody therapeutic (100:1 therapeutic mAb to IL-11 molar ratio) to form mAb-IL-11 complexes. Signal/background for each assay pair to IL-11 alone or complexed mAb-IL-11 were compared, with equal signal suggesting the pair had potential for a “total” assay, and pairs with signal reduction with IL-11-mAb complex suggesting potential for a “free” assay due to competing epitopes (supplementary materials, , ). In total, over 1,536 combinations were screened for binding to mouse, human and cyno IL-11 to identify assay pairs. The pairs were narrowed down in two ways: 1) by species detected (“total” vs. “free”) using the ELISA screening, and 2) the initial sensitivity estimate after transferring top pairs (achieving highest fold change signal/background) to the Meso Scale Discovery (MSD) platform (supplementary material, ). Once these were narrowed down to the top 2–3 pairs, as indicated in , they were further evaluated for species and sensitivity via assay optimization and standard/quality control (QC) evaluation and performance. Antibody pairs that were the same for each species (mouse, cyno or human) were prioritized when possible to minimize further optimization and development.
Figure 4. Diagram of TE bioanalytical assay development screening funnel.
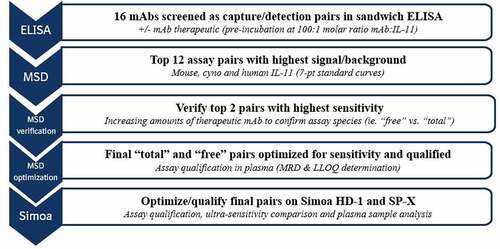
Table 1. Summary of IL-11 TE assay sensitivity improvement across platforms.
Alt Text: A flow chart depicting the TE bioanalytical development process, starting at the first ELISA screening phase at the top tier, moving down with 12 top assay pairs to MSD, verifying the top pairs on MSD with optimization and then transferring the assays to qualify and optimize on the ultra-sensitive Simoa HD-1 and SP-X platforms at the bottom.
Final MSD TE assay
The final assay pairs identified for human and cyno were capture TPP-27886 and detection TPP-27957 for the “total” assay and capture TPP-27925 and detection TPP-27958 for the “free” assay, all originating from unique epitope communities (), highlighting the importance of a diverse set of mAbs for successful TE assay development. For mouse, identical capture pairs were identified as the human/cyno, but use of the polyclonal antibody as the detection antibody achieved highest assay sensitivity, though other in-house mAbs as detection were also successful. These pairs were tested with increasing molar amounts of therapeutic anti-IL-11 mAb:IL-11 pre-incubation to further confirm measurement of “free” vs. “total” IL-11. shows signal reduction for “free” pairs as antibody titration is increased, as expected due to competing epitopes, and with lack of signal inhibition with “total” capture and detection antibodies binding separate epitopes than the therapeutic anti-IL-11 mAb. The minimum required dilution (MRD) for these assays were determined for sample analysis using spike recovery and dilution linearity in pooled plasma for each species (data not shown). All assays were determined to require a MRD of 2 in plasma. For human/cyno, a lower limit of quantitation (LLOQ) was 10 pg/mL for “free” and 14 pg/mL for “total”; for mouse, the LLOQ was 10 pg/mL for both “free” and “total” IL-11. The LLOQ was determined by the lowest reliable passing standard curve with at least 3 assay runs (within ± 30% accuracy) multiplied by MRD. While MSD assay sensitivities are respectable for this platform,Citation14 with improved LLOQs compared to commercially available IL-11 detection kits at 31.2 pg/mL for human plasma and 156 pg/mL for mouse, they were still not sufficient to detect baseline IL-11 in control plasma in any species. Therefore, a more sensitive platform was required.
Figure 5. MSD assay signal in “free” (a) vs “total” (b) assay setups with pre-incubation of therapeutic mAb:IL-11 to verify assay species measured.
Alt Text: On the left, a bar graph depicts MSD relative light unit (RLU) signal reduction on the y-axis for “free” pairs as antibody titration is increased up to 10,000:1 molar ratio therapeutic mAb to mouse, cyno and human IL-11. On the right, a bar graph depicts MSD RLU signal on the y-axis is unaffected with “total” pairs, shown up to 10,000:1 molar ratio therapeutic mAb to mouse, cyno and human IL-11.
Quantitation of human IL-11 using Simoa HD-1
The final MSD assays that achieved the highest sensitivity were transferred onto the Quanterix Simoa HD-1 platform to enable ultra-sensitivity. This platform is useful for clinical samples because it is fully automated and certified 21 CFR Part 11 compliant, with the potential for high throughput analysis in cyno or human clinical samples. However, the high volume requirement (>100 µL) precludes the use of preclinical mouse samples, which have small volumes, and thus mouse assays were not optimized on this platform. Following an assay development and optimization strategy, final instrument and assay conditions were identified that increased sensitivity compared to the MSD. Dilution linearity and spike recovery were conducted in human and cyno plasma and were determined to be 2. The determined LLOQ (using MRD of 2) was established at 0.048 pg/mL for the “free” assay and 0.78 pg/mL for the “total” human/cyno IL-11 assay, improving the LLOQ >200-fold compared to the MSD platform for the “free” assay. To determine whether these assay sensitivities were sufficient, a group of random 20 control human plasma samples were run (BioIVT) to measure baseline levels, but many were BQL, indicating greater sensitivity would be required (supplementary materials, ).
Quantitation of mouse, human and cyno IL-11 using Simoa SP-X
The final pairs were transferred to the Quanterix Simoa Planar Array (SP-X) platform for further sensitivity improvement. Following an assay development and optimization strategy, final instrument and assay conditions were identified that increased sensitivity compared to the HD-1 platform. Dilution linearity and spike recovery, and species verification were conducted in plasma and an initial MRD of 2 was established (supplementary materials, ). The determined LLOQ for the “free” human/cyno assay on the Simoa SP-X was 0.006 pg/mL, an 8-fold improvement over the HD-1 platform and 1,667-fold improvement over MSD, as shown in . For simplicity, only “free” human IL-11 standard curves are shown, but all three species standard curves showed the same trends on each platform tested. The LLOQ for the human/cyno “total” assay, at 0.16 pg/mL, improved 5-fold compared to the HD-1 and 88-fold compared to the MSD. For mouse, the determined LLOQ was similar to cyno/human at 0.006 pg/mL for the free assay and 1.1 pg/mL for the total assay. Resulting final SP-X “free” IL-11 assays enabled measurement of baseline levels of IL-11 in a subset of healthy control cyno, mouse and human plasma (BioIVT) samples, with mean baseline concentrations of 0.61, 0.15 and 0.02 pg/mL (), respectively.
Figure 6. Comparison of IL-11 reference standard curve performance for (a) “free” human/cyno IL-11 assay on MSD, Simoa HD-1 and SP-X, and (b) “free” mouse IL-11 on MSD and Simoa SP-X, normalized by signal/background.
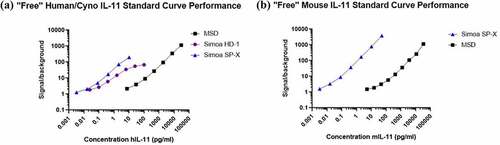
Figure 7. Baseline IL-11 concentrations in plasma controls in preclinical species and healthy human.
Alt Text: A graph on the left comparing human IL-11 reference standard curve performance for “free” IL-11 assay on MSD, Simoa HD-1 and SP-X, as shown, normalized by signal/background on y-axis and concentration in pg/mL on the x-axis. A graph on the right comparing mouse IL-11 reference standard curve performance for “free” IL-11 assay on MSD and SP-X, as shown, normalized by signal/background on y-axis and concentration in pg/mL on the x-axis. The SP-X signal/background at 1.5 achieves the lowest standard curve point at 0.003 pg/mL and is the most sensitive assay.
Alt Text: A graph depicting individual baseline levels of IL-11 in three groups of healthy control cyno, mouse and human plasma (BioIVT) samples, with mean baseline concentrations of 0.61, 0.15 and 0.02 pg/mL, respectively, all above the SP-X LLOQ shown as a dotted line at 0.006 pg/mL.
PK/PD model simulations
We conducted PK/PD mechanistic model simulations () that incorporated newly established baseline levels of IL-11 for each species and compared TE following administration of a humanized anti-IL-11 mAb therapeutic with SP-X assay LLOQs. Antibody specific parameters (, Materials and Methods section) were derived from a subset of typical mAbs targeting low level soluble antigens (i.e., absence of any potential target-mediated drug disposition) in each respective species. Antibody elimination (k10) was assumed to reflect that of a typical humanized IgG administered in mouse, cyno and humanCitation23,Citation24 and assumed to occur in the central compartment only. Target degradation (kdeg) was approximately the GFR (glomerular filtration rate) for each respective species based on reported human clearance (CL) values of recombinant IL-11 therapeutic protein Neumega®, following dosing in healthy human volunteers,Citation20 and cyno,Citation21 and assumed for mouse due to 19k Da molecular weight. The synthesis rate (ksyn) was calculated by multiplying IL-11 CL by baseline levels as measured experimentally. Complex elimination (k20) was assumed to be equal to that of mAb in absence of other data. The subcutaneous (SC) bioavailability fraction (F) and absorption rate (ka) constant were referenced from literature as the mean value of several marketed mAb therapeutics in each species.Citation23,Citation25
Figure 8. Diagram of PK/PD model.
Table 2. PK/PD Model Parameters
Alt Text: A diagram of PK/PD model structure, with each entity in the model represented in a circle and transfers and binding in arrows, including mAb distribution to and from the tissue space, absorption binding to IL-11 to mAb-IL-11 complex in a reversible manner with kon and koff.
Multi-dose simulations were conducted using the mouse-specific PK/PD model to enable chronic mouse pharmacology studies, with dosing twice weekly intraperitoneally (IP) with 1 mg/kg of a humanized anti-IL-11 therapeutic antibody and are shown in . Predicted antibody, “total” and “free” concentrations are shown in pg/mL, as compared to baseline levels in mouse of 0.15 pg/mL. Following 1 mg/kg twice weekly IP administration, “total” IL-11 accumulates above baseline, as expected, above the LLOQ of the mouse SP-X assay, with “free” IL-11 reduced (blocked) below baseline, with levels above the LLOQ to enable TE and link to PD and efficacy readouts.
Figure 9. Mouse PK/PD Model Simulations for “free” IL-11 in plasma following twice weekly increasing IP doses in mouse with a humanized IgG anti-IL-11 antibody therapeutic vs LLOQs.
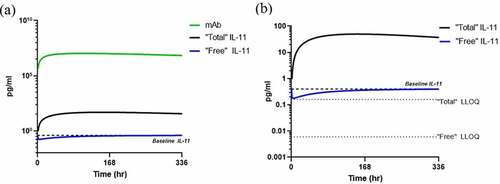
Single dose simulations were conducted using the cyno-specific PK/PD model to enable preclinical PK/TE studies in cyno monkey. A single dose of 1.5 mg/kg was administered SC, and predicted antibody, “total” and “free” IL-11 predicted concentrations are shown in . Baseline levels of IL-11 are at a mean of 0.6 pg/mL in a subset of monkeys, and the modeling and simulation shows “total” IL-11 accumulation to confirm TE and the enablement of “free” IL-11 measurement below baseline, well above the LLOQ of the SP-X assay. This confirmation demonstrates assay LLOQ enables TE measurement in planned cyno studies.
Figure 10. Cyno PK/PD model simulations in plasma following single 1.5 mg/kg subcutaneous dose in cyno with a humanized IgG anti-IL-11 antibody therapeutic with (a) mAb and IL-11 concentrations and (b) estimated “free” and “total” IL-11 vs SP-X assay LLOQs.
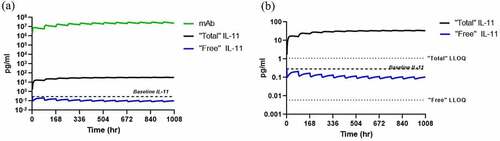
Single dose simulations were conducted using the human PK/PD model to estimate “free” and “total” IL-11 levels following a single 1.5 mg/kg dose administered SC in healthy volunteers and are shown in . This typical SC dose was selected based on average solubility for mAbs at roughly 100 mg/mLCitation29 and a 70 kg patient. Following a single dose of an IL-11 antibody therapeutic, using baseline levels of 0.01 pg/mL as determined in-house, “free” IL-11 is predicted to drop briefly below the SP-X LLOQ at mAb exposure peak, and rise within the LLOQ for the remainder of the timecourse. The “total” IL-11 accumulates above baseline, as expected, and is within the quantitation range of the SP-X for the duration of the timecourse, as to confirm TE as a surrogate biomarker should “free” levels drop BQL.
Figure 11. Human PK/PD model simulations in plasma following single 1.5 mg/kg subcutaneous dose in human with a humanized IgG anti-IL-11 antibody therapeutic with (a) mAb and IL-11 concentrations and (b) estimated “free” and “total” IL-11 vs SP-X assay LLOQs.
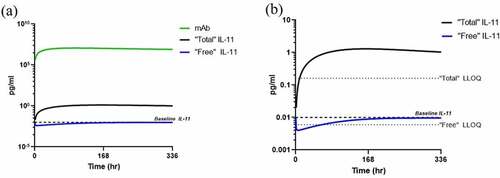
Alt Text: A line graph representing mouse PK/PD model simulations with “free” IL-11 concentrations in pg/mL on the y-axis vs. time in hours on the x-axis with 1, 3 and 10 mg/kg twice weekly IP doses, showing TE increases relative to IL-11 baseline and approaches assay LLOQ depicted in a dotted line at 0.006 pg/mL.
Alt Text: A line graph on the left representing cyno PK/PD model simulations following a single 1.5 mg/kg SC dose with antibody, “free” and “total” IL-11 concentrations in pg/mL on the y-axis vs. time in hours on the x-axis with baseline levels of IL-11 are at a mean of 0.6 pg/mL shown in a dotted line. On the right, a line graph representing the same simulation showing “total” IL-11 accumulation to confirm TE and the enablement of “free” IL-11 measurement below baseline, both measurements well above the LLOQs of SP-X assays depicted as dotted lines at 0.006 and 0.16 pg/mL, respectively.
Alt Text: A line graph on the left representing human PK/PD model simulations following a single 1.5 mg/kg SC dose with antibody, “free” and “total” IL-11 concentrations in pg/mL on the y-axis vs. time in hours on the x-axis with baseline levels of IL-11 are at a mean of 0.02 pg/mL, depicted in a dotted line. On the right, a line graph representing the same simulation showing “total” IL-11 accumulation to confirm TE and the enablement of “free” IL-11 measurement below baseline, both measurements above the LLOQs of SP-X assays depicted as dotted lines at 0.006 and 0.16 pg/mL, respectively. The “free” IL-11 drops briefly below the LLOQ, but “total” IL-11 remains above LLOQ.
Discussion
An in-house antibody generation campaign identified a diverse set of high-affinity tool anti-IL-11 mAbs to enable successful development of custom ultra-sensitive target engagement biomarker assays for detection of “free” and “total” IL-11 post anti-IL-11 therapeutic dose, in preclinical species and human. A variety of technologies were evaluated for assay development, with the SP-X platform achieving ultra-sensitivity with an LLOQ of 0.006 pg/mL in plasma samples. These assays were used to measure IL-11 levels in mouse, cyno and human, enabling mechanistic PK/PD modeling and a greater understanding of the potential in vivo dynamic interactions of soluble IL-11 with an anti-IL-11 antibody therapeutic.
The TE tool antibody reagent identification, binning and screening strategy that was successfully implemented is broadly applicable with in-house generated antibodies against any soluble monomeric target to increase chances of successfully developing custom assays while also increasing sensitivity when required. The final ultra-sensitive SP-X assays achieved a sensitivity improvement >5,000-fold compared to commercially available human and mouse IL-11 kits. includes a summary LLOQs achieved by various TE assays on each platform compared to kits that detect at a minimum “free” IL-11 but have not been qualified for the ability to detect IL-11 following therapeutic mAb administration (i.e., “free” vs. “total”). All assays showed similar fold improvements with mouse and cyno/human in each respective platform. Although the MSD assay was not sensitive enough for baseline control IL-11 levels, it could potentially be used in other mechanistic in vivo or in vitro systems that upregulate IL-11 well above baseline levels. Many labs have access to an MSD platform, as it widely used across the scientific community with easily transferable methods. In addition to sensitivity improvement, the SP-X platform also provides the advantage of enabling mouse sample analysis with minimal volume requirement of 50 µL of diluted sample. Preliminary optimization of protocols suggests similar performance at sample volumes of 30–50 µL, further enabling measurement of multiple endpoints (i.e., antibody, “total” and “free” IL-11) in a single mouse plasma sample with limited volume,Citation30 to maximize data output while reducing the use of satellite animals in a disease relevant model. For this reason, we believe the SP-X is an important tool for the analysis of samples from preclinical mouse pharmacology models, especially when designing and using repeat dosing and sampling for enabling time-resolved PK and TE measurements.
We leveraged PK/PD modeling and simulation for the ability to measure TE in humans and potential use as a biomarker. Following a typical single SC dose of 1.5 mg/kg of an IL-11 antibody therapeutic, modeling suggests SP-X assay sensitivity may enable detection of “free” IL-11 and supplement with “total” IL-11 for timepoints that drop below LLOQ to support potential TE biomarkers and single rising dose Ph1 trials in healthy volunteers. Although qualification of a TE biomarker requires measurement of baseline in almost 100% of patients, should “free” IL-11 drop below LLOQ, all “total” IL-11 measurements are predicted to be within the assay quantitation range to supplement TE as a surrogate biomarker post mAb dose, until “free” levels rise back into detectable concentrations at trough concentrations of mAb.
The PK/PD modeling as shown focuses on a small subset of healthy volunteers and control preclinical species, but, in the context of disease literature, reports suggest elevated levels of IL-11.Citation19,Citation31 For this reason, a larger panel of healthy and disease patient plasma is required to establish the target-to-disease link for anti-IL-11 therapeutics in multiple fibrotic diseases, with assay qualification in corresponding plasma to enable use in clinical samples. This assay qualification, development and optimization is ongoing on the SP-X with diseased plasma to refine the current assays and define assay LLOQ and MRDs for use in additional samples and further clinical potential. Pending measurement of elevated IL-11 in diseases as hypothesized, detecting TE in patients is likely to be successful since ultra-sensitive assays can already measure baseline levels in healthy controls. Pending completion of this ongoing assay refinement, disease levels in larger cohorts of patients from multiple external collaborations will be measured and used to subsequently refine the PK/PD model.
Additional outstanding activities include conducting single dose preclinical PK studies with the anti-IL-11 therapeutic antibody to generate experimental data and calibrate PK/PD models for future translation to human to reduce the number of assumptions. Antibody-specific parameters will need to be fitted and estimated by the model, as well as the complex elimination parameter, which is currently assumed to be equal to that of mAb.
Overall, we have shown the applicability of well-characterized TE biomarker assays with potential measure IL-11 in disease-relevant models to support the PK/TE/PD link to efficacy, single dose cyno PK studies for human model translation, and to enable the determination of human efficacious dose and clinical potential of an anti-IL-11 antibody therapeutic.
Materials and methods
IL-11 protein production and quality control
Human, cyno (94.47% identity with human), and mouse IL-11 (87.94% identity with human) connected to a C-terminal 6xHis-tag was transiently expressed in HEK293F cells UniProt Accession Number: P20809, P20808, and P47873, respectively. Recombinant proteins secreted in cell culture media were purified with nickel-affinity chromatography, followed by gel-filtration chromatography. Sequences were confirmed by mass spectrometry. The protein was found to be in >99% monomer by sedimentation velocity analytical ultracentrifugation.
Tool antibody generation
NZB/W mice were immunized via SC administration of combinations of recombinant human, cyno and mouse IL-11 proteins once per week following standard laboratory immunization protocols. All animal work followed the ethical standards of the Declaration of Helsinki. Immune sera were collected on weeks 6 and 10 and analyzed for antigen-specific IgG antibody titers by ELISA methods. A subset of mice displaying strong antibody response against all three antigens were used for spleen harvest on week 12. Antigen-specific IgG1+ memory B-cells were collected by single cell sorting. Paired VH/VL antibody genes of single B-cells were recovered by reverse transcription, PCRs and Sanger sequencing using appropriate primers for heavy and light chains. Recombinant antibodies were synthesized, expressed, and purified using Protein A beads. A diverse set of antibodies against IL-11 were identified by extensive and stringent screening of binding to human, cyno and mouse recombinant IL-11 proteins.
Surface plasmon resonance binding studies
The SPR experiments were performed using a Biacore 8 K+ (Cytiva) equipped with a CM5 sensor chip. Protein A/G (10 µg/mL in 10 mM sodium acetate, pH 4.5) was amine coupled to the surface by first activating the carboxylated methyl surface with a 1:1 mixture of 0.1 M N-hydroxysuccinimide (NHS) and 0.1 M 3-(N,N-dimethylamino) propyl-N-ethylcarbodiimide (EDC) at a flow rate of 10 µL/min. The surface channels were blocked with a 7 min injection of 1 M ethanolamine, pH 8.0. To collect kinetic binding data, anti-IL-11 antibodies (1 µg/mL) were captured on the Protein A/G surface for 60 sec with a flow rate of 10 µL/min. The analyte, recombinant IL-11 (19 kDa) in 10 mM HEPES, 150 mM NaCl, 0.01% P20, pH 7.4, was injected at concentrations of 10, 5, 2.5, 1.25 and 0.625 nM at a flow rate of 30 µL/min and at a temperature of 25°C. The association and dissociation were both 300 sec. The surfaces were regenerated with a 30 sec injection of 0.85% phosphoric acid at 100 µL/min. The analyte interaction with sensor surface (reference) and buffer blank (0 nM analyte) were subtracted from the raw data. Sensorgrams were then fit globally to 1:1 Langmuir binding to provide on-rate (ka), off-rate (kd), and dissociation constant (KD) values.
Epitope binning
The epitope binning experiment was performed on a Carterra® LSA™ instrument following manufacturer’s application notes. Specifically, anti-IL-11 antibodies in 10 mM sodium acetate (pH 4.5) were amine coupled to an activated CMD200M chip surface in 96-well array. A classical epitope binning method (sandwich format) comprising the following steps was used: Antigen binding of 100 nM recombinant IL-11 (5 min); Analyte binding of the second mAb, approximately 15 µg/mL in HBS-EP buffer (5 min); Dissociation (1 min); Regeneration (2x30 sec) and Stabilization (1 min). The data were analyzed to generate epitope communities in Carterra’s Epitope software.
pSTAT3 functional inhibition
HTB183 cells (ATCC NCI-H661, large cell lung carcinoma) were plated in full medium (Gibco: RPMI 1640, cat#11875-093, 10% fetal bovine serum (FBS) cat#A31004-0, 1:100 GlutaMax-I, cat#35050-061, Penicillin Streptomycin cat#35015140-122) into 96-well CellBind plates at 150 mL/well (10,000 cells/well) and incubated 2 hours at 37°C with 5% CO2 in complete growth medium. After 2 hours, medium was removed and replaced with 150 mL/well of fresh medium and incubated overnight at 37°C with 5% CO2. The next day medium was removed, cells washed with starve medium, and replaced with 150 mL/well of fresh starvation medium (no FBS) and incubated overnight at 37°C with 5% CO2. In-house anti-IL-11 antibodies were serially diluted 1:3 in a 10-point dose curve in 50 ng/mL in-house human IL-11, 1% FBS from 10 mg/mL (66.5 nM) to 500 pg/mL (3.38 pM) with controls and incubated at 37°C for 40 min. Starve medium was removed and 150 mL of antibody/IL-11 dilutions were added to cells for 25 min, medium removed and cells lysed in 50 mL cold kit-provided lysis buffer and stored at −80°C. An ERK-STAT3 Cascade Assay (MSD, Whole Cell Lysate Kit cat#K15116D-2) was performed according to manufacturer’s instructions using thawed lysate at 50 µL/well during sample addition step. Plate was read on MSD QuickPlex 120 Imager to determine the electro-chemiluminescent signal. Percent inhibition of pSTAT3 by IL-11 stimulation was then determined for each antibody.
Antibody reagent labeling for use in various bioanalytical assays
Biotinylation was performed for all mAbs for a primary ELISA screen and secondary MSD assay using a no-weigh EZ-Link Sulfo-NHS-LC-Biotin kit (Pierce Thermo Scientific cat#A39257) using a 1:10 antibody-to-biotin challenge ratio and incubated for one hour at room temperature (RT) with shaking (600 rpm). The resulting biotinylated antibodies were desalted using a 0.5 mL Zeba 7 K MWCO spin column (Thermo Scientific, cat#PI89883), following manufacturer’s instructions.
Antibodies used for MSD assays were labeled with a Sulfo-Tag NHS-Ester (MSD, cat#R91AO-1) using a 1:12 antibody to sulfo challenge ratio and incubated at one hour RT with shaking (600 rpm). The resulting sulfo-tagged antibodies were desalted using a 0.5 mL Zeba 40 K MWCO spin column, following manufacturer’s instructions.
For the Simoa HD-1 instrument, a ‘homebrew’ starter kit was used to implement custom assay development and reagent labeling (Quanterix, cat#101351), containing all necessary consumables and reagents. Detection antibodies were biotinylated at a 1.0 mg/mL concentration at 40X ratio of NHS-PEG Biotin and buffer exchanged into Quanterix proprietary buffers following the manufacturer’s recommendations. The capture antibodies were conjugated to paramagnetic beads at 0.5 mg/mL with 0.5 mg/mL EDC for bead activation (RT) and for the total assay using 0.2 mg/mL capture antibody and 0.1 mg/mL EDC (4°C). The beads were prepared, blocked, conjugated and washed using proprietary wash and re-suspension buffers following the specific protocol provided by Quanterix. Bead count and aggregation were verified >80% monomeric for use in the assays.
For the SP-X assay, a ‘homebrew’ starter kit was used to implement custom assay development and reagent labeling, following manufacturer’s protocols (Quanterix, cat#100-0461). Capture and detection antibodies were buffer exchanged into Quanterix conjugation buffer, with capture mAbs conjugated to a Quanterix proprietary peptide label and detection mAbs biotinylated with a PEG-Biotin. Following incubation, excess label and biotin were buffer exchanged and final mAbs diluted to 0.25 mg/mL in Diluent A for assay use.
ELISA kit testing
An R&D Systems Quantikine ELISA kit (cat#D1100) was used to measure baseline levels of IL-11 in human control plasma, following manufacturer’s instructions and recommended 2-fold plasma sample dilution, with baseline levels BQL of 31.2 pg/mL. An Abcam ELISA kit (cat#ab215084) was used to measure baseline levels of IL-11 in mouse control plasma, following manufacturer’s instructions and recommended 2-fold plasma sample dilution, with baseline levels BQL of 156 pg/mL.
ELISA for primary antibody screen
A sandwich-based ELISA method was implemented as a first screening tool for all identified antibody capture and detection pairs since it reduces additional labeling steps with biotinylated antibodies as capture using the 15 in-house identified anti-IL-11 tool mAbs with the commercially available polyclonal goat anti-IL-11 antibody (R&D systems, mouse: cat#AF-418-NA or cyno/human: cat#AF-218-NA). Nunc Maxisorp 96-well plates (Thermo Fisher cat#439454) were coated with 50 µL/well of each unlabeled capture antibody at 2 µg/mL, diluted in 1X phosphate-buffered saline (PBS) and placed at 4°C overnight. Each capture antibody was added in one column to enable screening each capture against each detection antibody, added later across each row (checker box method, i.e., 96 total potential combinations on one plate, (supplementary materials, , ), conducted in duplicate plates, to mirror the same setup to test for “total” or “free” species detected. The next day the plates were washed three times with 300 µL/well wash buffer (1X PBS with 0.05% Tween 20), patted dry and blocked with 150 µL blocking/binding buffer (5% bovine serum albumin (BSA) with 0.05% Tween 20) for one hour at RT, shaking (300 rpm). During this blocking step, a one-hour pre-incubation of mouse, cyno or human in-house recombinant IL-11 reference protein and the anti-IL-11 antibody therapeutic candidate were prepared at a 100:1 mAb:IL-11 molar ratio, to create complexed form for the “total” assay screen. The plates were washed three times and 50 µL/well of IL-11 were added to one plate (diluted in binding buffer) for the “free” assay and 50 µL/well of the pre-incubated therapeutic mAb-IL-11 complex mixture for the “total” assay were added to the other, for one hour at RT, with shaking (300 rpm). The plates were washed and 50 µL/well of each biotinylated secondary anti-IL-11 antibody at 2 µg/mL (diluted in binding buffer) were added to each row and incubated for one hour at RT, shaking (300 rpm). Plates were washed and 100 µL/well of streptavidin-horseradish peroxidase (HRP) detection reagent (Southern Biotech, cat#7105-05) was added at a 1:4000 dilution (in binding buffer), and incubated at RT for one hour, with shaking (300 rpm). Plates were washed three times and 100 µL/well of tetramethyl benzidine (TMB) substrate solution was added for approximately 3–5 min, with gentle shaking. The reaction was stopped with 50 µL/well 1 M H2SO4 and the optical density (OD) was measured using a SpectraMax M3 microplate reader at 450 and 650 nm dual wavelength. Raw absorbance for each antibody pair combination was divided by background to get a signal/background ratio for comparison.
MSD
MSD 96-well small spot streptavidin gold plates (MSD, cat#L45SA) were coated with 50 µL/well biotinylated capture antibody at 2 µg/mL diluted in 1X PBS and placed at 4°C overnight. The next day the plates were washed three times with 300 uL/well wash buffer (1X PBS with 0.05% Tween 20) and 150 µL/well blocking/binding buffer (5% BSA with 0.05% Tween 20) was added and incubated for one hour RT, shaking at 500 rpm. Plates were washed three times, and 25 µL/well of IL-11 standards and QCs and samples were added to the plate (diluted in binding buffer) and incubated for one hour RT, with shaking at 500 rpm. The plates were washed ant 50 µL/well each sulfo-tagged detection antibody at 2 µg/mL was added to the plate, sealed with a light-blocking cover, and incubated for one hour RT, with shaking at 500 rpm. After incubation, the plates were washed three times and 150 µL of 2X Read Buffer T (MSD cat#R92TC, 4X stock diluted 2X in H2O) was added to each well and read immediately on the MSD QuickPlex 120 Imager using an electrochemiluminescent (ECL) signal. QC and unknown sample concentrations were back-calculated using standard curves fitted to a log-log four-parameter logistics equation using MSD Discovery Workbench software v4.
Simoa HD-1
Custom “homebrew” HD-1 assays use all reagents sourced from their Homebrew kit (unless noted) and use a bead reaction concentration of 2.0E+07 beads/mL, by diluting the stock concentration into Bead Diluent (Quanterix). Standards, QCs, and samples were diluted in Casein buffer (Thermo Fisher, cat#37532) and added to 96-well non-binding plates at 180 µL/well for singlicate and 300 µL/well for replicates. Biotinylated detection antibodies are added at 0.7 µg/mL in Detection Diluent (Quanterix). Reagents were prepared into proprietary bottles, loaded into the instrument reagent bay, including a preparation of 100 pM Streptavidin B-galactosidase reporter enzyme (SBG, Quanterix), with resorufin-B-D-galactopyranoside substrate (RGP, Quanterix). The instrument is fully automated, and sample incubations, washes and detection steps are performed on the instrument, with consumables (CDs, pipette tips, cuvettes), loaded before a run. Assays use a three-step protocol (35–5 step timing) by adding beads with sample in step one, detection in step two and SBG in step three with incubations and washing in between, with each sample reaction contained in an individual disposable cuvette. After a final bead wash, the reaction is re-suspended in RGP and transferred to femto-liter sized microarrays on a CD (Quanterix). After sealing with mineral oil, a dual detection method is initiated, which uses time-lapsed fluorescence at multiple wavelengths combined with a digital image of the wells, to report final signal as average enzymes per bead (AEB). QC and unknown sample concentrations were back-calculated by plotting standard curve concentrations versus AEB in a log-log five-parameter curve fit with 1/yCitation2 weighting using Simoa HD-1 Analyzer data reduction software.
Simoa SP-X
Custom “homebrew” SP-X (Simoa Planar Array Technology) assays use all reagents as sourced in their Homebrew kit, with Quanterix pre-coated plates with an antibody (high density, circular spotted coating) with high specificity for the Quanterix proprietary peptide. The plate is washed using the Quanterix Microplate Washer and SP-X Wash 2.0 program. Following washing, plates were patted dry and 1 µg/mL capture antibody conjugated to the proprietary peptide (Quanterix) diluted in Diluent A (Quanterix), were added for 30 min on a SP-X plate with microclime lid (filled with H2O), at 50 µL/well, shaking at 500 rpm RT on the Quanterix plate incubator. Plates were washed, patted dry, and 50 µL of each rIL-11 analytical reference standards, QCs, and samples, diluted in Diluent A, were added to the plate. The plates were incubated for 2 hours shaking at 500 rpm RT. Plates were washed, patted dry, and 50 µL/well biotinylated detection antibody, diluted to 1 µg/mL in Diluent A were added to the plate and incubated for 30 min shaking at 500 rpm RT. The plates were washed and 50 µL of Streptavidin-HRP conjugate (Quanterix) was added to the plate and incubated for 30 min RT, shaking at 500 rpm. The plates were washed using the post-HRP conjugate custom wash program (Quanterix), which utilizes extra steps to remove residual HRP to reduce background signal. After patting dry, 50 µL/well of SuperSignal substrate (1:1 mix prepared of Stable Peroxide and SuperSignal Luminol Enhancer, both supplied by Quanterix) is added to the plates and read on the SP-X Imager immediately, at both short (~20 s) and long (~200 s) exposures to maximize detection and sensitivity using combined chemiluminescent signal and high precision CCD camera imaging technology. QC and unknown sample concentrations were back-calculated by plotting standard curve concentrations versus signal in a log-log five-parameter curve fit using SP-X analysis software.
PK/PD model structure
A mechanistic PK/PD model (Phoenix 64 WinNonLin v8.2), as shown previously in , was implemented to demonstrate the dynamic interaction between an anti-IL-11 antibody therapeutic and soluble IL-11 in the central compartment, using target binding kinetics. Antibody concentration in plasma (A2) distributes to tissue space (A3) and returns, as denoted by first-order rate microconstants k12 and k21, respectively, and is assumed to be eliminated from the central compartment via first order rate microconstant k10. Antibody binds to soluble IL-11 (A4) with association rate kon to form antibody-IL-11 complex (A5), which is either dissociated via koff through reversible binding or is degraded with first order microconstant k20. Soluble IL-11 concentrations (A4) in the central compartment are synthesized with zero-order rate constant ksyn and assumed to be eliminated in the same compartment via first order rate constant kdeg. V represents the volume of central compartment. Antibody concentration (A1) is administered via SC injection and a fraction (F) is absorbed into the central compartment following absorption first-order rate constant ka. The following differential equations were used to describe this model with corresponding parameters as listed in .
Differential equations used to describe PK/PD model:
Supplemental Material
Download MS Word (119.4 KB)Disclosure statement
No potential conflict of interest was reported by the author(s).
Supplementary material
Supplemental data for this article can be accessed online at https://doi.org/10.1080/19420862.2022.2104153
Additional information
Funding
References
- Fernando K, Menon S, Jansen K, Naik P, Nucci G, Roberts J, Wu SS, Dolsten M. Achieving end-to-end success in the clinic: pfizer’s learnings on R&D productivity. Drug Discov Today. 2022;27(3):697–13. doi:10.1016/j.drudis.2021.12.010.
- Peters SA, Petersson C, Blaukat A, Halle J-P, Dolgos H. Prediction of active human dose: learnings from 20 years of Merck KGaA experience, illustrated by case studies. Drug Discov Today. 2020;25(5):909–19. doi:10.1016/j.drudis.2020.01.002.
- Lee JW, Kelley M, King LE, Yang J, Salimi-Moosavi H, Tang MT, J-F L, Kamerud J, Ahene A, Myler H, et al. Bioanalytical approaches to quantify “total” and “free” therapeutic antibodies and their targets. Technical Challenges and PK/PD Applications over the Course of Drug Development. Aaps J. 2011;13:99–110.
- Zheng S, McIntosh T, Wang W. Utility of free and total target measurements as target engagement and efficacy biomarkers in biotherapeutic development—Opportunities and challenges. J Clin Pharmacol. 2015;55(S3):S75–84. doi:10.1002/jcph.357.
- Wang W, Wang X, Doddareddy R, Fink D, McIntosh T, Davis HM, Zhou H. Mechanistic pharmacokinetic/target engagement/pharmacodynamic (PK/TE/PD) modeling in deciphering interplay between a monoclonal antibody and its soluble target in cynomolgus monkeys. Aaps J. 2014;16(1):129–39. doi:10.1208/s12248-013-9545-8.
- Lee JW, Salimi-Moosavi H. Bioanalysis of target biomarker and PK/PD relevancy during the development of biotherapeutics. Bioanalysis. 2012;4(20):2513–23. doi:10.4155/bio.12.220.
- Schafer S, Viswanathan S, Widjaja AA, Lim -W-W, Moreno-Moral A, DeLaughter DM, Ng B, Patone G, Chow K, Khin E, et al. IL-11 is a crucial determinant of cardiovascular fibrosis. Nature. 2017;552(7683):110–15. doi:10.1038/nature24676.
- Widjaja AA, Singh BK, Adami E, Viswanathan S, Dong J, D’Agostino GA, Ng B, Lim WW, Tan J, Paleja BS, et al. Inhibiting interleukin 11 signaling reduces hepatocyte death and liver fibrosis, inflammation, and steatosis in mouse models of nonalcoholic steatohepatitis. Gastroenterology. 2019;157(3):777–792.e14. doi:10.1053/j.gastro.2019.05.002.
- Ng B, Dong J, D’Agostino G, Viswanathan S, Widjaja AA, Lim -W-W, Nsj K, Tan J, Chothani SP, Huang B, et al. Interleukin-11 is a therapeutic target in idiopathic pulmonary fibrosis. Sci Transl Med. 2019;11(511). doi:10.1126/scitranslmed.aaw123.
- Elshabrawy HA, Volin MV, Essani AB, Chen Z, McInnes IB, Raemdonck KV, Palasiewicz K, Arami S, Gonzalez M, Ashour HM, et al. IL-11 facilitates a novel connection between RA joint fibroblasts and endothelial cells. Angiogenesis. 2018;21(2):215–28. doi:10.1007/s10456-017-9589-y.
- Trontzas P, KamperR EF, Potamianou A, Kyriazis NC, Kritikos H, Stavridis J. Comparative study of serum and synovial fluid interleukin-11 levels in patients with various arthritides. Clin Biochem. 1998;31(8):673–79. doi:10.1016/S0009-9120(98)00062-9.
- Cremer M, Schulze H, Linthorst G, Folman CC, Wehnert S, Strauß G, von Dem BA, Welte K, Ballmaier M. Serum levels of thrombopoietin, IL-11, and IL-6 in pediatric thrombocytopenias. Ann Hematol. 1999;78(9):401–07. doi:10.1007/s002770050538.
- Fischer SK, Joyce A, Spengler M, Yang T-Y, Zhuang Y, Fjording MS, Mikulskis A. Emerging technologies to increase ligand binding assay sensitivity. Aaps J. 2015;17(1):93–101. doi:10.1208/s12248-014-9682-8.
- Goodman J, Agoram B. Analytical assay platforms for soluble target engagement biomarkers: old favorites and emerging technologies. Bioanalysis. 2013;5(23):2919–31. doi:10.4155/bio.13.262.
- Breen EC, Reynolds SM, Cox C, Jacobson LP, Magpantay L, Mulder CB, Dibben O, Margolick JB, Bream JH, Sambrano E, et al. Multisite comparison of high-sensitivity multiplex cytokine assays. Clin Vaccine Immunol. 2011;18(8):1229–42. doi:10.1128/CVI.05032-11.
- Yeung D, Ciotti S, Purushothama S, Gharakhani E, Kuesters G, Schlain B, Shen C, Donaldson D, Mikulskis A. Evaluation of highly sensitive immunoassay technologies for quantitative measurements of sub-pg/mL levels of cytokines in human serum. J Immunol Methods. 2016;437:53–63. doi:10.1016/j.jim.2016.08.003.
- Patel P, Kuzmanov U, Mital S. Avoiding false discovery in biomarker research. Bmc Biochem. 2016;17(1):17. doi:10.1186/s12858-016-0073-x.
- Gutiérrez OM, Sun CC, Chen W, Babitt JL, Lin HY. Statement of concern about a commercial assay used to measure soluble hemojuvelin in humans. Am J Nephrol. 2012;36(4):332–33. doi:10.1159/000342519.
- Putoczki TL, Ernst M. IL-11 signaling as a therapeutic target for cancer. Immunotherapy. 2015;7(4):441–53. doi:10.2217/imt.15.17.
- Aoyama K, Uchida T, Takanuki F, Usui T, Watanabe T, Higuchi S, Toyoki T, Mizoguchi H. Pharmacokinetics of recombinant human interleukin‐11 (rhIL‐11) in healthy male subjects. Brit J Clin Pharmaco. 1997;43(6):571–78. doi:10.1046/j.1365-2125.1997.00605.x.
- Ma S, Ho S-H, Ma S, Li Y, Li K, Tang X, Zhao G-R, Xu S. The pharmacokinetic and pharmacodynamic properties of site-specific pegylated genetically modified recombinant human interleukin-11 in normal and thrombocytopenic monkeys. Eur J Pharm Biopharm. 2017;119:185–91. doi:10.1016/j.ejpb.2017.05.013.
- Dimitriadis E, Stoikos C, Tan Y-L, Salamonsen LA. Interleukin 11 signaling components signal transducer and activator of transcription 3 (STAT3) and suppressor of cytokine signaling 3 (SOCS3) regulate human endometrial stromal cell differentiation. Endocrinology. 2006;147(8):3809–17. doi:10.1210/en.2006-0264.
- Dirks NL, Meibohm B. Population pharmacokinetics of therapeutic monoclonal antibodies. Clin Pharmacokinet. 2010;49(10):633–59. doi:10.2165/11535960-000000000-00000.
- Betts A, Keunecke A, van STJ, van der GPH, Avery LB, Jones H, Berkhout J. Linear pharmacokinetic parameters for monoclonal antibodies are similar within a species and across different pharmacological targets: a comparison between human, cynomolgus monkey and hFcRn Tg32 transgenic mouse using a population-modeling approach. Mabs. 2018;10(5):751–64. doi:10.1080/19420862.2018.1462429.
- Kagan L. Pharmacokinetic modeling of the subcutaneous absorption of therapeutic proteins. Drug Metab Dispos. 2014;42(11):1890–905. doi:10.1124/dmd.114.059121.
- Davies B, Morris T. Physiological parameters in laboratory animals and humans. Pharmaceut Res. 1993;10(7):1093–95. doi:10.1023/A:1018943613122.
- Chimalakonda AP, Yadav R, Marathe P. Factors influencing magnitude and duration of target inhibition following antibody therapy: implications in drug discovery and development. Aaps J. 2013;15(3):717–27. doi:10.1208/s12248-013-9477-3.
- Tang C, Prueksaritanont T. Theoretical analysis of interplay of therapeutic protein drug and circulating soluble target: temporal profiles of ‘free’ and ‘total. Drug and Target Pharmaceut Res. 2011;28(10):2447. doi:10.1007/s11095-011-0471-0.
- Wang W, Wang E, Balthasar J. Monoclonal antibody pharmacokinetics and pharmacodynamics. Clin Pharmacol Ther. 2008;84(5):548–58. doi:10.1038/clpt.2008.170.
- Joyce AP, Wang M, Lawrence-Henderson R, Filliettaz C, Leung SS, Xu X, O’Hara DMOM. One pharmacokinetic profile: quantitative whole blood serial sampling for biotherapeutics. Pharmaceut Res. 2014;31(7):1823–33. doi:10.1007/s11095-013-1286-y.
- Adami E, Viswanathan S, Widjaja AA, Ng B, Chothani S, Zhihao N, Tan J, Lio PM, George BL, Altunoglu U, et al. IL11 is elevated in systemic sclerosis and IL11-dependent ERK signalling underlies TGFβ-mediated activation of dermal fibroblasts. Rheumatology Oxf Engl. 2021;60(12):5820–26. doi:10.1093/rheumatology/keab168.