
 ?Mathematical formulae have been encoded as MathML and are displayed in this HTML version using MathJax in order to improve their display. Uncheck the box to turn MathJax off. This feature requires Javascript. Click on a formula to zoom.
ABSTRACT
Multispecific therapeutic proteins come in a variety of formats, including bi- and tri-specific antibodies, dual-variable domain antibodies, and CrossMabs. These multivalent proteins are engineered to interact with multiple therapeutic target proteins with high specificity. Multi-domain proteins can be created by linking together a variety of high-affinity antibody fragments. The choice of protein domains and linkers not only affects the interactions of these molecules with therapeutic targets but also influences the intrinsic behavior in solution that affects their stability. The complexity of solution interactions may translate into developability and manufacturing challenges. Here, we use nuclear magnetic resonance (NMR) spectroscopy to study the solution behavior of a multivalent VHH molecule composed of three flexibly linked heavy-chain-only domains that show dramatic stabilization against thermal degradation in the presence of sucrose. A collection of NMR fingerprinting and profiling methods were used to simultaneously monitor the protein solution behavior and capture details of protein–excipient interactions. We provide a framework to characterize and begin to understand the role of molecular flexibility in protein stabilization with potential applications in the design of novel therapeutic protein scaffolds that include multivalent proteins, fusion proteins, antibody-drug conjugates, and proteins modified with flexible lipids.
Alphabetical list of abbreviations
Fab Fragment antigen-binding; Fc Fragment crystallizable; HMW High molecular weight; ∆HMW Difference between HMW species at stress temperature and 5°C controls; IgG Immunoglobulin G; mAbs Monoclonal antibodies; MV-VHH Multivalent VHH molecule with the format aC-L1-aC-L1-aD; NMR Nuclear magnetic resonance; scFv Single-chain fragment variable; SEC Size-exclusion chromatography; VHH Variable domain of Heavy chain of Heavy chain-only antibody
Introduction
Multivalent proteins consist of multiple domains, each of which binds to a specific target. Conventional monoclonal antibodies (mAbs) are exceedingly well-studied multivalent proteins. Each IgG isotype is composed of two antigen-binding F(ab)’ domains and one Fc domain. Each F(ab)’ binds to a single antigen, whereas the Fc region binds to Fc receptors in certain immune cells. The F(ab)’ and Fc regions are connected through a short flexible hinge. Conventional mAbs can be modified in a variety of ways to generate novel multivalent molecules. In one approach, antibodies with different specificities can be combined using a knobs-into-holes design to form multivalent bispecific mAbs (bsAbs) that retain the Fc region.Citation1 Using other methods, antibody fragments, such as antigen-binding fragments (Fab), single-chain variable fragments (scFv), or variable domains of the heavy chain of heavy chain-only antibody (VHH), can be connected in a single chain using flexible amino acid linkers to create complex molecules with multiple (and different) specificities and valencies.Citation2 The choice of protein domains and linkers can alter the biological effects of these molecules. For example, multivalent molecules can be used to achieve unique specificities, cross-link multiple receptors, and potentially provide an engineering approach to combination therapies. They can also exhibit novel solution behavior that can affect their stability and manufacturability.
Therapeutic proteins are formulated to achieve desirable solution stability profiles. This is true even for well-behaved, thoroughly characterized, highly “developable” mAb scaffolds. However, the developability of novel modalities is potentially much more uncertain. For conventional mAbs and novel scaffolds, a typical protein formulation includes active proteins, buffers, stabilizers (polyols, sugars, and antioxidants), surfactants, and other excipients, with the goal of maximizing physical and chemical stability to achieve acceptable shelf-life of the drug product. There is extensive literature correlating the impact of excipients on protein stability.Citation1,Citation3 Although, the general purpose of excipients is well defined, there is limited understanding of protein-excipient interactions in solution.
Protein–excipient interactions are generally considered to be weak, nonspecific and can involve multiple solution components. For example, arginine is reported to stabilize proteins against aggregation by binding to unfolded protein.Citation4 Arginine can, however, potentially bind to charged protein patches or aromatic side chains of folded proteins, perhaps even site-specifically.Citation5 Similar behavior can be anticipated for other amino acids. Excipients can have multiple effects that may or may not be specific. Surfactants, such as polysorbate 80 or polysorbate 20 have been shown to bind proteins in solution, affecting protein stability.Citation6,Citation7
Sugars such as sucrose and trehalose are thought to provide stabilization by preferential exclusion, driving proteins into a more conformationally compact structure. They improve conformational stability but have limited impact on colloidal stability of the protein.Citation8 Extensive literature has detailed the effect of sugars on protein stabilization during freeze-thawCitation9 and freeze-drying,Citation10 as well as in liquidCitation11 or lyophilized state.Citation12 The protection effect may lead to conformational changes that depend on the protein under investigation.Citation13
The overall impact of excipient addition on protein structure has been probed directly, by using circular dichroism or indirectly, by monitoring changes in melting temperatures or specific volumes.Citation14 However, a mechanistic understanding of protein–excipient interactions is still lacking. Moreover, the impact of protein structure on protein–excipient interactions is challenging to evaluate due to the lack of high-resolution analytical techniques that can simultaneously probe proteins as well as excipients. NMR spectroscopy is a powerful tool for this application, capable of providing detailed assessments of therapeutic protein structure,Citation15–17 interactions,Citation18–21 and solution behavior.Citation22 NMR structural fingerprints capture information about protein solution structure and conformation, as well as probe for site-specific interactions. Diffusion profiling and dynamics measurements are used to understand self-association, multimer assembly, aggregation, and the impact of sequence and formulation on molecular motions. An emerging NMR application solution is to study the details of therapeutic protein formulations.Citation23–26 NMR spectroscopy is perhaps the only method that is capable of simultaneously assessing weak, multi-component interactions while providing structure and dynamics details. In all experiments, the structural content for all mixture components is encoded in a simpleCitation1H NMR, i.e., folded proteins, buffers, sucroses, and surfactants can be detected and differentiated. Interaction details can be arrayed and analyzed with diffusion and relaxation data.
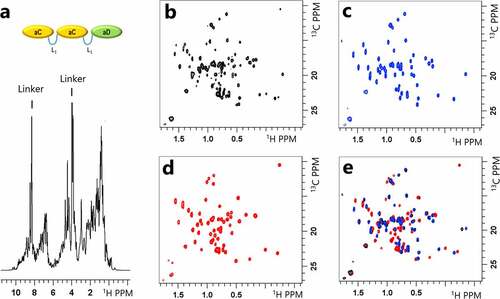
The therapeutic protein used in this study was derived from VHH antibody fragments aC and aD that bind with high affinity to antigens C and D, respectively, where C and D are proteins on the surface of T and B cells that have roles in immune system regulation. Each VHH is approximately 12–13 kDa in size. They are linked by a flexible 35-amino acid linker (L1) to form a 42 kDa multivalent VHH molecule (MV-VHH) with the format aC-L1-aC-L1-aD. The MV-VHH protein was investigated using NMR structural fingerprints, proton relaxation, and translational self-diffusion, as described below. Structural fingerprints and relaxation measurements assess the behavior of individual atoms and protein residues and can be affected by inter- and intra-molecular changes. Diffusion measurements are used to assess the bulk behavior of each molecule. A combination of methods is necessary to understand the changes that contribute to MV-VHH stabilization.
Results
A stress stability study (50°C) was carried out to evaluate the effects of increasing levels of sucrose on molecular stability, and the results were compared to a 5°C control. Increasing the sucrose content resulted in decreases in the high molecular weight (HMW) formation upon stress (). In the absence of sucrose, the ∆%HMW was highest at 18%. A concentration-dependent decrease in the ∆%HMW of 3.8% was observed at 20% sucrose concentration.
Figure 1. High molecular weight species generation upon thermal stress of MV-VHH at 50°C for 10 days. Sucrose concentration ranges from 0 to 20%. The difference between stressed and unstressed samples is plotted as the ∆%HMW as measured by ultra-performance size exclusion chromatography.(Figure 1) – Graph showing high molecular weight changes in stress as a function of increasing sucrose concentrations.
To better understand the sucrose-dependent changes in protein stability, the MV-VHH structure and domain interactions were assessed using 1D NMR profiling and 2D NMR structural fingerprinting. Examples of 1D NMR profiling and 2D NMR structural fingerprinting data are shown in , respectively. ProtonCitation1H peaks originating from the folded domains (aC and aD), flexible linker (L1), buffer, and sucrose can be identified yielding a low-resolution structural assessment of sucrose-dependent protein changes; additionally, changes to buffer components and interactions can potentially be assessed. High-resolution 2D fingerprints from natural abundanceCitation13C-edited sfHMQC data were also acquired to set a baseline to understand sucrose-dependent protein changes that include site-specific sucrose binding, the effect of sucrose addition on MV-VHH structure, and identify changes in domain interactions. shows 2D structural fingerprints of the individual folded domains compared to the 2D fingerprint of the intact MV-VHH. The monomer () and multimer peak positions () are nearly identical, as demonstrated in an overlay (), which strongly suggests that no structural changes occur upon linking and that the MV-VHH domains behave independently. More details can be found in Supplementary Figure S1.
Figure 2. (a) TheCitation1H NMR spectrum of the aC-L1-aC-L1-aD multivalent protein (MV-VHH). Peaks from different regions of the folded protein (sidechain methyls from 0 to 2 ppm, and backbone amide from 6 to 10 ppm), backbone amides of the flexible linker (sharp peaks at 8.5 ppm), excipients, water, and buffer can be detected and differentiated. (b-e): 2D 13C sfHMQC spectra of (b) MV-VHH, (c) aC VHH monomer, (d) aD VHH monomer and (e) an overlay of each monomer spectrum on top of the MV-VHH spectrum. The nearly identical spectra for aC and aD VHHs as monomers and linked multimers suggest that the aC and aD domains are non-interacting ‘beads on a string’ in the MV-VHH format.(Figure 2) – NMR spectra of individual domains of multivalent VHH protein overlaid on top of MV-VHH spectrum to show no interaction between the domains in solution.
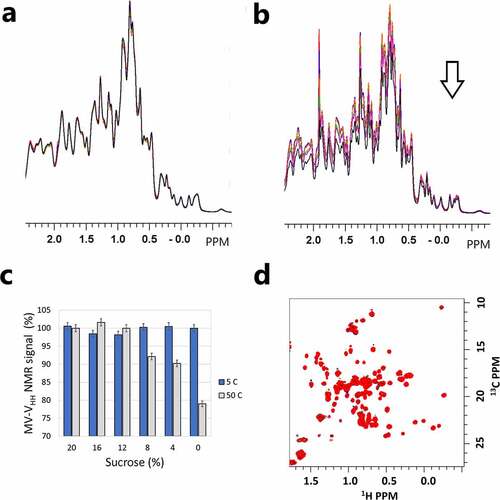
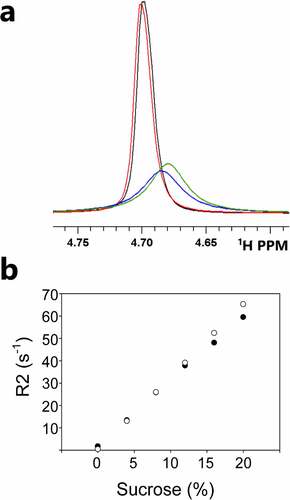
The impact of sucrose addition on MV-VHH structure, conformation, and interactions was explored using the reference data in . In , the spectra of the MV-VHH protein with 0%, 4%, 8%, 12%, 16%, and 20% sucrose were compared. The experimental data were collected at 27°C, 10 days after the samples were prepared and stored at 5°C (unstressed). Site-specific binding in these experiments would be detected as peak shifts or intensity variations. The identical traces in indicate that there are no detectable protein self-interactions or conformational changes due to sucrose addition. Intensity variations were, however, detected in the MV-VHH spectra () collected on samples with 0%, 4%, 8%, 12%, 16%, and 20% sucrose prepared and stored at 50°C (stress) for 10 days prior to data collection at 27°C. The loss of the MV-VHH protein signal indicates monomer loss in those samples and is consistent with HMW species formation detected by size-exclusion chromatography in . The monomer loss, as measured by NMR, is summarized in by comparing the integrals (3.3 to −1 ppm) for each spectrum in . shows higher resolution data fromCitation1H-Citation13C correlation spectroscopy, where MV-VHH spectra from unstressed samples with 0% (black) and 20% (red) sucrose are overlaid, showing that no large peak shifts can be detected. error bars are calculated from the integral variation of the 5°CCitation1H NMR data.
Figure 3. Effect of sucrose on MV-VHH protein behavior from NMR fingerprinting. (a) Overlay ofCitation1H NMR spectra of MV-VHH with 0 (black), 4 (magenta), 8 (green), 12 (Orange), 16 (blue) and 20% (red) sucrose show that NMR signals from the MV-VHH protein are not affected by sucrose addition with no thermal stress. (b) Overlay ofCitation1H NMR spectra of MV-VHH with 0, 4, 8, 12, 16 and 20% sucrose showing loss of NMR signal following thermal stress, consistent with monomer loss in forming high MW species in . (c) Variation of NMR signal intensities from 3a (gray) and 3b (blue). Intensities for unstressed samples vary by 1%, while thermal stress reduces the NMR signal by more than 20% for samples without sucrose. (d) Overlay of the MV-VHHCitation1H, Citation13C sfHMQC data with 0% (black) and 20% (red) sucrose with no stress. No direct protein–sucrose interaction was detected using 2D NMR fingerprints. No changes in 3b or 3c suggest the sucrose-dependent MV-VHH stabilization is not a result of site-specific binding and does not result in detectable changes in structure or conformation.(Figure 3) Overlayed NMR spectra of MV-VHH protein in the presence of different concentrations of sucrose showing no change in NMR fingerprint, which suggests there is no site-specific binding between protein and sucrose.
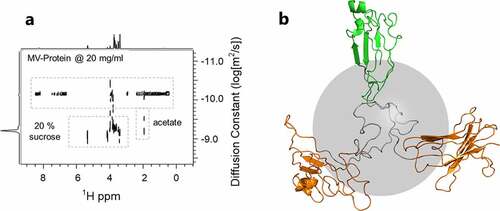
Interaction profiling was accomplished using a protein-enhanced diffusion-ordered spectroscopy (DOSY) experiment, . First, we collected translational self-diffusion data on the MV-VHH with 0% sucrose. The detection dimension of this data set is dominated by protein peaks, but an acetate signal was also identified at 1.9 ppm. From the MV-VHH diffusion data, a hydrodynamic radius, Rh, of 3.7 nm was calculated, whereas the aC and aD fragments had a hydrodynamic radius of 1.65 nm. These data indicate that the MV-VHH is in an extended conformation, which is consistent with the 2D 1H,Citation13C sfHMQC fingerprinting studies in , which found that the folded VHH domains are flexibly linked with minimal intramolecular interactions. The cartoon in is a PyMOLCitation27 model of the MV-VHH protein that incorporates NMR Rh determination, with non-interacting domain positioning. The protein structure is a homology model, created using the SWISS-model,Citation28 using the MV-VHH primary sequence. Rh was calculated with HullRad.Citation29 The aC VHHs are shown in orange, and the aD VHH is shown in green. The VHHs are joined by a flexible 35-residue linker shown in gray. The gray sphere (radius 2.8 nm) represents the extent of the surface anticipated from a compactly folded, single domain 42 kDa protein. Note that while our model for the MV-VHH protein is not compact, it is not completely extended, with a minimum interdomain distance ~30 Å
Figure 4. (a) The diffusion behavior of all protonated solution components can be monitored in situ under formulation conditions using a protein-enhanced DOSY experiment. (b) Model of a flexibly linked trivalent-VHH, with hydrodynamic radius Rh 3.7 nm. The gray sphere indicates the hydrodynamic radius of 2.8 nm expected for a compact, single domain 42 kDa protein.(Figure 4) – Diffusion behavior of protonated solution components (protein, sucrose, acetate buffer) along with model of flexibly linked trivalent VHH.
The effect of sucrose addition on the protein and buffer interactions was studied using the protein-enhanced DOSY experiment using protein samples that contain 4%, 8%, 12% 16%, and 20% sucrose. The effect of increasing sucrose concentration on sucrose self-diffusion can be assessed by monitoring the sucrose peak at 5.35 ppm, whereas the effect of sucrose addition on MV-VHH self-diffusion can be assessed by focusing on peaks in the protein methyl region (1–0 ppm). As expected from changes in the solution viscosity, the translational diffusion constants for both sucrose and MV-VHH decrease with increasing sucrose concentration. To determine the expected MV-VHH diffusion behavior due to viscosity, a sucrose correction factor was calculated from the observed sucrose Dt measurements, based on the observation that the slope of diffusion versus sucrose concentration for sucrose in the absence and presence of the protein was the same, and then applied to the protein Dt measurements (Supplementary Figure S2). When the correction factor is applied, the decrease in the MV-VHH diffusion in (■) can be entirely accounted for by the sucrose viscosity, resulting in a constant Dt (●) from which the MV-VHH hydrodynamic radius can be calculated. The calculated Rh, 3.7 nm, is constant in all data sets; no evidence of compaction can be detected in these experiments.
Figure 5. Sucrose-dependent diffusion behavior of MV-VHH and acetate. (a) Measured diffusion behavior of MV-VHH as a function of sucrose (■) and MV-VHH diffusion values corrected for sucrose viscosity (●). The hydrodynamic radius of the MV-VHH is constant and, when calibrated, is calculated to be 3.7 nm from the diffusion constant. (b) Diffusion behavior of acetate alone (●) and acetate in the presence of the MV-VHH (▴) shows the reduction of acetate–protein interactions at higher sucrose concentrations. ■ MV-VHH diffusion values are replotted from 5 A. Error bars for Log Dt diffusion data are very small (< 0.03) and have been left off for clarity.(Figure 5) Changes in diffusion behavior of MV-VHH as function of sucrose and that of acetate showing interaction between acetate and protein as a function of increasing sucrose concentration.
In these same samples and DOSY data sets, the NMR signal for acetate (1.9 ppm) allowed us to detect the diffusion behavior of 10 mM acetate (), which is dramatically different from sucrose diffusion behavior. In the buffer alone or together with sucrose, acetate diffuses rapidly (●) and is nearly out of the detection range for our protein-enhanced DOSY measurements, which use gradients to suppress small-molecule signals so that protein signals can be detected. In all samples with the MV-VHH protein, acetate diffusion (▴) is slower than in buffer-only samples and ranges between the MV-VHH diffusion rate (■) and free acetate diffusion rate (●). In experiments on protein in acetate buffer with no sucrose, acetate diffusion slows and nearly matches the protein diffusion rate, which is consistent with acetate-protein binding. The addition of sucrose to samples containing protein increases the acetate diffusion rate, trending toward the free diffusion rate with increasing sucrose, consistent with an increase in free acetate, and reduced acetate–protein interactions.
In previous sections, diffusion NMR experiments were used to understand excipient–protein interactions and calculate their effect on the MV-VHH hydrodynamic radius. We next used proton R1 and R2 NMR relaxation measurements to probe the effect of sucrose on MV-VHH motions. To compare the motions in different parts of the protein, R2 was measured for sidechain methyl (●) and backbone amides (▼) found in the core of the folded aC and aD domains, as well as linker amides (■) (). While anticipated trends of increasing aC and aD R2s with increasing sucrose were observed, two unanticipated results were obtained. First, an inflection point is reached at ~10% sucrose where the R2s originating from aC and aD atoms start increasing more dramatically. At 0% sucrose, the linker R2 in is consistent with greater flexibility than the methyl and aC and aD amide R2s, as expected. The sucrose-dependent linker R2 behavior is remarkable, trending lower with increasing amounts of sucrose, in opposition to the R2 behavior from the folded aC and aD domains; this is the second unanticipated result that suggests sucrose addition influences protein motions, preferentially reducing slow linker dynamics at higher sucrose concentrations.
Figure 6. Proton R2 relaxation data reveals changes in motion as a function of sucrose for aC and aD methyl groups, aC and aD amides (6.5–10 ppm), and L1 amides (8.5 ppm). (a)Citation1H R2 for different regions of the protein show distinct behavior in response to sucrose. (b) R1*R2 and R2/R1 reveal anisotropic behavior for different regions of the MV-VHH. Arrows show the direction of increasing sucrose concentration for each region. Dramatically different behavior is observed for the linker amides. Error bars are the mean squared error from an exponential fit to R1 and R2 data.(Figure 6) Proton R2 relaxation data show movement in distinct solution behavior of linker vs VHH domains.
As in the case of diffusion measurements, viscosity (η) also affects NMR relaxation measurements, noting that R1 ∝ 1/η while R2 ∝ η. A simple method to deconvolute the viscosity contribution to the study of protein NMR dynamics is to calculate the parameter R1*R2, which is viscosity independent, but highly sensitive to slow (ms-μs) motions and motional anisotropy. Plots of R1*R2 vs R2/R1, using the same data in , are shown in . These results show the same trends, suggesting that the effect of sucrose on protein relaxation data is to affect protein motions. The outcome of the relaxation studies is that significant differences in linker motions were detected by either viscosity-dependent R2 or by viscosity-independent R1*R2, and these effects can be accounted for by reduced ms-μs linker motions and/or conformational exchange effects for samples with increasing amounts of sucrose.
The use of the R1*R2 parameter is an example of factoring viscosity out of relaxation data to better understand the underlying motions. Another approach is to use the viscosity dependence in the diffusion data to calculate the expected effect of sucrose viscosity on protein NMR R2 rates. If the MV-VHH R2 rate is influenced primarily by rotational diffusion (tumbling), then R2 ~ ητc, where η is the solution viscosity and τc is the rotational correlation time; viscosity (η) can be measured directly by diffusion NMR or by viscometry. In , experimental measurement of MV-VHH R2 values (●) as a function of sucrose concentration are shown to be significantly lower than those derived from applying a simple viscosity correction factor to the data without sucrose (line). The significant differences can be accounted for by changes in internal motions that reduced ms-μ
Figure 7. MV-VHH methyl R2 shows changes in motions in response to sucrose. MV-VHH methyl R2 compared to expected R2 purely due to viscosity. The measured R2 data in the 20% sample are significantly lower (78s−1) than the anticipated 93s−1 expected from the viscosity differences, which can be related MV-VHH motional or conformational differences.(Figure 7) R2 changes in NMR as a function of sucrose concentration that cannot be attributed to viscosity along and arise due to potential motional or conformational differences with increase in sucrose concentration.
s motions and/or conformational exchange effects that can be related to protein unfolding.
The prevailing mechanism for sucrose-dependent protein stabilization is preferential exclusion, leading to protein hydration and stabilization.Citation30,Citation31 The expected change in protein hydration is challenging to directly measure experimentally, due to rapid water diffusion; no change in water occupancy is anticipated. Measurements of directly bound water cannot typically be distinguished from bulk water, except in examples of water that occupy internal cavities. Nonetheless, we can use observed changes to water-source interactions as a surrogate measurement for changes in water–protein interactions. The results of water R2Citation32 measurements are shown in . While water protons are broadened by sucrose interactions, they exhibit very little broadening (R2 is less than 1 s−1) in buffer alone and in buffer with protein. Differences in water R2 decay rates in sucrose-buffer solutions are compared to water R2 decay rates in sucrose-buffer-protein solutions in . At 20% sucrose, the water R2 value is reduced by 5 s−1 in the presence of protein. At 8% sucrose, the change in water R2 is less than 1 s−1. The trend in of lower-than-expected water R2 in the presence of 20% sucrose suggests an overall reduction of sucrose–water interactions, consistent with increased water–protein interactions associated with preferential protein hydration.
Figure 8. (a) Water proton broadening is observed for solutions of buffer (black), protein (red), protein and sucrose (blue) and sucrose (green). The water R2 is < 1 s−1 in protein and buffer samples with no sucrose. (b) Water proton R2 values as a function of sucrose for buffer-sucrose samples (○) and for buffer-sucrose-protein samples (●). Sucrose-dependent changes in water R2 values are attributed to increased water–protein interactions. Errors in fitting water R2 decay are very small (< 0.2 Hz) and are left off for clarity.(Figure 8) Monitoring protein–water interactions as a function of sucrose concentration.
Discussion
From a protein engineering perspective, molecules with multiple well-defined binding domains can be produced by a wide variety of strategies.Citation33 In one approach, Fc-directed modifications in traditional IgG mAbs can lead to bispecific mAbs with improved properties.Citation34 Unique scaffolds can be created by linking together antibody fragments or small protein scaffolds that have been evolved or designed to yield high-affinity target/antigen interactions.Citation35 Due to their smaller size, architecture and lack of Fc binding, novel therapeutic protein scaffolds, such as VHH fragments can potentially bind to targets that are difficult for traditional antibodies to reach, for example, providing access to regions of tumor micro-environments. Multivalent molecules engineered from novel scaffolds can potentially bind to and crosslink multiple cell surface receptors to enhance signaling in the same cell; alternatively, different specificities can be selected to crosslink different cell types. Multiple epitopes on the same target protein can potentially be engaged. Moreover, MV-VHH proteins potentially offer an engineering approach to combination therapies, delivering multiple therapeutic proteins with different mechanisms.
While many of the above applications have exciting therapeutic potential, combining novel protein scaffolds into multivalent therapeutic proteins will likely present different stability, developability and manufacturing challenges when compared with traditional mAbs. The MV-VHH molecule in this study was selected for clinical development based on its biological efficacy, to which linker length and composition were contributing factors. Only this molecule is produced in the large quantities necessary for formulation development. Purification and formulation behavior that was observed for certain multivalent VHH molecules has led us to study these molecules in more detail. Our method-of-choice to study the sucrose-dependent stabilization of the MV-VHH molecule has been NMR spectroscopy. All molecules in the formulated protein sample can be studied together; protein–protein and protein–excipient interactions can be studied simultaneously. Additional advantages are that the solution NMR measurements are made in situ; formulated protein samples need not be diluted, frozen, heated, or digested; and no manipulation is necessary or desired. Measurements are made on the entire formulation (a mixture of proteins and excipients) rather than the active pharmaceutical ingredient (in this case, the MV-VHH protein). Most importantly, NMR allows detection of changes to protein structure, conformation, and dynamics.
Here, we present a method to assess protein–excipient interactions in therapeutic formulations using NMR spectroscopy. Structural profiling was used to capture the protein’s solution conformation and higher-order structure and to probe for site-specific interactions. Diffusion profiling was used to assess protein Brownian motion, as well as to delineate multi-component intermolecular interactions between all solution components. R2 measurements provide information on local motions and interactions.
In our initial studies, a combination of NMR characterization techniques revealed MV-VHH domains aC and aD to be flexibly linked with no observable domain interactions. No evidence of site-specific sucrose–protein interaction, no protein conformational changes, and no changes to VHH-VHH interactions were detected. Sucrose addition produced MV-VHH protein translational diffusion changes that were consistent with sucrose viscosity; no direct change in MV-VHH hydrodynamic radius was detected. In these same data sets, sucrose and acetate (buffer) diffusion can also be measured. Slower small-molecule diffusion is expected when interacting with larger molecules. Sucrose was found to have no interactions with MV-VHH, consistent with preferential sucrose exclusion resulting in protein hydration. Acetate–protein interactions were clearly detected in samples with no sucrose; acetate–protein interactions were reduced by increasing sucrose concentrations. Increased hydration then results in acetate displacement from the MV-VHH molecule. Direct water R2 measurements support an increase in protein hydration as a function of increasing sucrose concentrations. Each NMR method has the potential to detect sucrose-dependent changes in protein interactions or behavior. The use of multiple NMR methods helps to identify unknown attributes, in this case linker motions, that can be correlated with other differences, e.g., hydration changes and acetate interactions, to help build a better understanding of the behavior of a single protein.
Key insights were revealed in studies of MV-VHH dynamic behavior. Sucrose-dependent changes in protein dynamics were measured by R2 relaxation studies in which linker and VHH atoms could easily be distinguished. Protein R2 measurements indicate a reduction of slow VHH domain motions expected from viscosity alone. L1-linker dynamics were profoundly different from folded domain motions; samples with higher amounts of sucrose showed faster linker dynamics, clearly trending in the opposite direction expected from measured solution viscosity.
Sucrose-stabilized MV-VHH was determined to be structurally and conformationally the same as MV-VHH with no sucrose. Changes in other data sets suggest that sucrose is acting indirectly (modulating water-protein and acetate–protein interactions) to affect the dynamic behavior of the L1 linker and folded domains. By combining all of the data, we can infer that protein motions associated with aggregation are quenched by hydration. These same motions might also be present in VHH; they are perhaps amplified in the linker, which is not stabilized by protein folding and is completely accessible to solvent. While these studies involved a specific MV-VHH protein, we anticipate that the results are generalizable and highlight the importance of modulating specific protein motions to improve protein stability. A more complete understanding of the linker's influence on multivalent VHH stability will require additional studies, for example, that could include the effect of linkers with different lengths and compositions. We further anticipate that studies like these can be valuable to understand details of protein dynamics and protein–excipient interactions in a wide range of bioconjugated molecules that include antibody-drug-conjugates and an ever-widening array of multivalent, multispecific proteins where linker behavior will affect overall stability.
Materials and Methods
The MV-VHH protein was recombinantly produced in-house using mammalian expression systems and standard purification training. Glacial acetic acid, sodium acetate trihydrate, and sucrose were procured from Sigma-Aldrich (St Louis, MO). Polysorbate 80 (PS80) was purchased from Croda (Edison, NJ). MV-VHH was dialyzed overnight into acetate buffer at pH between 4.6 and 5.5 with polysorbate 80 and 0%, 4%, 8%, 12%, 16%, or 20% sucrose. Samples were filtered using 0.22 µm filter (EMD Millipore Burlington, MA) and used for NMR analysis. The final samples contained 20 mM MV-VHH protein in a 10 mM, acetate buffer. About 6.25% D2O was added as a lock solvent to all samples; no internal reference was used. NMR studies were performed on a Bruker Avance HD 800 spectrometer equipped with a 5 mm TCI cryoprobe. 2D fingerprinting data were acquired using a 5 mm sample tube, 500 µL sample volume; all other data were acquired using a 3 mm sample tube, 160 µL sample volume.
Ultra-Performance Size Exclusion Chromatography
Waters BEH200 column (4.6 × 150 mm) was used for ultra-performance size-exclusion chromatography. Samples were diluted to 5 mg/mL and injected using 50 µL loop. Mobile phase consisted of 50 mM phosphate buffer with high levels of arginine with flow rate of 0.5 mL/min. A wavelength of 280 nm was used for detection, and the chromatograms were integrated using Empower2 software (Waters Corporation, MA).
Profiling and Structural Fingerprinting
A simpleCitation1H NMR spectrum of formulated proteins provides a rapid, low-resolution assessment of protein structural changes. Initial data consisted of a protein profileCitation23 that uses a diffusion filter to reduce the NMR signal from sucrose and buffer molecules. In the diffusion filtered proton NMR profile, all proton-containing solution components were identified by theirCitation1H NMR signals. In addition, protons from the protein backbone, side chain, and linker were identified by their distinctive chemical shifts. For concentrated, well-behaved proteins,Citation1,,Citation13C sfHMQC data were acquired for the protein methyl groups to provide a higher resolution assessment of ligand binding and/or structural changes. TheCitation1,,Citation13C sfHMQC data sets in this study were collected using signals from the naturally abundantCitation13C isotope, without enrichment.
Protein-enhanced DOSY
Pulsed magnetic field gradient NMR experiments were used to measure the translational diffusion of multiple molecules in complex mixtures. DOSY NMR experiments are commonly used to separate the signals of each proton-containing solution component by its protonCitation1H NMR signals and translational diffusion constant (Dt). The decay of theCitation1H NMR signal for each molecule in a gradient magnetic field yields the translational diffusion constant for each molecule. In NMR measurements of formulated proteins,Citation20 DOSY experiments can yield, simultaneously, the diffusion constants of the protein and other solution components, such as PEG, sucrose, buffer, and water, and the effects of solution viscosity can be deconvoluted. Diffusion NMR experiments are typically performed with a linear magnetic field gradient that varies from an initial value of 5% to a final value of 95%. A modified protein-enhanced DOSY experiment was made by starting the initial gradient magnetic field at 30%, which efficiently reduced the excipient and water signals, leaving mostly the protein DOSY NMR signal. From the diffusion data, an effective protein radius of hydration (Rh) can be calculated by:
More details are discussed in Supplementary Figure S3
Diffusion filtered proton R1 and R2
Proton relaxation measurements were used to probe molecular motions ranging from nanosecond to millisecond timescales. A conventional inversion-recovery experimental measurement, with relaxation delays from 1 ms to 2 sec, was modified with a diffusion filter to produce protein-enhanced R1 measurement that reduces theCitation1H NMR signals from all non-protein buffer components. The conventional Carr-Purcell-Meiboom-Gill (CPMG) proton-R2 measurement (effective vCPMG = 500 s−1) was also modified with a diffusion filter to reduce theCitation1H NMR signals from all non-protein buffer components.Citation22 At low protein concentration, proton-R2 relaxation rates are proportional to the molecule’s volume (R2 α tc = 4πηrCitation3/kT) but are also strongly affected by motional anisotropy and intermolecular interactions. These anisotropic components were qualitatively separated using a R1*R2 parameter,Citation36 and, more recently, R2Dt correlationsCitation22 have been used to assess and differentiate intermolecular interactions and internal/external motions. Additional experimental details, processing parameters, and R1 and R2 pulse sequences can be found in Supplementary Methods.
Thermal stress stability study
A 20 mg/mL sample of the MV-VHH protein with different levels of sucrose was exposed to a stress temperature of 50°C for 10 days, and corresponding unstressed controls were stored at 5°C for the duration of the study. The samples were analyzed using size-exclusion chromatography, and the HMW and main peaks were calculated using Empower software (Waters Corporation, MA). The reported ∆HMW values are difference between HMW at stress temperature and 5°C controls.
Viscosity measurements
Viscosity measurements were performed using m-VROC viscometer (Rheosense, San Ramon, CA). The instrument was equilibrated at 20°C, and all viscosity measurements were carried out at the same temperature. Fifty percent glycerol was used as the viscosity standard (5 cP). Each sample was measured 10 times; the first four replicates were discarded, and the last six measurements were averaged to report viscosity for the sample. Both placebo and protein solutions were measured in a similar manner.
Supplemental Material
Download Zip (2.1 MB)Disclosure statement
No potential conflict of interest was reported by the author(s).
Supplementary material
Supplemental data for this article can be accessed online at https://doi.org/10.1080/19420862.2022.2124902
Additional information
Funding
References
- Manning MC, Matsuura JE, Kendrick BS, Meyer JD, Dormish JJ, Vrkljan M, Ruth JR, Carpenter JF, Sheftert E. Approaches for increasing the solution stability of proteins. Biotechnol Bioeng. 1995;48:506–10. PMID:18623515. doi:10.1002/bit.260480513.
- Bannas P, Hambach J, Koch-Nolte F. Nanobodies and nanobody-based human heavy chain antibodies as antitumor therapeutics. Front Immunol. 2017;8:1603. PMID:29213270. doi:10.3389/fimmu.2017.01603.
- Kheddo P, Cliff MJ, Uddin S, van der Walle Cf, Golovanov AP, van der Walle CF. Characterizing monoclonal antibody formulations in arginine glutamate solutions using 1 H NMR spectroscopy. mAbs. 2016;8:1245–58. PMID:2016:1481312. doi:10.1080/19420862.2016.1214786.
- Arakawa T, Tsumoto K. The effects of arginine on refolding of aggregated proteins: not facilitate refolding, but suppress aggregation. Biochem Biophys Res Commun. 2003;304:148–52. PMID:12705899. doi:10.1016/s0006-291x(03)00578-3.
- Borwankar AUD, J B, Twu A, Hung JJ, Dinin AK, Wilson BK, Yue J, Maynard JA, Truskett TM, Johnston KP. Viscosity reduction of a concentrated monoclonal antibody with arginine HCl and arginine glutamate. Ind Eng Chem Res. 2016;55:10. doi:10.1021/acs.iecr.6b02042.
- Hoffmann C, Blume A, Miller I, Garidel P. Insights into protein-polysorbate interactions analysed by means of isothermal titration and differential scanning calorimetry. Eur Biophys J. 2009;38:557–68. PMID:19189101. doi:10.1007/s00249-009-0404-6.
- Wang W, Wang YJ, Wang DQ. Dual effects of Tween 80 on protein stability. Int J Pharm. 2008;347:31–38. PMID:17692480. doi:10.1016/j.ijpharm.2007.06.042.
- Arakawa T, Timasheff SN. Stabilization of protein structure by sugars. Biochemistry. 1982;21:6536–44. PMID:7150574. doi:10.1021/bi00268a033.
- Hauptmann A, Podgorsek K, Kuzman D, Srcic S, Hoelzl G, Loerting T. Impact of buffer, protein concentration and sucrose addition on the aggregation and particle formation during freezing and thawing. Pharm Res. 2018;35:101. PMID:29556730. doi:10.1007/s11095-018-2378-5.
- Mensink MA, Frijlink HW, van der Voort Maarschalk K, Hinrichs WL. How sugars protect proteins in the solid state and during drying (review): mechanisms of stabilization in relation to stress conditions. Eur J Pharm Biopharm. 2017;114:288–95. PMID:28189621. doi:10.1016/j.ejpb.2017.01.024.
- Shimizu M, Nagashima HH,K, Suzuki T, SUZUKI T. Egg yolk antibody (Ig Y) stability in aqueous solution with high sugar concentrations. J Food Sci. 1994;59:10. doi:10.1111/j.1365-2621.1994.tb08122.x.
- Jones LS, Randolph TW, Kohnert U, Papadimitriou A, Winter G, Hagmann ML, Manning MC, Carpenter JF. The effects of tween 20 and sucrose on the stability of anti-L-selectin during lyophilization and reconstitution. J Pharm Sci. 2001;90:1466–77. PMID:11745706. doi:10.1002/jps.1098.
- Lee JC, Timasheff SN. The stabilization of proteins by sucrose. J Biol Chem. 1981;256:7193–201. PMID:7251592. doi:10.1016/S0021-9258(19)68947-7.
- Kamerzell TJ, Esfandiary R, Joshi SB, Middaugh CR, Volkin DB. Protein-excipient interactions: mechanisms and biophysical characterization applied to protein formulation development. Adv Drug Deliv Rev. 2011;63:1118–59. PMID:21855584. doi:10.1016/j.addr.2011.07.006.
- Arbogast LW, Brinson RG, Marino JP. Mapping monoclonal antibody structure by 2D 13C NMR at natural abundance. Anal Chem. 2015;87:3556–61. doi:10.1021/ac504804m. PMID:2015:354379.
- Majumder S, Bhattacharya DS, Langford A, Ignatius AA. Utility of high resolution 2D NMR fingerprinting in assessing viscosity of therapeutic monoclonal antibodies. Pharm Res. 2022;39:529–39. PMID:35174433. doi:10.1007/s11095-022-03200-6.
- Quinternet M, Starck J-P, Delsuc M-A, Kieffer B. Heteronuclear NMR provides an accurate assessment of therapeutic insulin’s quality. J Pharm Biomed Anal. 2013;78-79:252–54. PMID:2013:504829. doi:10.1016/j.jpba.2013.02.016.
- Aubin Y, Hodgson DJ, Thach WB, Gingras G, Sauve S. Monitoring effects of excipients, formulation parameters and mutations on the high order structure of filgrastim by NMR. Pharm Res. 2015;32:3365–75. PMID:26043856. doi:10.1007/s11095-015-1713-3.
- Bramham JE, Podmore A, Davies SA, Golovanov AP. Comprehensive assessment of protein and excipient stability in biopharmaceutical formulations using (1)H NMR spectroscopy. ACS Pharmacol Transl Sci. 2021;4:288–95. PMID:33659867. doi:10.1021/acsptsci.0c00188.
- Falk BT, Liang Y, McCoy MA. Diffusion profiling of therapeutic proteins by using solution NMR spectroscopy. ChemBioChem. 2019;20:896–99. PMID:30515922. doi:10.1002/cbic.201800631.
- Singh SM, Bandi S, Jones DNM, Mallela KMG. Effect of polysorbate 20 and polysorbate 80 on the higher-order structure of a monoclonal antibody and Its Fab and Fc fragments probed using 2D nuclear magnetic resonance spectroscopy. J Pharm Sci. 2017;106:3486–98. PMID:28843351. doi:10.1016/j.xphs.2017.08.011.
- Falk BT, Liang Y, Bailly M, Raoufi F, Kekec A, Pissarnitski D, Feng D, Yan L, Lin S, Fayadat-Dilman L, et al. NMR assessment of therapeutic peptides and proteins: correlations that reveal interactions and motions. ChemBioChem. 2020;21:315–19. PMID:31283075. doi:10.1002/cbic.201900296.
- Poppe L, Jordan JB, Lawson K, Jerums M, Apostol I, Schnier PD. Profiling formulated monoclonal antibodies by 1H NMR spectroscopy. Anal Chem. 2013;85:9623–29. doi:10.1021/ac401867f. PMID:2013:1401415.
- Poppe L, Knutson N, Cao S, Wikstrom M. In situ quantification of polysorbate in pharmaceutical samples of therapeutic proteins by hydrodynamic profiling by NMR spectroscopy. Anal Chem. 2019;91:7807–11. PMID:31117409. doi:10.1021/acs.analchem.9b01442.
- Franks J, Glushka JN, Jones MT, Live DH, Zou Q, Prestegard JH. Spin diffusion editing for structural fingerprints of therapeutic antibodies. Anal Chem. 2016;88:1320–27. PMID:26653763. doi:10.1021/acs.analchem.5b03777.
- Elliott KW, Delaglio F, Wikstrom M, Marino JP, Arbogast LW. Principal component analysis of 1D 1H diffusion edited NMR spectra of protein therapeutics. J Pharm Sci. 2021;110:3385–94. PMID:34166704. doi:10.1016/j.xphs.2021.06.027.
- The PyMOL Molecular Graphics System, Version 1.8 Schrödinger, LLC.
- Waterhouse A, Bertoni M, Bienert S, Studer G, Tauriello G, Gumienny R, Heer FT, de Beer TAP, Rempfer C, Bordoli L, et al. Swiss-MODEL: homology modelling of protein structures and complexes. Nucleic Acids Res. 2018;46:W296–W303. PMID:29788355. doi:10.1093/nar/gky427.
- Fleming PJ, Fleming KG. HullRad: fast calculations of folded and disordered protein and nucleic acid hydrodynamic properties. Biophys J. 2018;114:856–69. PMID:29490246. doi:10.1016/j.bpj.2018.01.002.
- Arakawa T, Timasheff SN. Preferential interactions of proteins with salts in concentrated solutions. Biochemistry. 1982;21:6545–52. PMID:7150575. doi:10.1021/bi00268a034.
- Sudrik CM, Cloutier T, Mody N, Sathish HA, Trout BL. Understanding the role of preferential exclusion of sugars and polyols from native state IgG1 monoclonal antibodies and its effect on aggregation and reversible self-association. Pharm Res. 2019;36:109. PMID:31127417. doi:10.1007/s11095-019-2642-3.
- Taraban MB, DePaz RA, Lobo B, Yu YB. Water proton NMR: a tool for protein aggregation characterization. Anal Chem. 2017;89:5494–502. PMID:28440620. doi:10.1021/acs.analchem.7b00464.
- Spiess C, Zhai Q, Carter PJ. Alternative molecular formats and therapeutic applications for bispecific antibodies. Mol Immunol. 2015;67:95–106. PMID:25637431. doi:10.1016/j.molimm.2015.01.003.
- Von Kreudenstein TS, Escobar-Carbrera E, Lario PI, D’Angelo I, Brault K, Kelly J, Durocher Y, Baardsnes J, Woods RJ, Xie MH, et al. Improving biophysical properties of a bispecific antibody scaffold to aid developability: quality by molecular design. mAbs. 2013;5:646–54. PMID:23924797. doi:10.4161/mabs.25632.
- Chanier T, Chames P. Nanobody engineering: toward next generation immunotherapies and immunoimaging of cancer. Antibodies (Basel). 2019;8 PMID:31544819. doi:10.3390/antib8010013.
- Kneller JM, Lu M, Bracken C. An effective method for the discrimination of motional anisotropy and chemical exchange. J Am Chem Soc. 2002;124:1852–53. PMID:2002:101697. doi:10.1021/ja017461k.