
 ?Mathematical formulae have been encoded as MathML and are displayed in this HTML version using MathJax in order to improve their display. Uncheck the box to turn MathJax off. This feature requires Javascript. Click on a formula to zoom.
ABSTRACT
Monoclonal antibody (mAb) aggregation can present major challenges for the development of biotherapeutics. An understanding of the molecular mechanisms of mAb aggregation is highly desirable both because it allows the performance of informed risk assessments regarding the criticality of mAb aggregates and because it may facilitate rational stabilization of aggregation prone regions. Here, we report the generation and isolation of dimer species of an IgG4 mAb (mAb1) that were present in stressed material under differing levels of temperature stress. We demonstrate the power of combining established higher order techniques with non-routine analysis, such as small-angle X-ray scattering, hydrogen/deuterium exchange mass spectrometry (HDX-MS), and protein conformational array enzyme-linked immunosorbent assay (PCA ELISA), and show that dimer species formed under temperature stress are structurally distinct from those present in unstressed mAb1. Specifically, stress-induced dimers are shown to adopt a more elongated conformation with a greater degree of unfolding when compared to native dimers. Analysis by HDX-MS and PCA ELISA, supported by in silico shape and charge molecular docking, enabled the identification of residues in both the variable and constant domains that appear to play a significant role in the dimerization of mAb1. Furthermore, we show that dimers formed under temperature stress are significantly more long-lived than those present in unstressed mAb1. We also present evidence that mAb1 dimers can behave as aggregation nuclei, and that dimers produced under high-temperature stress do so to a greater extent. This work presents an advancement in our understanding of the molecular mechanisms of mAb aggregation and highlights the importance of structural characterization of dimer species during the development of mAb biotherapeutics.
Abbreviations: 2DSA: 2-Dimensional Spectrum Analysis; CD: Circular Dichroism; CDR: Complementarity-Determining Region; CQA: Critical Quality Attribute; DSC: Differential Scanning Calorimetry; FTIR: Fourier Transform Infrared spectroscopy; HDX-MS: Hydrogen/Deuterium Exchange Mass Spectrometry; HIC: Hydrophobic interaction chromatography; HMWS: High Molecular Weight Species; HOS: Higher Order Structure; mAb: Monoclonal Antibody; MD: Molecular Dynamics PCA; ELISA: Protein Conformational Array Enzyme-Linked Immunosorbent Assay; Rg: Radius of Gyration; SAXS: Small Angle X-ray Scattering; SE-HPLC: Size Exclusion High Performance Liquid Chromatography; SV-AUC: Sedimentation Velocity-Analytical Ultracentrifugation
Introduction
Monoclonal antibodies (mAbs) are highly successful therapeutic agents used to treat a plethora of diseases. In recent years, there has been tremendous growth in the use of mAbs as therapeutics and, as of 2018, the total global antibody therapeutic market value was estimated at $115.2 billion.Citation1 However, mAbs are highly complex molecules that are subject to many possible degradations and formations of micro-heterogeneities. Therefore, mAbs can present several major challenges throughout development. Among the most significant of these is the propensity for mAbs to aggregate.
The term aggregate does not describe a homogenous species, and aggregates can have disparate properties, including being small (dimers) or large (visible precipitates), soluble or insoluble, reversibly or irreversibly formed, and non-covalently or covalently attached.Citation2 Protein aggregation is often the consequence of protein–protein interactions, a process influenced by diffusion rate and geometric constraints of the interaction sites. Factors including protein concentration change, viscosity, ionic strength, pH, and temperature influence aggregation rates.Citation3
Aggregation and self-association in protein-based biotherapeutics are critical quality attributes (CQAs) that are controlled by the manufacturing process. Aggregates have the potential to elicit immune reactions, including neutralizing anti-drug antibodies, which can diminish the drug’s efficacy upon subsequent dosing. Aggregation can have significant deleterious effects on the efficacy and safety of therapeutic mAbs. For example, aggregation may block the complementarity-determining regions (CDRs) from binding to the target molecule.Citation4,Citation5 In addition, there is evidence that aggregated mAbs may be cleared at faster ratesCitation6 and that they may induce an immunogenic response.Citation7 The immunogenicity of aggregates is thought to arise from the following processes: formation of neo epitopes through new quaternary structures, unfolding during aggregation leading to new cryptic epitopes that were previously buried, or the formation of repetitive complexes to which the immune system is especially sensitive, as repetitive motifs are a feature of microbial cells.Citation8 Therefore, the prevention and/or mitigation of aggregation is a key goal during the development of therapeutic mAbs.
Understanding mAb aggregation at a molecular level is highly desirable for several reasons. Characterizing protein aggregates present in the therapeutic of interest is crucial when defining CQAs and control strategy.Citation9 With a greater understanding of the structure and properties of the aggregates present, it is possible to undertake more informed risk assessments when defining their criticality. In addition, if the molecular mechanisms underpinning aggregation can be understood, then this can inform the rational design of aggregation-resistant sequences or formulation buffers.Citation10–12
Antibody aggregation is understood to progress via several parallel and competing pathways and has been extensively reviewed elsewhere.Citation13,Citation14 Regardless of the dominating pathway for aggregation of a given molecule, dimer formation is among the first steps of aggregation. This may be via the association of two natively folded monomers or it may be preceded by the partial unfolding of monomers, leading to the adoption of a non-native, more aggregation-prone structure. Dimer formation may be reversible or irreversible, depending on the nature of the interactions between the two monomers. Dimers and other small oligomers can then go on to precipitate the formation of larger aggregates.
Dimer species are typically the main aggregate present in mAbs and so their structural characterization is of particular interest. Different conformations of mAb dimer have been reported in literature, including compact and elongated dimer species reported by Plath et al.Citation15 The localization of dimer interface sites depends on both the sequence of the mAb of interest and the conditions under which the dimers are formed. There are examples of dimer formation being driven by Fab–Fab,Citation16,Citation17 Fc–Fc,Citation18,Citation19 and Fab–FcCitation20 interactions. Hydrophobic interactions are often important in driving aggregation, and several surface-exposed hydrophobic regions have been identified in IgGs, mostly within the hinge and loop regions.Citation21
Exposure to elevated temperature is among the major stresses that may be experienced by mAbs throughout their manufacture, storage, shipping, and administration.Citation22 Therefore, the effects of elevated temperature on protein degradation (both via aggregation and other degradation pathways) are commonly assessed in both stability studies and forced degradation studies.Citation23 It is well understood that aggregation proceeds via different pathways at elevated temperatures.Citation24–26 However, the molecular mechanisms that underpin this difference remain to be fully elucidated. Several studies have shown that exposure to elevated temperature will lead to a greater proportion of (partially) unfolded protein, and hence aggregation will proceed via exposure of aggregation hotspots.Citation27
An understanding of the long-term behavior of dimer species once formed is of high importance. According to current models for mAb aggregation,Citation14 dimers may either dissociate to monomer, remain stable as dimers, or may induce further aggregation by acting as aggregation seeds. Which of these pathways dominates clearly has substantial implications for the aggregation propensity of the mAb of interest. The fate of a given mAb dimer is likely to be driven by the nature of the interactions holding the dimer together, as well as the overall structure of the dimer species. The reversibility of mAb oligomer species has been studied previously, often using different buffer compositions to investigate the relative contributions of both charge and other interactions.Citation20,Citation28 However, other studies have reported the presence of highly stable or covalent dimers.Citation4 It has been observed in several cases that “seeding” proteins with oligomers can drive subsequent formation of larger aggregates.Citation29,Citation30 However, to our knowledge the impact of different dimer forms on driving subsequent aggregation of mAbs has been the subject of only a limited number of studies.Citation31 In this study, we aimed to investigate the links between stress condition, dimer conformation, and ultimately dimer reversibility and “aggregation seed” behavior.
Higher order structure (HOS) determination is challenging for large proteins such as antibodies. This is even more challenging for antibody aggregates due to their increased complexity arising from multiple possible orientations and interactions between monomers. Typically, techniques such as differential scanning calorimetry (DSC) and circular dichroism (CD) are used to monitor protein structure changes. However, these methods only provide information relating to global changes in HOS with low resolution. In this study, in order to obtain higher resolution structural information, we used the protein conformational array (PCA) enzyme-linked immunosorbent assay (ELISA) as a complementary technique to determine protein HOS and dimer interface sites. This method can detect epitopes on an antibody using a panel of 34 antibodies raised against peptides derived from the full-length protein sequence of eight commercial mAb drugs.Citation32 In addition, we obtain complementary information using hydrogen/deuterium exchange mass spectrometry (HDX-MS), which has been used previously to determine dimer interaction sites.Citation33
Additionally, we used a combination of biophysical tools such as small-angle x-ray scattering (SAXS) performed using a high-intensity x-ray synchrotron source. This technique results in diffraction from which a scattering pattern can be obtained, giving information on size and shape of proteins. Analytical ultracentrifugation (AUC) performed at high centrifugal forces allowed us to monitor sedimentation events in real time, giving information on shape and heterogeneity. To gain further understanding into dimer structures, structural information obtained from SAXS, AUC, and PCA ELISA were combined with structures generated using homology modeling and molecular dynamics (MD) simulation.
The current work describes the generation and isolation of three different dimer populations from an IgG4 mAb (mAb1) that had been exposed to three different storage conditions: 1) storage at < −60°C since manufacture, 2) incubation for 1 month at 37°C, and 3) incubation for 1 month at 50°C. The structure of the dimers was then interrogated using several novel and complementary techniques to determine their HOS. In addition, their properties, such as reversibility and propensity to induce further aggregation, were studied.
Results
Generation and isolation of dimers from temperature-stressed mAb1
In order to generate different dimer populations, mAb1 was incubated at 37°C and 50°C for one month. To assess the extent of dimer formation under these different incubation temperatures; the samples were analyzed by size exclusion high performance liquid chromatography (SE-HPLC). mAb1 that had been stored at ≤-60°C since manufacture was also analyzed by SE-HPLC. The resulting chromatograms are shown in , and the proportions of the different species present are shown in . Incubation at both 37°C and 50°C resulted in an increase in dimer. Unstressed mAb1 contains <1% dimer, whereas after temperature stress this increases to 1.6 and 2.4% at 37 and 50°C, respectively. In addition, for the sample incubated at 50°C there is an increase in larger high molecular weight species (HMWS), indicating that a different aggregation pathway is occurring at this temperature. The dimer species from each of the three samples were then isolated by SEC. The dimers isolated from frozen mAb1, mAb1 incubated at 37°C for 1 month, and mAb1 incubated at 50°C for 1 month are hereafter referred to as “native dimers,” “37°C dimers,” and “50°C dimers,” respectively. The isolated dimers were re-analyzed by SEC to assess their purity. The resulting chromatograms are shown in , and the proportions of the different species present are shown in . For all three samples, significant enrichment of dimer was achieved, with a purity of 87, 89 and 71% for native dimers, 37°C dimers, and 50°C dimers, respectively.
Figure 1. Generation and isolation of dimers from mAb1. a) SEC chromatograms for unstressed mAb1, and mAb1 after incubation for 1 month at 37°C and 50°C. b) SEC chromatograms of isolated dimers. c) SDS-PAGE analysis of the dimer samples. SM = starting material (mAb1), ND = Native dimers, 37 = 37°C dimers, 50 = 50°C dimers. Samples were analyzed non-reduced and reduced. Monomer is shown in green boxes, SDS-resistant dimer is shown in white boxes. Under reduced conditions, LC and HC are shown in blue and red boxes, respectively, with non-reducible species shown in purple boxes.
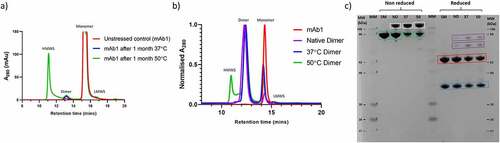
Table 1. Summary of SE-HPLC and SDS-PAGE.
The isolated dimers were analyzed by SDS-PAGE ( and ). We noted some differences between the apparent molecular weight observed by SDS-PAGE and the theoretical molecular weights for mAb1 (LC ~ 25 kDa, HC ~ 50 kDa, Monomer ~ 150 kDa). Migration on an SDS-PAGE gel can be influenced by many other factors than molecular weight, such as the pI of the molecule, folding state, and amount of SDS bound. In addition, the use of pre-stained molecular weight standards can result in discrepancies between apparent and theoretical molecular weight.Citation34 Despite this, given the highly purified nature of these samples it was possible to assign the species present based on their relative migration. For all three dimer samples, analysis under non-reduced conditions revealed the presence of SDS-resistant dimer, the majority of which reduce to heavy chain and light chain when analyzed under reducing conditions. This suggests that a proportion of the dimer species in all three samples may be in part held together via disulfide bonds. This is in good agreement with previous work which has shown a significant contribution from disulfide bonds to mAb dimer formation.Citation4
Identification of structural differences between native dimers, 37°C dimers, and 50°C dimers
The three dimer samples were then analyzed by several spectroscopic techniques to identify any differences in secondary and tertiary structure. In all cases, unfractionated mAb1 was analyzed as a control.
Circular dichroism
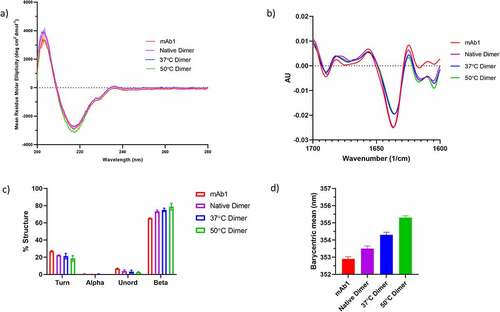
The far UV CD spectra of the dimers is shown in . All samples had highly similar spectra characteristic of beta-sheet secondary structure. There was a small but reproducible difference observed for the 50°C dimers, suggesting there may be small differences in secondary structure for this sample.
Figure 2. Secondary and tertiary structure characterization of dimers. a) Far UV CD spectra of mAb1, Native dimer, 37°C dimer and 50°C dimer. b) FTIR spectra of mAb1, Native dimer, 37°C dimer and 50°C dimer. c) Quantification of the secondary structure species present from the FTIR data in B). d) Intrinsic fluorescence analysis of mAb1, Native dimer, 37°C dimer and 50°C dimer. Data are the mean ± standard deviation of triplicate measurements.
Fourier transform infrared spectroscopy
Fourier transform infrared spectroscopy (FTIR) analysis of the dimers () also points to the presence of small differences in secondary structure between the samples. When compared to unfractionated mAb1, the dimer samples all exhibit differences at wavenumbers between 1600 and 1620 cm−1. Signals in this region have been attributed to the formation of inter-molecular beta-sheet, which has been shown to be present in aggregated protein.Citation35
Quantification of the different secondary structures present in the dimers () reveals an increase in beta, with an accompanying decrease in turn and unordered secondary structures when compared to unfractionated mAb1. There is a trend for increasing amounts of beta structure with increasing temperature stress.
Intrinsic fluorescence
To further investigate the apparent structural differences between dimer and unfractionated mAb1 as well as between the different dimer samples, all samples were subjected to intrinsic fluorescence analysis. The fluorescence data are shown in . Compared to unfractionated mAb1, the native dimer sample has a small increase in barycentric mean, indicating a small change in the tertiary structure for the native dimers. Further increases in barycentric mean are observed with increasing temperature stress. This is consistent with an increasingly non-native tertiary structure with increasing temperature.
Dimers formed at elevated temperatures have a more elongated structure
Spectroscopic analysis revealed that there were some differences in secondary and tertiary structure between all of the samples. We next decided to characterize the tertiary and quaternary structure of the dimer samples. The samples were thus analyzed by sedimentation velocity analytical ultracentrifugation (SV-AUC). Analytical ultracentrifugation is used to observe macromolecular sedimentation under high centrifugal force in order to determine their masses and shapes.Citation36 The main advantage of ultracentrifugation is the detection of different species in a sample from the peaks in a 2-dimensional spectrum analysis (2DSA).Citation37 The SV-AUC data revealed several dimer species with different sedimentation coefficients for each of the dimer samples. These are shown in . The dimer species in the native dimer and 37°C dimer samples had an average sedimentation coefficient of 9.02, whereas the dimer species present in the 50°C dimer sample had a lower average sedimentation coefficient of 8.92. This is indicative of the dimers in the 50°C dimer sample adopting a more elongated conformation. The heterogeneity of the dimers appeared to decrease from native dimers to 50°C dimer, indicating a shift to a more homogeneous elongated conformation.
Table 2. Summary of 2DSA AUC and SAXS analysis.
To further investigate the differences in quaternary structure between the different dimers, samples were analyzed by SAXS. In order to compare the different dimers with monomeric mAb1, all four samples were examined by SEC-SAXS. The results are shown in and . The instantaneous SAXS profiles were further averaged for noise reduction (). Differences between the mAb1 native dimer and heat-stressed mAb1 dimers are apparent in these profiles and from the radius gyration (Rg). The Rg for the monomer was 49.3 Å for the monomer, in line with previously reported values for mAbs.Citation38 For the dimer samples, the Rg was 70.3 Å, 67.4 Å and 76.0 Å for the native, 37°C and 50°C dimers, respectively. The increased Rg for the 50°C dimers is indicative of these dimers adopting a more elongated conformation than the native dimers. These differences are enhanced in the dimensionless Kratky plot (). The first maximum for native dimer is reached at qRg = 2, which is slightly shifted from the coordinate (1.7, 1.1) expected for well-defined globular proteins.Citation39 The position of this maximum in the dimensionless Kratky plot of the mAb monomer does not markedly differ from that of the dimers, suggesting that IgG flexibility is sufficient to achieve this slight shift. The profiles of the native and 37°C dimers are broadly superimposed, suggesting that similar structures were reached irrespective of heating conditions up to 37°C. In contrast, for the 50°C dimers, the second maximum in the dimensionless Kratky plot is significantly above 5.5 at qRg = 7.0. This suggests a considerably less compact structure as compared with native dimers and/or significantly different structural diversity in the population of mAb dimers.
Figure 3. SAXS analysis of dimer samples. a) Scattering curve for Monomer, Native Dimer, 37°C Dimer and 50°C Dimer. b) P(r) distance distribution for monomer, native dimer, 37°C dimer and 50°C dimer. c) Normalized Kratky plot for monomer, native dimer, 37°C dimer and 50°C dimer. d) Ab initio shape analysis for native dimer, 37°C dimer and 50°C dimer. Showing a more compact structure for the native dimer, and a highly elongated structure for the 50°C dimer. The 37°C dimer adopts a more intermediate shape.
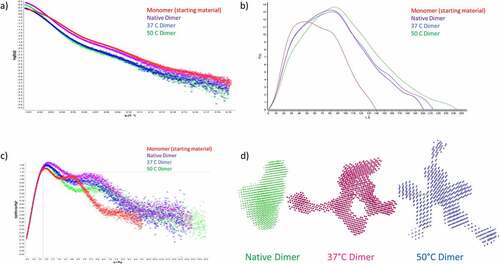
The 201–244 nm maximal extension of the antibody dimers derived from the p(r) curve () is compatible with known structures of antibody dimers.Citation40 To achieve the latter calculation, we implemented software GNOM25 validated for common globular proteins. Using p(r), it was possible to construct low-resolution structures. We implemented ab initio reconstructions using the software package DAMMIN.Citation41 After multiple independent runs and two refinements, we arrived at a structure of packed beads that converged to a typical T-shaped antibody-like envelope (). For the dimers, the ab initio bead models converged to a more compact structure for the native dimers and a more elongated bead model for the 50°C dimer (). This data was in alignment with the solution properties of the dimers observed by SV-AUC.
Identification of dimer interface regions using PCA ELISA and HDX-MS
Quaternary structure analysis revealed that the native and 37°C dimers adopt a more compact structure than the 50°C dimers. We thus supposed that there may be differences in the dimer interface between the three different dimer samples. In order to test this hypothesis, we used two complementary techniques: PCA ELISA and HDX-MS. PCA ELISA is a novel technique to determine antibody HOS and can provide complementary information to HDX. This ELISA has been used to identify regions of increased epitope exposure after exposure of antibodies to stress or different formulation buffers.Citation32,Citation42 In a PCA ELISA, regions that have undergone structural change will exhibit an increase ELISA signal as the epitopes become more exposed to the solvent. Each of the 34 different ELISA wells binds to different overlapping regions of IgGs, as described.Citation43 These overlapping regions are referred to hereafter as Ab1-34. Ab1-6 and Ab7-12 correspond to the variable LC and HC regions, respectively, Ab13-17 correspond to the CL region, and Ab18-34 correspond to HC constant regions 1–3. We reasoned that regions of the antibody that form part of the dimer interface will have a decreased ELISA signal compared to the monomer, as these regions should be buried relative to the solvent.
The results of the PCA ELISA are shown in (normalized to native dimer to account for branching effects), with a difference plot shown in . There are several regions in which decreased signal is observed in the dimer samples compared to unfractionated mAb1. These may represent regions involved in the dimer interface. The most apparent signal differences between the monomer control and the dimers are the Ab2 and Ab15 regions. These correspond to residues 13–36 in the VL and residues 151–174 in the CL domains of mAb1. A decrease in signal was also observed for regions 16, 19, and 22 corresponding to residues within the CL, CH1, and CH2 domains, respectively.
Figure 4. a) Normalized PCA ELISA signal for Unfractionated mAb1, native dimer, 37°C dimer and 50°C dimer. Higher signals demonstrate stronger binding to the ELISA plate. b) Difference plot of the data shown in A), for native dimer, 37°C dimer and 50°C dimer with unfractionated mAb1 subtracted. An increase in signal represents an increase in exposure of a given region, whereas a decrease in signal represents burying of a given region, relative to unfractionated mAb1. Dashed lines correspond to largest standard deviation for unfractionated mAb1 which were used as a threshold for defining the significance of a change.
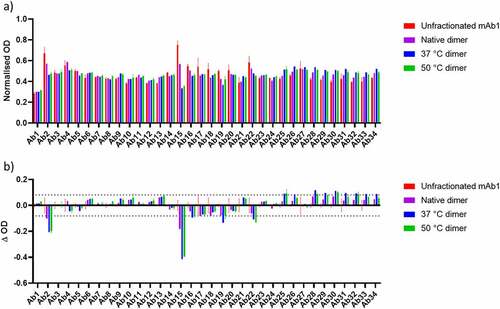
For the 37 and 50°C dimers, there were also several regions that exhibited an increase in ELISA signal. These are likely attributable to temperature-induced unfolding leading to greater exposure of these epitopes. The affected regions were located within the CH2 and CH3 domains.
HDX-MS was used as a complementary technique to elucidate the dimer interface, although, due to limited sample availability, the native dimer sample was not analyzed using this technique. Deuterium uptake rates in dimer samples were compared to the monomer. Reduced uptake is indicative of involvement in the dimer interface due to protection of these regions from the solvent. Conversely, residues that exhibit increased uptake are attributed to unfolded regions. The sequence coverage was 86.6 and 90% for heavy and light chains, respectively. Individual deuterium uptake plots for peptides that showed differential uptake in the dimer samples when compared to mAb1 are shown in supplemental information (SI) .
The HDX results for the 37°C dimer are shown in . Several regions were found to have reduced deuterium uptake, suggesting that these residues may be involved in the dimer interface. Of particular interest are the protected light-chain residues 154–177 and 39–55. Residues 154–177 overlap with the Ab15 region (residues 151–174) implicated in the dimer interface according to the PCA ELISA results. Residues 39–55 are close to the Ab2 region (residues 13–36) from the PCA ELISA. Note that there was no peptide coverage of residues between residues 12 and 30, so protection of the Ab2 region itself was not observed. However, protection of residues close to this region is supportive of the PCA ELISA results.
There were several other protected regions observed for the 37°C dimer, including residues from the Ab22 region identified in the PCA ELISA. These were found throughout the molecule, indicating that the 37°C dimer has a complex dimer interface, possibly comprising several interaction sites. The residues that showed the highest protection were residues 51–79 on the heavy chain.
Figure 5. HDX-MS analysis for identification of dimer interface. a) Deuterium uptake for the light chain of the 37C dimer relative to monomer. Peptides shown in blue and red correspond to those with a reduced and increased deuterium uptake, respectively. Dashed lines represent significance threshold from a two tailed T-test with 95% confidence b) As for A but for heavy chain of the 37C dimer. c) As for A but for light chain of the 50C dimer. d) As for A but for heavy chain of the 50C dimer.
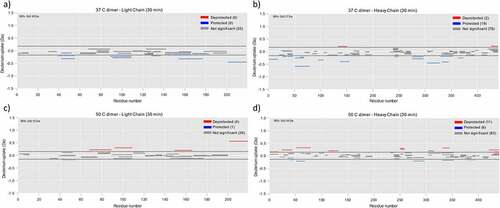
The results for the 50°C dimer are shown in . Similarly to the 37°C dimer, protection was observed at light-chain residues 42–55, close to the Ab2 region from the PCA ELISA, and heavy-chain residues 51–68. Overall, in comparison to the 37°C dimer there were fewer regions that showed protection. This is consistent with an overall smaller dimer interface, which may explain the more elongated quaternary structure of the 50°C dimers. The 50°C dimer also had more regions with de-protection, indicating a more unfolded structure. This result is in agreement with other structural data showing a degree of unfolding in this sample. However, it should be noted that this is likely representative of relatively small changes in local conformation/dynamics, as opposed to large scale unfolding. The changes observed by CD, FTIR, and fluorescence were not indicative of major unfolding, and 50°C is below the Tonset for mAb1 as determined by DSC (~56C, SI ). This suggests that the de-protected regions detected by HDX-MS are not forming large, unfolded epitopes which could drive subsequent aggregation.
Figure 6. Summary of PCA ELISA and HDX data visualized using a homology model of mAb1. a) Results for HDX-MS and PCA ELISA for the 37C dimer sample. Residues which showed protection in the PCA ELISA are colored Orange, for the HDX protected residues are colored yellow. Residues which showed protection in both techniques are shown in purple. All other residues shown in cyan. b) Results for HDX-MS and PCA ELISA for the 50C dimer sample. Colors are the same as for A).
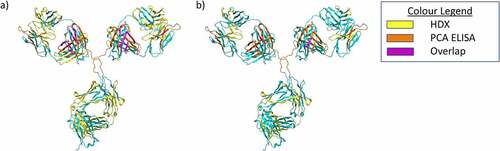
shows a summary of the PCA ELISA and HDX-MS data, visualized using a homology model of mAb1. There are some differences between the results of the two techniques, primarily that HDX-MS identified a greater number of protected regions for the 37°C dimer than the PCA ELISA. This may be due to the differences in dilution factor between the two techniques. The PCA ELISA involves a much larger dilution than HDX, and it may be that this results in the dissociation of some weaker contacts. In addition, we did not observe significant de-protection in the 50°C dimer sample when analyzed by the PCA ELISA, whereas several de-protected regions were identified by HDX-MS. This is likely due to the different detection modes for the two techniques. The PCA ELISA relies on differential binding of ~15 amino acid long regions to immobilized polyclonal antibodies. Therefore, to detect de-protection, the PCA ELISA requires increased solvent exposure/conformational change of a relatively large epitope. This is only likely to occur in the case of significant conformational changes, such as local unfolding and changes in secondary structure. On the other hand, for HDX-MS to detect deprotection, differences in local flexibility of individual amino acid residues are likely to be sufficient for changes in deuterium uptake.
Taken together, the PCA ELISA and HDX-MS data identify some of the key residues likely to make up the mAb1 dimer interface. Both approaches support a role for the Ab2 (light chain 13–36) and Ab15 (light chain 151–174) regions, and the HDX-MS identified other protected regions, including heavy-chain residues 51–79.
Next, the structural information from combined biophysical tools was integrated with molecular modeling to provide a clear picture of how native dimers are formed compared to the formation of more temperature-stressed dimers, allowing us to understand the aggregation of therapeutic protein under heat stress.
Molecular docking supports the role of experimentally identified regions in forming the dimer interface for mAb1
To further probe the intermolecular interactions within mAb1 dimers, computational studies were carried out using the docking server ClusPro.Citation44,Citation45 In order to identify potential interaction sites between two mAb1 monomers, the software produced 10 binding models. Visual inspection of these docking models revealed multiple configurations which are possible by shape complementary, charge, and hydrophobic interactions.
Strikingly, for several of the models, the regions predicted to be involved in the dimer interface correspond to the Ab2 region, which had been implicated in driving dimerization by the PCA ELISA, and HDX. Two examples, one compact and one elongated, are shown in . The theoretical S value and Rg calculated for the compact dimer model () were 10.01 S and 67.15 Å, respectively. These values are similar to the experimental parameters measured using AUC and SAXS for the native and 37°C dimer samples (). For the elongated dimer model (), the theoretical S value was found to be 8.5 S, with an Rg of 80.0 Å, which were more similar to the experimental values obtained for the 50°C dimer.
Figure 7. a) Model of a compact mAb1 dimer identified from docking experiments. Fab domains are colored teal and cyan for the two monomers. Fc domains are shown in gray. Contact residues between the two monomers were determined using MOE. Contact residues which showed reduced PCA ELISA signal for the 37°C dimer are colored Orange. Contact residues which showed reduced deuterium uptake by HDX-MS for the 37°C dimer are colored yellow. Residues which meet both criteria are colored purple. b) Zoomed view of A), focusing on the dimer interface. c) Model of an elongated mAb1 dimer identified from docking experiments. Colors are the same as for A) but for the 50°C dimer. d) Zoomed view of C), focusing on the dimer interface.
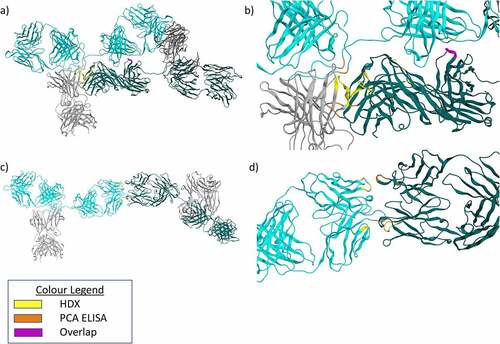
Closer inspection of these models using MOE softwareCitation46 reveals dimerization is facilitated mainly through hydrogen bonding and ionic interactions between patches of positively and negatively charged side chains. shows a compact dimer, possibly more representative of the dimers present in the 37°C dimer sample. A large and complex dimer interface was observed in this model, comprising many residues identified in either HDX or PCA ELISA.
The elongated dimer model shown in is possibly more representative of those present in the 50°C dimer sample. This model shows a smaller dimer interface primarily composed of interactions between residue LC 35 (PCA ELISA Ab2 region) and residues HC 52, 54, and 56 (all implicated experimentally in the HDX data).
The Ab15 region contains the aggregation prone motif YSLSSTLTLS (identified using the aggrescan aggregation prediction tool).Citation47 However, this region is buried within the structure of mAb1, and so it is likely that some conformational change is required prior to aggregation via this hotspot. To further investigate this possibility, we performed MD simulations using the Fab structure of mAb1 (SI ). These results showed that several residues proximal to the YSLSSTLTLS motif were flexible, particularly alpha-helical residues 188–195 and beta-strand residues 134–138. It thus seems possible that displacement of these residues leads to the exposure of the YSLSSTLTLS motif, enabling aggregation via this region.
Overall, the output of the docking model indicates that multiple configurations are possible, while utilizing several experimentally identified residues, to drive mAb1 reversible and irreversible association in solution.
Differences in stability between different dimer conformations
Reversible self-association of antibody therapeutics is typified by concentration-dependent, non-covalent interactions in the native conformation. Therefore, a key question when considering the criticality of dimer species is their reversibility. For instance, dimers that are highly reversible are less likely to affect efficacy, due to significant dilution upon administration of the therapeutic. They also may be less likely to lead to further aggregation.
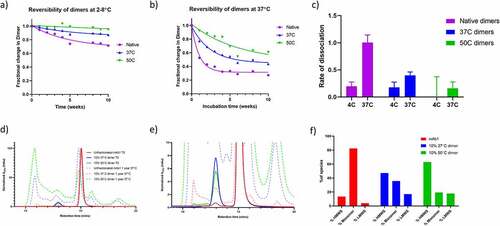
Therefore, the reversibility of the isolated dimers was assessed by SEC over a period of 10 weeks. The dimer samples were diluted to 1 mg/mL and stored at either 4°C or 37°C. At 1-week intervals, the samples were analyzed by SEC in order to quantify the proportion of dimer. The data are shown in for storage at 4°C and 37°C, respectively. For all three samples, the rate of dissociation () is faster at 37°C than 4°C. The reversibility data show that the native dimers dissociate more rapidly than the 37°C dimers, whereas the 50°C Dimers are much more long lasting under these conditions. For the native dimer at 37°C, the proportion of dimer reaches a plateau after approximately four weeks, demonstrating that there are multiple dimer populations within the native dimer sample, those which dissociate readily, and those that are more long lasting.
Figure 8. Aggregation behavior of the dimer samples over time. a) Native dimer, 37°C dimer and 50°C dimer were incubated at 2–8°C for 10 weeks and the proportion of dimer monitored by SEC. Data are fit to a single exponential decay. b) As for A), except samples were incubated at 37°C. c) The rate of dissociation for Native Dimer, 37°C Dimer and 50°C Dimer at the two incubation temperatures. d) SEC chromatograms of mAb1, and mAb1 spiked with 10% of 37°C Dimer or 50°C Dimer. Chromatograms shown before and after 1 year incubation at 37°C. D) Zoomed view of C, legend from C applies. F) Histogram showing the proportion of HMWS, Monomer and LMWS in the three samples after 1 year storage.
Stress-induced dimers drive subsequent aggregation
Another key question regarding the criticality of dimer species is their propensity to induce further aggregation. To investigate this possibility, the 37°C and 50°C dimers were added to unfractionated mAb1 at a concentration of 60 mg/mL for a final dimer concentration of approximately 10% (not performed with native dimers due to limited sample amount). The samples were incubated at 37°C for one year to induce aggregation, and subsequently analyzed by SEC to assess the levels of aggregation. Unfractionated mAb1 was incubated under the same conditions as a control.
The resulting chromatograms are shown in . Unfractionated mAb1 underwent aggregation under these storage conditions, with the total proportion of aggregate species increasing from <1% to 13.5%. However, the samples that had been spiked with 10% of the 37°C dimer and 50°C dimer exhibited a much greater degree of aggregation, with total aggregates of 47.1 and 62.9%, respectively. This is evidence that the spiked dimers may be driving subsequent aggregation, possibly by acting as nucleation seeds. That the 50°C dimers induce a higher level of aggregation may be due to the observed structural differences between the 50°C and 37°C dimers.
Discussion
mAb1 dimers formed under temperature stress adopt different conformations
Although all dimer samples exhibited minor impurities of monomer and other oligomer in varying amounts, purity was sufficient for detailed characterization based either on size (size exclusion chromatography (SEC), AUC, SAXS), secondary structure (CD, FTIR), tertiary structure (intrinsic fluorescence), and quaternary structure (HDX and PCA ELISA). The results of our study reveal new insights into the structural and solution properties of native dimers compared to heat-stressed dimers. We have shown here that mAb1 dimers produced after thermal stress are structurally distinct to those present in native mAb1. Subtle differences in secondary structure were observed for all dimer samples, particularly an increase in intermolecular beta-sheet. This has been observed previously for antibody aggregates formed under thermal stress.Citation48,Citation49 The 50°C dimers have the largest change in secondary structure, whereas the native dimers have a secondary structure most like that of the mAb1 control. Intrinsic fluorescence analysis can provide information regarding the overall tertiary structure of proteins. As expected, increasing levels of temperature stress led to an increase in barycentric mean, indicating an increasingly non-native tertiary structure for the 37°C and 50°C dimers. However, we note that large-scale unfolding was not observed for the 50°C dimers, and that this incubation temperature is below the Tonset (~56°C) and Tm1 (~64°C) of mAb1 as determined by DSC (SI ).
Overall, the spectroscopic analysis of the dimer samples demonstrates that the native dimers are largely made up of monomer with an unaltered secondary and tertiary structure, but the 37°C and 50°C dimers are made up of monomer with an increasingly non-native structure.
Cryogenic transmission electron microscopy (Cryo TEM) is a powerful technique for studying the orientation of dimer species that has been used previously to characterize elongated and compact dimer forms.Citation15 However, the expertise and equipment to perform these experiments were not available to us. Therefore, we used AUC and SAXS to study the quaternary structure of our dimer samples. While these techniques have lower resolution than Cryo TEM, they have the advantage of being techniques that can be used to study antibodies in solution, performed under near native conditions.
AUC and SAXS analysis revealed that there were significant differences in quaternary structure between the different dimer samples. The dimers formed after 50°C stress were found to be more elongated than those present in unstressed mAb1 or mAb1 after incubation at 37°C. Generally, we find that the native dimers and 37°C dimers are quite similar in structure. This is perhaps unsurprising, as the native dimers were likely formed during cell culture, which is performed at close to 37°C. The small differences that we do observe could be due to the differences in buffer condition, duration of exposure to 37°C and differences in concentration of mAb1.
Elongated and compact dimer conformations have been observed previously for mAbs, indeed there is previous evidence that temperature-induced dimers adopt a more elongated structure.Citation15,Citation50 In summary, dimerization of mAb1 results in a combination of both elongated and compact dimers. Both compact and elongated dimers were detected in the native dimer sample, indicating that both forms can develop under normal manufacturing conditions. However, induction of dimerization via heat stress leads to a greater abundance of elongated dimers.
Thermal stress leads to differences in dimer interface
Characterization of mAb dimer interface sites is of high interest as this may facilitate the engineering of proteins for increased stability, or the design of stabilizing formulation buffers with the intent of stabilizing flexible and aggregation prone regions. Here, we used multiple complementary techniques in order to localize the dimer interface for the three dimer samples.
PCA ELISA and HDX-MS analysis provided key insights regarding the dimer interface of mAb1. Detection of regions that showed either a reduced PCA ELISA signal or reduced deuterium uptake (or both) enabled the identification of residues likely to comprise the dimer interface.
For all three dimer samples, two regions showed high protection from ELISA plate binding compared to the mAb1 control. These were Ab2 and Ab15 located within the VL and CL regions, respectively. Similar results were obtained using HDX-MS. This is in agreement with previous studies that also implicated the Fab domain in driving dimerization of mAbs.Citation15,Citation51,Citation52 HDX-MS identified several other protected regions in the 37°C dimers, including sequences within the CH1 and CH2 domain. This is consistent with these dimers having a larger dimer interface and hence being more compact than the 50°C dimers, as observed by SV-AUC and SAXS.
It is interesting to note that the 50°C dimer samples exhibited reduced binding to target (surface plasmon resonance data not shown). This decrease in binding affinity was not observed for the native or 37°C dimers. This is further evidence for Fab-to-Fab association occurring within the 50°C dimers. Assuming a 1:1 binding stoichiometry, we postulate that two of the four Fab domains present are able to bind their respective binding partner in the native and 37°C dimers, resulting in an activity equal to the monomer (which has two Fab arms present). However, at 50°C a decrease in binding was observed, suggesting that fewer than two of the four Fab arms present are available for antigen binding, most likely due to a preferred self-association via the Fab domains. Molecular docking experiments produced dimer models involving several of the experimentally identified dimer interface residues. Specifically, residue LC 35 (located within Ab2) was found to be involved in several ionic and hydrogen bonds in both compact and elongated models of mAb1 dimer. LC 35 is situated in a protruding loop and was found to have distinct interactions with several heavy-chain residues (52, 56, and 265). Therefore, this residue may be particularly important in driving dimerization of mAb1. Interestingly, LC 35 is flanked by several hydrophobic amino acids. It may be that, when exposed to high temperature, partial unfolding occurs within this region in the loop, leading to increased exposure of these hydrophobic residues. These exposed hydrophobic residues may then contribute to the observed irreversible dimerization for the heat-induced dimers. The hypothesis of increased hydrophobic residue exposure in the heat-induced dimers is supported by hydrophobic interaction chromatography (HIC) data (SI ), which showed an increase in retention time for the 37°C and 50°C dimers compared to native dimers. Note that the residues discussed above are located within CDR regions and so these specific interactions are likely to be unique to mAb1; however, identification of these type of interactions within the CDR regions have been informative for subsequent candidate selection.
The amino acid sequence for the Ab15 and Ab16 regions were analyzed by the Aggrescan aggregation prediction tool,Citation47 and the aggregation hotspot YSLSSTLTLS was identified. It may be that dimerization is partially driven by these hotspots, potentially after partial unfolding to expose the hotspots to the solvent. The necessity of an initial partial unfolding step is supported by the observation that the YSLSSTLTLS aggregation prone motif on Ab15/Ab16 is buried within the structure of mAb1. This highlights the importance of considering conformational dynamics and partial unfolding steps when making predictions regarding aggregation prone regions. Partial unfolding, and increased dynamics of the CL domain as an initial step of aggregation has been reported previously for a Fab molecule.Citation53 A similar process may be occurring for mAb1 whereby the α-helical residues at 188–195 (adjacent to YSLSSTLTLS) are displaced. This is supported by MD simulations, which showed a high degree of flexibility in residues proximal to the YSLSSTLTLS motif (SI ). It may be that the unique CDR sequences of mAb1 (such as those within the Ab2 region) are responsible for driving dimerization via the Ab15/Ab16 region. However, due to the highly conserved nature of this sequence among mAbs, its role in dimer formation of other mAbs could be the subject of future study.
Overall, we found that the residues that comprise the mAb1 self-association interface reside inside and outside of the CDR loops. While the interactions via the CDR loops are specific to mAb1, the findings regarding dimerization via the constant regions may be applicable to related antibodies.
Identification of the dimerization site may open the way for rational stabilization of mAb1; indeed, as the majority of the implicated regions were located within constant regions, these findings may be applicable to other IgGs as well.
Dimers have differing long term behavior
The link between dimer conformation and their subsequent aggregation behavior is of critical importance, both in the development of therapeutic proteins, and in terms of fundamental understanding of aggregation mechanisms. Dimer species that are reversible, and do not induce subsequent aggregation, are likely to be of less concern than long-lived dimers, which can act as aggregation seeds. Differences in the reversibility of different mAb aggregate species have been reported previously.Citation54
An assessment of the reversibility of the native, 37°C and 50°C dimers found that the native dimers were the most reversible, followed by the 37°C dimers, and finally the 50°C dimers, which were found to be highly long-lived. This may be linked to the differences in dimer interface between the three samples. For the 50°C dimers, only two regions within the Fab domain were implicated in the dimer interface, whereas for the native and 37°C dimers a larger dimer interface was identified. This is consistent with the 50°C dimers having fewer, but individually stronger and possibly covalent contacts. A greater proportion of the native and 37°C dimers may be held together by non-covalent interactions, made possible by the larger overall interface.
The propensity for small oligomers to induce subsequent aggregation is a key consideration when assessing the criticality of aggregate species. We have shown here that mAb1 that has been spiked with ~10% of 37°C or 50°C dimer aggregates to a much greater extent than mAb1 alone. This is evidence that the 37 and 50°C dimers can act as aggregation seeds or nucleation points and are driving subsequent aggregation. Importantly, the 50°C dimers cause this to a greater extent than the 37°C dimers. This is likely be related to the observed differences in secondary, tertiary, and quaternary structure between the two dimer samples. The 50°C dimers were found to have non-native secondary structure, as well as unfolding of the native tertiary structure. This may lead to an increased exposure of hydrophobic residues. HIC data (SI ) provides evidence for increased hydrophobicity of the 50°C dimers. The differences in aggregation seed behavior may also be due to differences in quaternary structure; the 50°C dimers have been shown to adopt a more elongated structure than the 37°C dimers. Therefore, the 50°C dimers will have a greater overall solvent-exposed surface area, meaning that there is a larger area with which additional monomer/dimer species can interact.
Key study conclusions
The goal of this study was to further our understanding of the aggregation pathways of antibody therapeutics, with particular focus on the effects of temperature stress on dimer formation in the IgG4 mAb1. Temperature stress is routinely used in accelerated stability studies and forced degradation studies, and so has direct relevance to the development of biopharmaceuticals. It should be noted that mAbs can also be exposed to other stresses and further work focused on the impacts of different stress conditions such as pH and light exposure may be the subject of future study. The results of our study have revealed new insights into the solution properties of mAb1 dimers. We have shown that mAb1 dimers formed after temperature stress adopt a different (more elongated) configuration to those present in unstressed mAb1. A putative self-association interface observed by the orthogonal techniques used in this study indicated the Fab domain drives self-association in the temperature-stressed condition. In contrast, the native dimers show a more compact conformation, with areas in the Fc as well as Fab shown to have more protection sites.
The differences in aggregation pathways between the three conditions have implications for the use of accelerated stability studies, which often involve storage of mAbs at elevated temperature. The results presented here provide further confirmation that these studies may not be representative of aggregation that occurs in the absence of temperature stress. Therefore, this should be considered when evaluating the results of accelerated stability studies or forced degradation studies.
In addition, we have shown that the subsequent behavior of mAb1 dimers can be linked to both the condition they were formed under and their conformation. Therefore, this work highlights the importance of in-depth structural characterization of mAb dimers during development, as the structure of a dimer can directly influence its reversibility and aggregation nucleation effects. These properties are of paramount importance to the development of mAb therapeutics due to the potential impacts of aggregates on safety and efficacy.
Finally, we report the use of novel and high-resolution approaches to characterize the dimer interface in the three different dimer samples. To our knowledge this is the first reported use of the PCA ELISA to determine mAb self-interaction regions. In combination with molecular docking, HDX-MS and MD simulations, we identified specific amino acid residues that may be driving dimerization for mAb1. Identification of these residues may facilitate their stabilization, for example, via excipient docking experiments which have been described previously for antibody formulations.Citation55 While some of the identified residues are unique to mAb1, others were identified within constant regions, and so these findings could be applicable to other mAbs. It is interesting to note that developability issues with mAb1, related to elevated levels of HMWS, were initially encountered. It is possible that self-association driven via the CDR loop, as identified here, contributed to this. However, it should be noted that process development has since reduced the levels of HMWS in mAb1 to below 1%.
In conclusion, we have shown that mAb1 aggregation proceeds by different molecular mechanisms at different temperatures, that mAb1 dimers can adopt multiple configurations, and that the differences in mAb1 dimer form can have profound influence on their subsequent aggregation behavior. This work will be of substantial interest, both in terms of a theoretical understanding of antibody aggregation and in terms of supporting and enhancing future development of protein therapeutics. The identification of aggregation hotspots may enable the stabilization of these regions via mutation or through the use of excipients, and provide insights for the design of improved control strategies for similar molecules.
Materials and methods
mAb1
mAb1 is a full-length IgG4 monoclonal antibody with a molecular weight of ~150 kDa produced in Chinese hamster ovary (CHO) cells. The Fc of mAb1 is glycosylated with biantennary N-glycans as expected for an IgG4 produced in CHO cells. Unless otherwise stated, all experiments were performed in a buffer of 30 mM histidine, 250 mM proline, pH 5.6.
Generation and isolation of dimers
Dimers were isolated from mAb1 that had been stored under three different conditions. “Native dimers” were isolated from mAb1 that had been stored at ≤ −60°C since manufacture. “37°C dimers” were isolated from mAb1 that had been stored at 37°C for one month. “50°C dimers” were isolated from mAb1 that had been stored at 50°C for one month.
Dimers were isolated from mAb1 by SEC. mAb1 was separated using a HiLoad® 26/600 Superdex® 200 pg column. The mobile phase was 0.1 M sodium phosphate, 0.1 M NaCl, pH 7.0. An isocratic flow rate of 1 mL/min was used with a total run time of 300 minutes and UV detection at 280 nm. For each sample, a 350 mg load mass was used. 2.5 mL fractions were collected across the elution profile, and fractions containing dimer were pooled. Pooled fractions from five runs were then concentrated using centrifugal concentrators with a 10 kDa MWCO, concentration determined using absorbance at 280 nm and then stored at ≤ −60°C until subsequent analysis.
Analytical size exclusion chromatography
All analytical SEC was performed using a xBridge Protein BEH SEC Column (200 Å, 3.5 µm, 7.8 mm × 300 mm) connected to an HPLC system. The mobile phase was 0.1 M sodium phosphate, 0.1 M NaCl, pH 7. An isocratic flow rate of 0.5 mL/min was used with a total run time of 27 minutes and UV detection at 280 nm. A load mass of 100 µg was used.
Hydrophobic interaction chromatography
HIC was performed using a TSKgel Ether-5PW column (10 µm, 7.5 × 75 mm) connected to an HPLC system. The column was equilibrated with 70% buffer A (0.1 M sodium phosphate, 2 M ammonium sulfate, pH 7) and a gradient was run from 70% buffer A to 100% buffer B (0.1 M sodium phosphate, pH 7) over 60 minutes at a flow rate of 1 mL/min. Fluorescence detection was used (excitation 280 nm, emission 350 nm) and the load mass was 10 µg.
SDS-PAGE
SDS-PAGE analysis was performed using 4–12% Bis-Tris gels and the SeeBlue™ Plus2 Pre-stained Protein Standard (Invitrogen). Samples were diluted to 1 mg/mL with NuPAGETM LDS sample buffer. For reduced analysis, NuPAGE™ Sample Reducing Agent was added to the sample. All samples were incubated at 80°C for 5 minutes prior to analysis. Gels were stained using SimplyBlue™ SafeStain. Densitometry was performed using a Bio-Rad Gel Doc system.
Circular dichroism
All samples for CD analysis were buffer exchanged into 30 mM sodium acetate, 0.03% PS80, pH 5.6 and diluted to 0.25 mg/mL. The CD spectra were acquired using Chirascan spectrometer (Applied Photophysics) with a 1 mm pathlength cell. The scan range was 200–260 nm with a step size of 0.5 nm and an averaging time of 1 s. Scans were performed in triplicate. An air and buffer blank were measured and manually subtracted from the spectra with the mean residue molar ellipticity calculated and adjusted for concentrations.
FTIR
FTIR was performed using an AQS3 FTIR instrument (RedShift Bio). Prior to analysis all samples were diluted 0.4 mg/mL in 30 mM Histidine, 250 mM Proline, pH5.6. The scan range was 1580 to 1720 cm−1. Each sample was measured in triplicate and averaged. Secondary structure determination was performed using the AQS3 delta software, using the Simple4 model and IgG3 as a reference spectrum.
Intrinsic fluorescence
Fluorescence measurements were performed using a Varian eclipse fluorimeter. All samples were diluted to 5 mg/mL in 30 mM Histidine, 250 mM Proline, pH 5.6. Triplicate fluorescence emission scans were performed between 315 and 500 nm, using an excitation wavelength of 280 nm. Excitation and emission slits were set to 5 nm. All data was collected at 15°C.
For each emission scan, the Barycentric mean (BCM) was calculated using the equation below:
Where em int is emission intensity and λem is the emission wavelength.
DSC
DSC was performed using a Microcal VP Capillary DSC. mAb1 was diluted to 0.5 mg/mL in 30 mM Histidine, 250 mM Proline, pH 5.6. The temperature range was 10–100°C, with a scan rate of 60°C/Hour. Tms and Tonset were determined using Origin software.
AUC
400 μL of sample was loaded in the sample cell upon charcoal centerpieces with 12 mm optical path length and glass quartz windows. The corresponding buffer was loaded into the reference channel of each cell (the instrument functions like a dual-beam spectrometer). These loaded cells were then placed into an AN-60Ti rotor, loaded into the Beckman-coulter proteome Lab XL-I analytical ultracentrifuge and brought to 20 degrees. The rotor was then brought to 3,000 rpm and the samples were scanned at 280 nm to confirm proper cell loading and appropriate adjustment of the laser, via the laser delay settings. The rotor was then brought to the final run speed of 45,000 rpm. Scans were recorded every 6.2 minutes for 12 hours. Radial scans ranged from 5.8 cm to 7.2 cm.
The data were analyzed using the c(s) method implemented in SEDFIT version 14.6e,Citation56,Citation57 using 35000 data points for each sample. The f/f0 values were varied to find the best overall fit of the data for each sample. A maximum entropy regularization probability of 0.95 was used and time-invariant noise was removed. The coefficients were converted to standardized s20,w units using the calculated partial specific volume of 0.73, and the experimentally determined density and viscosity of the buffer measured as density 1.0060 g/mL and viscosity 1.02 cP at 20.2oC. The analysis was performed using the standard solvent model.
The data was also analyzed by the UltraScan 2DSA method implemented in the UltraScan II software (version 3.9, revision 2339).Citation37 For analysis, the s-value and frictional ratio ranges were set to 1–15 S and 1–4, respectively. The grid settings were 10 × 10, and 28 grid repetitions were performed. Time-invariant noise correction, radial invariant noise, and iterative optimization approach with the five iterations were enabled. The meniscus and bottom position were fitted. The obtained 2DSA distributions were then refined with parsimonious regularization using Genetic Algorithm analysis.
SAXS
All SAXS data were collected at beamline B21 (Diamond Light source, UK) operating in SEC-SAXS mode and using EIGER 4 M detector. SEC-SAXS was performed using a Superose 6 10/300 increase column (GE Healthcare) pre-equilibrated with phosphate-buffered saline (PBS) + 2% sorbitol, where sorbitol is added to minimize radiation damage during data collection. Protein samples (45 uL, 5 mg/ml) were injected onto the column and eluted with one column volume (24 mL) of buffer, at a flow rate of 0.5 mL/min. Scattering curves were collected throughout the elution and analyzed using the SCATTER IV software suite, where Rg, Kratky plots and p(r) curves were derived from. Molecular envelopes were calculated using DAMMIN with envelopes representing the average of 13 independent runs.
Protein conformational array ELISA
In the PCA ELISA each well contains a panel of antibodies raised against peptides corresponding to one of 34 regions within seven commercial mAbs. The extent to which the sample of interest binds to each well of the ELISA plate will depend on the three-dimensional structure of the antibody. PCA ELISA was performed using the InnoBridge ELISA kit (Array Bridge). Analysis was performed according to the manufacturer’s instructions with the following exceptions. The initial sample concentration was reduced to 2 µg/mL and color development with TMB was allowed to proceed for only two minutes.
Protein-protein docking
A homology model of full-length mAb1 was prepared using the antibody modeling tool in the molecular operating environment (MOE),Citation46 using (PDB:5DK3) from the RCSB protein data bank as the initial template. Protein docking calculations were carried out using ClusPro software, which is a finite Fourier transform rigid body docking software developed at Boston University.Citation44,Citation45 Briefly, the mAb structure was fixed and the model protein underwent 70,000 rotations at a given position in the x, y, and z plane relative to the mAb. 1000 rotation/translation combinations were then selected based on the score from the energy calculations. The positions with the most ‘neighbors’ in a 9 angstrom root mean squared deviation radius from the C-alpha of each residue then became the clusters for the interaction and the top 30 models were selected. ClusPro then performed an energy minimization of these 30 models to output the 10 most favored docked structures. Sedimentation coefficient and radius of gyration for the compact and elongated models produced by ClusPro were calculated directly from the atomic coordinates using HYDROPRO shell-modeling program.Citation58 The default value of 0.31 nm for the atomic element radius for all atoms was used to represent the hydration shell.
Molecular dynamics simulations
The Fab domain of the homology model of mAb1was isolated using MOE. MD simulations were performed using Gromacs v5.1.5Citation59 with the OPLS-AA forcefield.Citation60 The structure was solvated with extended single point charge water and ions were added to neutralize the charge of the system. The system was then subjected to energy minimization with a steepest decent algorithm for 1000 steps. All simulations were performed with a 2 fs timestep. Constant number of particles, volume, and temperature equilibration was performed at a temperature of 325 K for 100 ps, followed by constant number of particles, pressure, and temperature equilibration to 1 bar for 100 ps. The equilibrated system was then subjected to 10 ns of production MD. The root mean squared fluctuation for each residue was calculated in Gromacs and the RMSF values were added as B-factors in PyMol for color coding.
HDX
Sample handling and mixing steps were performed using a second-generation LEAP PAL system set up for HDX analysis (LEAP Technologies, Morrisville, NC). For generation of peptide maps and time zero exchange experiments, 3 μL of 13 μM protein sample was diluted 20-fold in 10 mM potassium phosphate-buffered saline, pH 7. For exchange experiments, deuterium labeling was performed by diluting 3 μL of protein 20-fold in 10 mM KPBS (pH 6.6, corrected for the isotope effect) prepared in D2O. Exchange times were 1 and 30 min with the exchange occurring at room temperature (21 ± 2°C) and each incubation period run in triplicate. Following the appropriate incubation period, exchange was quenched by a 2-fold dilution with 50 μL of 250 mM tris(2-carboxyethyl)phosphine, 4 M guanidinium HCl in 50 mM KPBS (pH 2.3) at 4°C. Following a 5 min quench delay, 95 μL of quenched sample was injected onto a refrigerated nano-ACQUITY UPLC System with HDX technology (Waters, Milford, MA) for on-line pepsin digestion and chromatographic separation. On-line digestion was performed using an Enzymate BEH pepsin column (5 μM, 2.1 × 30 mm; Waters, Milford, MA) at 20°C. The flow rate was 40 μL/min (mobile-phase water/0.2% v/v formic acid). Proteolytic peptides were trapped using an Acquity BEH C18 VanGuard trapping column (1.7 μm, 2.1 × 5 mm i.d.), desalted for 3 min, and sequentially chromatographically separated on an Acquity (1.7 μm, 1 × 100 mm i.d., both Waters, Milford, MA). Both trap and analytical column were held at 0°C). Chromatographic separation was carried out at 40 μL/min by application of a 7 min linear gradient from 99% A/1% B to 60% A/40% B. Mobile phases consisted of 0.2% v/v formic acid (aqueous) (A) and acetonitrile/0.2% v/v formic acid (B). MS experiments were performed on a Synapt G2Si ESI-Q-TOF-MS instrument (Waters, Milford, MA).
ProteinLynx Global Server software v 3.02 (Waters, Milford, MA) was used to generate peak lists by inputting MSE (data dependant acquisition) data. The protein lynx global server outputs were imported in DynamX v3.0 (Waters, Milford, MA) to generate peptide maps. Filtering parameters were used as described.Citation61 Woods plots were generated in Deuteros v1.0.Citation62 A two-tailed T-test was performed with a 95% confidence limit.
Conflicts of interest statement
The authors declare no conflicting interests.
Supplemental Material
Download Zip (2.8 MB)Disclosure statement
No potential conflict of interest was reported by the author(s).
Supplementary material
Supplemental data for this article can be accessed online at https://doi.org/10.1080/19420862.2022.2127172
Additional information
Funding
References
- R-M L, Hwang Y-C, Liu IJ, Lee -C-C, Tsai H-Z, Li H-J, Wu H-C. Development of therapeutic antibodies for the treatment of diseases. J Biomed Sci. 2020;1:1. doi:10.1186/s12929-019-0592-z.
- Mahler HC, Friess W, Grauschopf U, Kiese S. Protein aggregation: pathways, induction factors and analysis. J Pharm Sci. 2009;9(9):2909–16. doi:10.1002/jps.21566.
- Schreiber G. Kinetic studies of protein-protein interactions. Curr Opin Struct Biol. 2002;1(1):41–47. doi:10.1016/s0959-440x(02)00287-7.
- Zhang J, Woods C, He F, Han M, Treuheit MJ, Volkin DB. Structural changes and aggregation mechanisms of two different dimers of an IgG2 monoclonal antibody. Biochemistry. 2018;37(37):5466–79. doi:10.1021/acs.biochem.8b00575.
- Deperalta G, Alvarez M, Bechtel C, Dong K, McDonald R, Ling V. Structural analysis of a therapeutic monoclonal antibody dimer by hydroxyl radical footprinting. mAbs. 2013;1(1):86–101. doi:10.4161/mabs.22964.
- Kijanka G, Bee JS, Bishop SM, Que I, Löwik C, Jiskoot W. Fate of multimeric oligomers, submicron, and micron size aggregates of monoclonal antibodies upon subcutaneous injection in mice. J Pharm Sci. 2016;5(5):1693–704. doi:10.1016/j.xphs.2016.02.034.
- Moussa EM, Panchal JP, Moorthy BS, Blum JS, Joubert MK, Narhi LO, Topp EM. Immunogenicity of therapeutic protein aggregates. J Pharm Sci. 2016;2(2):417–30. doi:10.1016/j.xphs.2015.11.002.
- Filipe V, Jiskoot W, Basmeleh AH, Halim A, Schellekens H, Brinks V. Immunogenicity of different stressed IgG monoclonal antibody formulations in immune tolerant transgenic mice. mAbs. 2012;6(6):740–52. doi:10.4161/mabs.22066.
- Alt N, Zhang TY, Motchnik P, Taticek R, Quarmby V, Schlothauer T, Beck H, Emrich T, Harris RJ. Determination of critical quality attributes for monoclonal antibodies using quality by design principles. Biologicals. 2016;5(5):291–305. doi:10.1016/j.biologicals.2016.06.005.
- Courtois F, Agrawal NJ, Lauer TM, Trout BL. Rational design of therapeutic mAbs against aggregation through protein engineering and incorporation of glycosylation motifs applied to bevacizumab. mAbs. 2016;1(1):99–112. doi:10.1080/19420862.2015.1112477.
- Lee CC, Perchiacca JM, Tessier PM. Toward aggregation-resistant antibodies by design. Trends Biotechnol. 2013;11(11):612–20. doi:10.1016/j.tibtech.2013.07.002.
- Cloutier TK, Sudrik C, Mody N, Hasige SA, Trout BL. Molecular computations of preferential interactions of proline, arginine.HCl, and NaCl with IgG1 antibodies and their impact on aggregation and viscosity. mAbs. 2020;1(1):1816312. doi:10.1080/19420862.2020.1816312.
- Roberts CJ. Protein aggregation and its impact on product quality. Curr Opin Biotechnol. 2014;30:211–17. doi:10.1016/j.copbio.2014.08.001.
- Wang W, Roberts CJ. Protein aggregation – mechanisms, detection, and control. Int J Pharm. 2018;1:251–68. doi:10.1016/j.ijpharm.2018.08.043.
- Plath F, Ringler P, Graff-Meyer A, Stahlberg H, Lauer ME, Rufer AC, A GM, Svergun D, Gellermann G, Finkler C, et al. Characterization of mAb dimers reveals predominant dimer forms common in therapeutic mAbs. mAbs. 2016;5(5):928–40. doi:10.1080/19420862.2016.1168960.
- Gentiluomo L, Roessner D, Streicher W, Mahapatra S, Harris P, Frieß W. Characterization of native reversible self-association of a monoclonal antibody mediated by fab-fab interaction. J Pharm Sci. 2020;1(1):443–51. doi:10.1016/j.xphs.2019.09.021.
- Luo Y, Raso SW, Gallant J, Steinmeyer C, Mabuchi Y, Lu Z, Entrican C, Rouse JC. Evidence for intermolecular domain exchange in the Fab domains of dimer and oligomers of an IgG1 monoclonal antibody. MAbs. 2017;6(6):916–26. doi:10.1080/19420862.2017.1331803.
- Nishi H, Miyajima M, Wakiyama N, Kubota K, Hasegawa J, Uchiyama S, Fukui K. Fc domain mediated self-association of an IgG1 monoclonal antibody under a low ionic strength condition. J Biosci Bioeng. 2011;4(4):326–32. doi:10.1016/j.jbiosc.2011.06.017.
- Liu B, Guo H, Xu J, Qin T, Xu L, Zhang J, Guo Q, Zhang D, Qian W, Li B, et al. Acid-induced aggregation propensity of nivolumab is dependent on the Fc. MAbs. 2016;6(6):1107–17. doi:10.1080/19420862.2016.1197443.
- Arora J, Hu Y, Esfandiary R, Sathish HA, Bishop SM, Joshi SB, Middaugh CR, Volkin DB, Weis DD. Charge-mediated Fab-Fc interactions in an IgG1 antibody induce reversible self-association, cluster formation, and elevated viscosity. mAbs. 2016;8(8):1561–74. doi:10.1080/19420862.2016.1222342.
- Nezlin R. Interactions between immunoglobulin G molecules. Immunol Lett. 2010;1(1–2):1–5. doi:10.1016/j.imlet.2010.06.006.
- Le Basle Y, Chennell P, Tokhadze N, Astier A, Sautou V. Physicochemical stability of monoclonal antibodies: a review. J Pharm Sci. 2020;1:169–90. doi:10.1016/j.xphs.2019.08.009.
- Nowak C, Cheung K, Dellatore JM, Katiyar S, Bhat A, Sun R, Ponniah J, Neill G, Mason A, Beck A B, et al. Forced degradation of recombinant monoclonal antibodies: a practical guide. mAbs. 2017;8(8):1217–30. doi:10.1080/19420862.2017.1368602.
- Wang W, Roberts CJ. Non-Arrhenius protein aggregation. Aaps j. 2013;3(3):840–51. doi:10.1208/s12248-013-9485-3.
- Hawe A, Kasper JC, Friess W, Jiskoot W. Structural properties of monoclonal antibody aggregates induced by freeze–thawing and thermal stress. Eur J Pharm Sci. 2009;2(2):79–87. doi:10.1016/j.ejps.2009.06.001.
- Kayser V, Chennamsetty N, Voynov V, Helk B, Forrer K, Trout BL. Evaluation of a non-arrhenius model for therapeutic monoclonal antibody aggregation. J Pharm Sci. 2011;7(7):2526–42. doi:10.1002/jps.22493.
- Chakroun N, Hilton D, Ahmad SS, Platt GW, Dalby PA. Mapping the aggregation kinetics of a therapeutic antibody fragment. Mol Pharm. 2016;2(2):307–19. doi:10.1021/acs.molpharmaceut.5b00387.
- Moore JMR, Patapoff TW, Cromwell MEM. Kinetics and thermodynamics of dimer formation and dissociation for a recombinant humanized monoclonal antibody to vascular endothelial growth factor. Biochemistry. 1999;42(42):13960–67. doi:10.1021/bi9905516.
- Yoshimura Y, Lin Y, Yagi H, Lee Y-H, Kitayama H, Sakurai K, So M, Ogi H, Naiki H, Goto Y Distinguishing crystal-like amyloid fibrils and glass-like amorphous aggregates from their kinetics of formation. Proceedings of the National Academy of Sciences. 2012; 36: 14446. doi: 10.1073/pnas.1208228109.
- Sabate R, Espargaro A, Graña-Montes R, Reverter D, Ventura S. Native structure protects SUMO proteins from aggregation into amyloid fibrils. Biomacromolecules. 2012;6(6):1916–26. doi:10.1021/bm3004385.
- Barnett GV, Qi W, Amin S, Lewis EN, Razinkov VI, Kerwin BA, Liu Y, Roberts CJ. Structural changes and aggregation mechanisms for anti-streptavidin IgG1 at elevated concentration. J Phys Chem B. 2015;49(49):15150–63. doi:10.1021/acs.jpcb.5b08748.
- Davies M, Wang G, Fu G, Wang X. mAb higher order structure analysis with protein conformational array ELISA. J Pharm Res Int. 2015;6:401–12.
- Iacob RE, Bou-Assaf GM, Makowski L, Engen JR, Berkowitz SA, Houde D. Investigating monoclonal antibody aggregation using a combination of H/DX-MS and other biophysical measurements. J Pharm Sci. 2013;12(12):4315–29. doi:10.1002/jps.23754.
- Neris RLS, Kaur A, Gomes AV. Incorrect molecular weights due to inaccurate prestained protein molecular weight markers that are used for gel electrophoresis and western blotting. bioRxiv. 2020;2020: doi:10.1101/2020.04.03.023465.
- Barth A. Infrared spectroscopy of proteins. Biochimica et biophysica acta (BBA. Bioenergetics. 2007;9:1073–101. doi:10.1016/j.bbabio.2007.06.004.
- Cole JL, Lary JW, Moody PT, Laue TM. Analytical ultracentrifugation: sedimentation velocity and sedimentation equilibrium. Methods Cell Biol. 2008;143–79. doi:10.1016/S0091-679X(07)84006-4.
- Demeler B. UltraScan - A comprehensive data analysis software package for analytical ultracentrifugation experiments. In: Scott DJ, Harding SE, Rowe AJ editors. Analytical ultracentrifugation: techniques and methods. United Kingdom: The Royal Society of Chemistry; 2005. p. 210–30.
- Tian X, Langkilde AE, Thorolfsson M, Rasmussen HB, Vestergaard B. Small-angle x-ray scattering screening complements conventional biophysical analysis: comparative structural and biophysical analysis of monoclonal antibodies IgG1, IgG2, and IgG4. J Pharm Sci. 2014;6(6):1701–10. doi:10.1016/j.tibtech.2013.07.002.
- Kikhney AG, Svergun DI. A practical guide to small angle X-ray scattering (SAXS) of flexible and intrinsically disordered proteins. FEBS Lett. 2015;19P(19PartA):2570–77. doi:10.1016/j.febslet.2015.08.027. artA
- Rayner LE, Hui GK, Gor J, Heenan RK, Dalby PA, Perkins SJ. The solution structures of two human IgG1 antibodies show conformational stability and accommodate their C1q and FcγR ligands. J Biol Chem. 2015;13(13):8420–38. doi:10.1074/jbc.M114.631002.
- Svergun DI. Restoring low resolution structure of biological macromolecules from solution scattering using simulated annealing. Biophys J. 1999;6(6):2879–86. doi:10.1016/S0006-3495(99)77443-6.
- Wang X, Li Q, Davies M. Development of antibody arrays for monoclonal antibody higher order structure analysis. Front Pharmacol. 2013;103: doi:10.3389/fphar.2013.00103.
- Fu C, Zhang Z, Zhou S, Pritts WA, Zhang Q. Assessing localized conformational stability of antibody-drug conjugate by protein conformation assay. J Pharm Biomed Anal. 2020;179:113020. doi:10.1016/j.jpba.2019.113020.
- Comeau SR, Kozakov D, Brenke R, Shen Y, Beglov D, Vajda S. ClusPro: performance in CAPRI rounds 6–11 and the new server. Proteins: structure, function, and bioinformatics. 2007;4:781–85. doi:10.1002/prot.21795.
- Kozakov D, Hall DR, Xia B, Porter KA, Padhorny D, Yueh C, Beglov D, Vajda S. The ClusPro web server for protein-protein docking. Nat Protoc. 2017;2(2):255–78. doi:10.1038/nprot.2016.169.
- Molecular Operating Environment (MOE), 2022. Chemical Computing Group ULC. Montreal, QC, Canada. https://www.chemcomp.com/Research-Citing_MOE.htm.
- Conchillo-Solé O, de Groot NS, F.x A, Vendrell J, Daura X, Ventura S. AGGRESCAN: a server for the prediction and evaluation of “hot spots” of aggregation in polypeptides. BMC Bioinform. 2007;1(1):65. doi:10.1186/1471-2105-8-65.
- Telikepalli SN, Kumru OS, Kalonia C, Esfandiary R, Joshi SB, Middaugh CR, Volkin DB. Structural characterization of IgG1 mAb aggregates and particles generated under various stress conditions. J Pharm Sci. 2014;3(3):796–809. doi:10.1002/jps.23839.
- Baird G, Farrell C, Cheung J, Semple A, Blue J, Ahl PL. FTIR spectroscopy detects intermolecular β-sheet formation above the high temperature tm for two monoclonal antibodies. Protein J. 2020;4(4):318–27. doi:10.1007/s10930-020-09907-y.
- Paul R, Graff-Meyer A, Stahlberg H, Lauer ME, Rufer AC, Beck H, Briguet A, Schnaible V, Buckel T, Boeckle S. Structure and function of purified monoclonal antibody dimers induced by different stress conditions. Pharm Res. 2012;8(8):2047–59. doi:10.1007/s11095-012-0732-6.
- Kim N, Remmele RL, Liu D, Razinkov VI, Fernandez EJ, Roberts CJ. Aggregation of anti-streptavidin immunoglobulin gamma‐1 involves Fab unfolding and competing growth pathways mediated by pH and salt concentration. Biophys Chem. 2013;172:26–36. doi:10.1016/j.bpc.2012.12.004.
- Rouby G, Tran NT, Leblanc Y, Taverna M, Bihoreau N. Investigation of monoclonal antibody dimers in a final formulated drug by separation techniques coupled to native mass spectrometry. mAbs. 2020;1(1):1781743. doi:10.1080/19420862.2020.1781743.
- Codina N, Hilton D, Zhang C, Chakroun N, Ahmad SS, Perkins SJ, Dalby PA. An expanded conformation of an antibody fab region by X-ray scattering Molecular Dynamics, and smFRET Identifies an Aggregation Mechanism. J Mol Biol. 2019;7:1409–25. doi:10.1016/j.jmb.2019.02.009.
- Joubert MK, Luo Q, Nashed-Samuel Y, Wypych J, Narhi LO. Classification and characterization of therapeutic antibody aggregates. J Biol Chem. 2011;28(28):25118–33. doi:10.1074/jbc.M110.160457.
- Barata TS, Zhang C, Dalby PA, Brocchini S, Zloh M. Identification of protein-excipient interaction hotspots using computational approaches. Int J Mol Sci. 2016;6(6):853. doi:10.3390/ijms17060853.
- Schuck P. Size-distribution analysis of macromolecules by sedimentation velocity ultracentrifugation and lamm equation modeling. Biophys J. 2000;3(3):1606–19. doi:10.1016/s0006-3495(00)76713-0.
- Brown PH, Schuck P. Macromolecular size-and-shape distributions by sedimentation velocity analytical ultracentrifugation. Biophys J. 2006;90(12):4651–61. doi:10.1529/biophysj.106.081372.
- Ortega A, Amorós D, García de la Torre J. Prediction of hydrodynamic and other solution properties of rigid proteins from atomic- and residue-level models. Biophys J. 2011;4(4):892–98. doi:10.1016/j.bpj.2011.06.046.
- Abraham MJ, Murtola T, Schulz R, Páll S, Smith JC, Hess B, Lindahl E. GROMACS: high performance molecular simulations through multi-level parallelism from laptops to supercomputers. SoftwareX. 2015;1-2:19–25. doi:10.1016/j.softx.2015.06.001.
- Robertson MJ, Tirado-Rives J, Jorgensen WL. Improved peptide and protein torsional energetics with the OPLS-AA force field. J Chem Theory Comput. 2015;11(7):3499–509. doi:10.1021/acs.jctc.5b00356.
- Sørensen L, Salbo R. Optimized workflow for selecting peptides for HDX-MS data analyses. J Am Soc Mass Spectrom. 2018;11(11):2278–81. doi:10.1007/s13361-018-2056-1.
- Lau AMC, Ahdash Z, Martens C, Politis A, Valencia A. Deuteros: software for rapid analysis and visualization of data from differential hydrogen deuterium exchange-mass spectrometry. Bioinformatics. 2019;17(17):3171–73. doi:10.1093/bioinformatics/btz022.