
ABSTRACT
Therapeutic monoclonal antibodies (mAbs) have a propensity to host a large number of chemical and enzymatical modifications that need to be properly assessed for their potential impact on target binding. Traditional strategies of assessing the criticality of these attributes often involve a laborious and low-throughput variant enrichment step prior to binding affinity measurement. Here, we developed a novel competitive binding-based enrichment strategy followed by mass spectrometry analysis (namely, competitive binding-MS) to achieve high-throughput evaluation of potential critical quality attributes in therapeutic mAbs. Leveraging the differences in target binding capability under competitive binding conditions, the criticality of multiple mAb attributes can be simultaneously evaluated by quantitative mass spectrometry analysis. The utility of this new workflow was demonstrated in three mAb case studies, where different post-translational modifications occurring within the complementarity-determining regions were successfully interrogated for their impact on antigen binding. As this workflow does not require prior enrichment (e.g., by forced degradation or liquid chromatography fractionation) of the variants, it is particularly valuable during the mAb candidate developability assessment, where fast turn-around time is highly desired to assist candidate selection.
Abbreviations: ACN: acetonitrile; ADCC: antibody-dependent cell-mediated cytotoxicity; AEX: anion exchange chromatography; bsAb: bispecific antibody; CDC: complement-dependent cytotoxicity; CDR: complementarity-determining region; CML: carboxymethylation; CQA: critical quality attribute; DDA: data-dependent acquisition; DMSO: dimethyl sulfoxide; DTT: dithiothreitol; FA: formic acid; Fab: Fragment antigen-binding; FcRn: neonatal Fc receptor; HC: heavy chain; HIC: hydrophobic interaction chromatography; IAA: iodoacetamide; IEX: ion exchange chromatography; LC: light chain; mAb monoclonal antibody; msAb: monospecific antibody; MS: mass spectrometry; PBS: phosphate-buffered saline; pI: isoelectric point; PTM: post-translational modification; SCX: strong cation exchange chromatography; SEC: size exclusion chromatography; SPR: surface plasmon resonance; XIC: extracted ion chromatography.
Introduction
Development of therapeutic monoclonal antibodies (mAbs) remains a challenging process despite its huge success in the past two decades.Citation1 Due to their large size and complexity, mAb molecules often host a large number of modifications (e.g., attributes) that need to be thoroughly characterized to support their development.Citation2,Citation3 These attributes can be introduced from both post-translational modifications (e.g., deamidation, oxidation, glycation)Citation4–7 and physicochemical degradations (e.g., aggregation, fragmentation) during mAb production, purification, and storage.Citation8 Of these attributes, those that can impact the efficacy or safety of the drug products are defined as critical quality attributes (CQAs).Citation9–11 Frequently, CQAs that impair the target binding affinity are found within the mAb complementarity-determining regions (CDRs), although they could also occur on residues outside the CDRs through allosteric effects. Conversely, some CDR modifications might not be considered as CQAs if they do not directly or indirectly affect the epitope-paratope interactions.Citation12 Therefore, in addition to empirical knowledge or computational modeling approaches, it is also critical to experimentally assess each CDR modification for its effect on mAb target binding.
Identification of potential CQAs (pCQAs) that impact mAb target binding is particularly important during drug candidate developability assessment, which is a vital step to select drug candidates with favorable drug-like properties, and therefore, reduce failure rates.Citation13,Citation14 Currently, this task is performed in a low-throughput fashion that requires enrichment of the attribute-bearing variants followed by either in vitro target binding measurement or cell-based potency testing.Citation15 For example, enrichment of mAb variants can often be achieved through liquid chromatography fractionation under different separation modes, such as ion exchange chromatography (IEX),Citation16,Citation17 hydrophobic interaction chromatography (HIC),Citation18,Citation19 and size exclusion chromatography (SEC).Citation20,Citation21 This approach is highly laborious and may not isolate low-abundance variants. Therefore, specific stress conditions to artificially generate variants at higher levels are commonly applied prior to fractionation and subsequent assessment.Citation22 Furthermore, to isolate the variants with sufficient purity, substantial efforts are often needed to optimize a liquid chromatography method. Finally, as each attribute needs to be evaluated one at a time, this approach is low-throughput, and therefore, not ideally suited during candidate developability assessment, where multiple candidates might need to be evaluated simultaneously with fast turn-around times.
To address these limitations, SEC has recently been used as an alternative means to enrich mAb variants with compromised target binding affinity. Following mAb-antigen incubation, the unbound mAb species were separated from the mAb-antigen complexes by SEC. Subsequent bottom-up MS analysis of these SEC fractions could identify attributes that were enriched in the unbound fraction due to impaired antigen binding.Citation23 Shi et al.Citation24 further incorporated a competitive binding step to this workflow and showed improved method sensitivity in identifying attributes with less significant effects on target binding. This SEC fractionation and bottom-up MS-based approach significantly improved the method throughput in pCQA evaluation. However, due to the need for SEC fractionation, this method still required the mAb variants to be present at sufficiently high levels. As a result, forced degradation conditions were often needed in these studies to increase the abundances of the variants prior to the SEC fractionation. Moreover, as this approach requires at least partial resolution between the unbound mAb and the mAb-antigen complexes from SEC separation, it may not be suitable for systems where the antigen is too small to result in a meaningful SEC retention time shift upon binding (e.g., small cytokines) or the binding stoichiometry is too complicated to generate discrete complexes; for example, multivalent antigens might form heterogeneous mAb-antigen complexes with different stoichiometries.
In this study, we overcame these issues and developed a novel workflow, namely, competitive binding-MS, to enable high-throughput evaluation of target binding-related pCQAs in therapeutic mAbs. By performing the competitive binding on immobilized antigen, mAb variants with impaired target binding can be effectively enriched in the unbound fraction. Compared to SEC fractionation, the use of immobilized antigen for variant enrichment not only simplifies the experimental procedures, but also allows the new workflow to be much more broadly applicable to different mAb-antigen systems. Following mAb variants enrichment, the criticality of multiple attributes can then be simultaneously assessed by comparing their relative abundances between the unfractionated control sample and the unbound fraction using quantitative MS approaches. Finally, attributes that show significant enrichment in the unbound fraction are determined as pCQAs, as they result in a decreased target binding affinity. The validity and utility of this new method was demonstrated in three mAb case studies, where a wide range of CDR and non-CDR modifications were assessed for their impact on target binding.
Results
Competitive binding-MS workflow
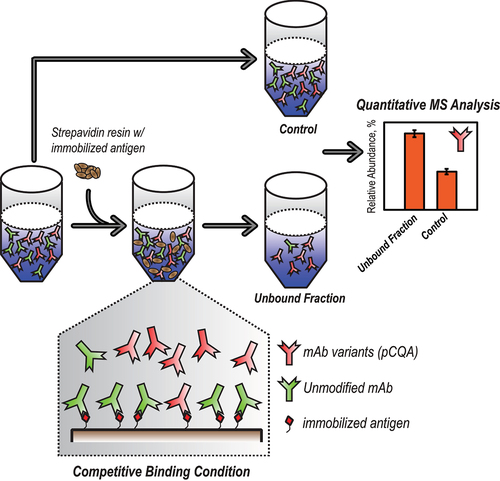
To explore the differences in target binding affinity due to the presence of various mAb attributes, a competitive binding environment was established to enable the enrichment of mAb variants with decreased target binding affinity. As illustrated in , mAb sample was first incubated with an insufficient amount of the immobilized antigen so that the total amount of the antibody exceeded the binding capacity of the antigen. As a result, the unmodified mAb species with full binding capability will be preferentially bound to the immobilized antigen, while the mAb variants with decreased binding affinity will be “enriched” in the unbound fraction. Subsequently, quantitative MS analysis either at the intact mAb level or after tryptic digestion can be applied to compare the relative abundances of each attribute in the unbound fraction and in the unfractionated control sample. Finally, attributes that show significant enrichment in the unbound fraction indicate compromised target binding affinity, and thus should be considered as pCQAs.
Figure 1. Competitive binding-MS workflow. A graphical description of the competitive binding-MS workflow which includes 4 steps: (1) a control sample containing a mixture of unmodified mAb molecules and pCQA-containing mAb variants; (2) an insufficient amount of immobilized antigen is added to the control sample to create a competitive binding environment, where the antigen preferentially binds to the unmodified mAb molecules; (3) the unbound fraction with enrichment of the pCQA-containing mAb variants is collected from step 2; (4) quantitative MS analysis of both the control sample from step 1 and the unbound fraction from step 3, showing higher abundance (i.e., enrichment) of the pCQA in the unbound fraction.
To ensure a competitive binding environment, the molar ratio between the immobilized antigen and the applied mAb needs to be well controlled and characterized. Although the protein concentrations of both the antigen and the mAb stock solutions are easily accessible, the antigen biotinylation and subsequent immobilization processes can introduce variables that affect the actual antigen-to-mAb ratio. Therefore, to accurately control the mixing ratio (or the extent of competitive binding), a titration experiment was performed by mixing an increasing amount of immobilized antigen to a fixed amount of mAb sample. Following incubation, the amount of the unbound mAb in each sample was estimated by measuring the mAb concentration in the unbound fraction using UV absorbance at 280 nm. After normalization, the relative abundance of the unbound mAb in each sample was calculated and plotted against the amount of the antigen resin used (Figure S1). As expected, a decreasing amount of the unbound mAb was observed along with the increasing amount of antigen, until the unbound mAb were completely depleted. In theory, the entire region of this titration curve till the complete depletion of the unbound mAb can be considered as competitive binding conditions. As more mAb species (e.g., mostly unmodified mAb) are depleted by the immobilized antigen, a greater enrichment of pCQA-containing mAb variants in the unbound fraction is expected, and therefore facilitates their identification.
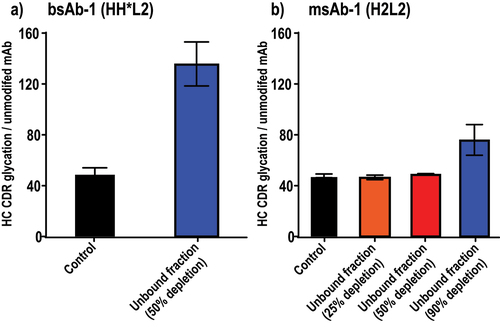
The extent of mAb depletion required for successful pCQA determination can also be different between bispecific antibodies (bsAbs) and monospecific antibodies (msAbs). For a bsAb molecule, a critical CDR modification from its unique Fab arm might dramatically reduce its ability to bind the corresponding antigen. In contrast, the same CDR modification occurring on one of the two identical Fab arms in a msAb molecule might only negligibly affect its ability to bind antigen, due to the availability of one unmodified Fab arm. To understand the extent of mAb depletion required for successful pCQA determination, a bsAb (HH*L2, bsAb-1) and its homodimer msAb (H2L2, msAb-1), both containing the same critical modification (i.e., a CDR Lys glycation known to reduce antigen binding affinity) on the heavy chain (HC) CDR region, were tested under various competitive binding conditions. For the bsAb, depletion of only half of the total antibody by the immobilized antigen was sufficient to result in a significant enrichment of this CDR Lys glycation in the unbound fraction, reaffirming its critical impact on target binding (). In contrast, for the msAb, the same extent of antibody depletion (i.e., 50%) did not lead to any enrichment of this modification in the unbound fraction. Instead, a significant enrichment of this modification was only observed after 90% of the total antibody was depleted from the unbound fraction (). Therefore, to ensure effective enrichment of mAb variants containing pCQAs, depletion levels of 50% and 90% were selected for bsAb and msAb, respectively, to perform the competitive binding-MS experiments.
Figure 2. Evaluation of the depletion level for successful pCQA enrichment in (a) a bsAb sample and (b) a msAb sample. The y-axis each represents the relative abundance of the HC CDR Lys glycation variant to the unmodified mAb as measured by SCX-MS analysis. (2a) a bar graph comparison of the HC CDR glycation levels in bsAb-1 between the control sample and the unbound fraction using a 50% depletion level. A successful enrichment of the HC CDR glycation was observed in the unbound fraction; (2b) a bar graph comparison of the HC CDR glycation levels in msAb-1 between the control sample and unbound fractions using 25%, 50%, and 90% depletion levels. A successful enrichment of the HC CDR glycation was only observed when a depletion level of 90% was used.
Evaluation of pCQAs by competitive binding and IEX-MS analysis
After fractionation of the mAb variants under competitive binding conditions, quantitative MS analysis is performed to examine whether the attributes-of-interest are significantly enriched in the unbound fraction. Ion exchange chromatography coupled to native MS is a powerful technique to achieve rapid quantitation of a wide range of CDR modifications due to its excellent selectivity toward surface modifications. To demonstrate the validity of this approach, three mAb examples, each containing a specific CDR modification at a notable level, were subjected to competitive binding followed by either native strong cation exchange chromatography coupled to MS (SCX-MS) or native anion exchange chromatography coupled to MS (AEX-MS) analysis.
The first mAb molecule (bsAb-1) is a bsAb that we discussed above. It consists of two identical light chains (LC) and two different heavy chains (HC and HC*). This molecule contains a high level of glycation on the Lys98 residue within the HC CDR3, which is known to reduce the binding affinity to its corresponding target based on surface plasmon resonance (SPR)-based measurement (data not shown). After competitive binding using the HC-corresponding antigen, the unbound fraction and the unfractionated control samples were both subjected to native SCX-MS analysis (, and Figure S2), which was previously shown to separate this CDR Lys98 glycation variant (red, ) as a defined acidic peak. In addition, this method can also monitor a CDR glucuronylation variant (orange, ) and a CDR carboxymethylation (CML) variant (magenta, ) occurring on the same Lys98 residue. Other mAb variants, resulting from HC N-terminal heterogeneity (i.e., non-cyclized Gln, dark green; ) and Fc N-glycosylation microheterogeneity (i.e., galactosylation, light green; ) can also be monitored using the extracted ion chromatograms (XICs). Subsequently, the relative abundance of each attribute can be calculated using its XIC peak area normalized to that of the main species (G0F/G0F, blue; ) and compared between the unfractionated control sample and the unbound fraction (). It is clear that all three modifications (i.e., glycation, glucuronylation, and carboxymethylation) occurring on HC CDR Lys98 were significantly enriched in the unbound fraction under competitive binding conditions, indicating the compromised target binding of these variants. In contrast, other attributes, including the non-cyclized N-terminal Gln and the galactosylation of the Fc N-glycan, showed no quantitative difference between the two samples, consistent with the common knowledge that they do not contribute to target binding (). It is worth noting that, although the criticality of Lys98 glycation has already been confirmed by SPR-based binding analysis of the enriched material (i.e., through SCX fractionation), the impact of Lys98 glucuronylation and carboxymethylation had remained unknown due to the difficulty in enriching them to sufficient quantities. Therefore, this competitive binding and IEX-MS workflow is valuable to provide orthogonal evaluation of the CDR modifications that might be difficult to study using traditional approaches.
Figure 3. Competitive-binding and native IEX-MS analysis for attribute criticality assessment in bsAb-1 (a–c), bsAb-2 (d–f), and msAb-2 (g–i). The colored traces represent the extracted ion chromatograms of mAb variants containing different attributes-of-interest. The y-axis in (c), (f) and (i) represents the relative abundance of each variant relative to the unmodified mAb with G0F/G0F glycoform as measured by native IEX-MS analysis. G0F, G1F, and G2F refer to biantennary complex-type N-glycans, where G# is the number of galactose residues on the two arms and F is fucosylation of the initial GlcNAc residue. (3a) control sample and (3b) unbound fraction of bsAb-1 analyzed by native SCX-MS, showing TIC and XICs of variants containing HC Lys98 glycation, HC Lys98 CML, HC Lys98 glucuronylation, G0F/G0F, G1F/G2F, and N-term Gln. (3c) bar graph comparison showing the relative abundances of different variants in bsAb-1 between the control and the unbound fraction samples. (3d) control sample and (3e) unbound fraction of bsAb-2 analyzed by native SCX-MS, showing TIC and XICs of variants containing HC Asn56 deamidation, N-term Gln, G0F/G0F, G1F/G2F, G0F (partially glycosylated), and non-glycosylated. (3f) bar graph comparison showing the relative abundances of different variants in bsAb-2 between the control and the unbound fraction samples. (3g) control sample and (3h) unbound fraction of msAb-2 analyzed by native AEX-MS, showing TIC and XICs of variants containing 1× HC Asn56 deamidation, 2× HC Asn56 deamidation, C-term Lys, G0F/G0F, G1F/G2F, and G0F (partially glycosylated). (3i) bar graph comparison showing the relative abundances of different variants in msAb-2 between the control and the unbound fraction samples.
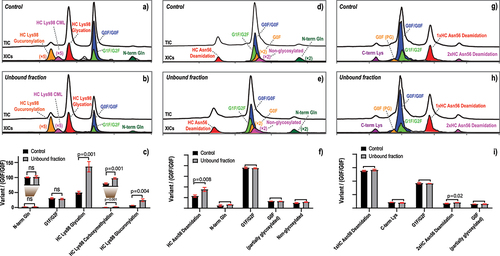
In the second example, a bsAb (bsAb-2) containing a notable level of deamidation on the HC CDR Asn56 residue was studied by competitive binding using its corresponding antigen followed by SCX-MS analysis (, and Figure S3). As this site-specific CDR deamidation can be well separated by the SCX-MS method, quantitation of this deamidation can be readily achieved at the intact mAb level without performing peptide mapping experiments. Using XIC, the elution profile of the Asn56 deamidation variant can be illustrated (red, ) and its abundance relative to the main species (G0F/G0F, blue, ) can be calculated in each of the unfractionated control sample and the unbound fraction. Quantitative comparison from triplicate measurements indicated a significant enrichment of this CDR deamidation from the unfractionated control sample to the unbound fraction (), suggesting its negative impact on target binding. As negative controls, other attributes that are not expected to affect target binding (e.g., the non-cyclized N-terminal Gln and Fc N-glycosylation macro- and micro-heterogeneity) showed highly comparable relative abundances between the two samples. Therefore, we concluded that HC CDR Asn56 deamidation in bsAb-2 should be considered as a pCQA that needs to be further studied and closely monitored during its development.
In the third example, another CDR deamidation (HC Asn56) occurring in a msAb (msAb-2) was also evaluated by competitive binding and IEX-MS workflow. As discussed above, to effectively enrich variants in a msAb, a higher antigen-to-antibody ratio was required to achieve a greater depletion of mAb species in the unbound fraction. In this example, a competitive binding condition was applied so that only 10% of the mAb species were isolated into the unbound fraction. Furthermore, as msAb-2 is an IgG4 molecule with a relatively low isoelectric point (pI= 6.4), the AEX-MS method was found to provide an improved charge variant separation compared to the more commonly applied SCX-MS method. During AEX-MS analysis (, and Figure S4), msAb-2 variants with Asn56 deamidated on one of its two heavy chains were readily separated as an acidic peak (red, ). In addition, a low level of variants with both HC Asn56 deamidated was also observed as a far acidic peak (magenta, ). After competitive binding experiments, AEX-MS analysis of the unbound fraction showed a highly comparable charge variant profile compared to that from the unfractionated control sample (). Quantitative analysis using XIC-based approach also demonstrated that, similar to other attributes that are not expected to affect antigen binding (e.g., C-terminal Lys variant, Fc N-glycosylation heterogeneity), variants with just one Asn56 deamidated were not significantly enriched in the unbound fraction. Interestingly, variants with both Asn56 deamidated did show a very minor, but statistically significant enrichment in the unbound fraction (). Therefore, we speculate that, although Asn56 deamidation occurs within a CDR region, its impact on antigen binding might be limited. Although a complete evaluation of this CDR deamidation still requires further studies, the competitive binding and IEX-MS workflow provided an early readout of its impact, which is particularly valuable for candidate developability assessment.
Evaluation of pCQAs by competitive binding and bottom-up analysis
Although IEX-MS provides a rapid means of quantifying several attributes in mAb samples with very limited sample processing, it cannot quantify many other attributes that are not resolved by either mass or liquid chromatography retention time. In particular, site-specific modifications that are not resolved by IEX separation cannot be reliably quantified by intact mass approaches. In this case, competitive binding followed by bottom-up analysis can be applied to achieve a more comprehensive assessment of attributes. In addition, as more common attributes (i.e., ones not expected to affect target binding) can be quantified in this workflow, more negative controls can be included to facilitate reliable determination of pCQAs. Briefly, after competitive binding experiments, the unfractionated control sample and the unbound fraction were both subjected to trypsin digestion followed by liquid chromatography-MS/MS analysis. After identifying each attribute (i.e., modification) at tryptic peptide level, its relative abundance was calculated using the integrated XIC peak areas from both the modified and the unmodified peptides, and subsequently compared between the two samples.
To demonstrate the utility of this workflow, the three mAb molecules that were previously studied by IEX-MS were also subjected to tryptic digestion-based bottom-up analysis. After quantifying each attribute (Table S1-3), the percent increase in relative abundance of each attribute (from the unfractionated control sample to the unbound fraction) was plotted against the p value from the Student’s t-test based on the three-replicate measurement (). For bsAb-1, it is evident that all three HC CDR Lys98 modifications were enriched in the unbound fraction with statistical significance (red dots, ). In contrast, the other 14 attributes showed either an increase or decrease in relative abundance (black dots, , Table S1), where both the magnitude of change and the significance were much smaller compared to that of the three CDR modifications. Similar observations were also noticed for bsAb-2, where the HC CDR Asn56 deamidation exhibited significant enrichment in the unbound fraction (red dot, ). Again, other attributes, including modifications on the HC constant domains and modifications on the HC* showed no significant quantitative difference between the two samples (black dots, , Table S2). Interestingly, Met119 oxidation on the HC variable domain did not seem to impact the HC-corresponding target binding, even though it occurs near the HC CDR3.
Figure 4. Volcano plot for attribute criticality assessment using competitive-binding and bottom-up analysis in (a) bsAb-1, (b) bsAb-2, and (c) msAb-2. The x-axis represents the percent increase in relative abundance of each attribute from the unfractionated control sample to the unbound fraction. The vertical dashed line (x = 0) represents no difference in abundance between the two samples. (4a) volcano plot of 17 attributes in bsAb-1 using relative abundance increase and p-value, showing only HC Lys98 glycation, carboxymethylation and glycation exhibited statistically significant abundance increases. (4b) volcano plot of 18 attributes in bsAb-2 using relative abundance increase and p-value, showing only HC Asn56 deamidation exhibited statistically significant abundance increase. (4c) volcano plot of 18 attributes in msAb-2 using relative abundance increase and p-value, showing only HC Asn56 deamidation exhibited statistically significant abundance increase.
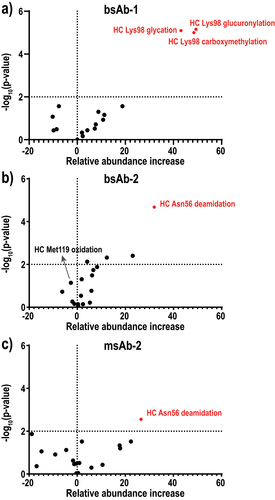
For msAb-2, the HC CDR Asn56 deamidation was found to be slightly enriched in the unbound fraction with statistical significance (red dot, ). It is worth noting, though, the quantitation of Asn56 deamidation by bottom-up approach was contributed by both mAb variants with either one or two HC Asn56 deamidated. Although the singly deamidated species were not significantly enriched in the unbound fraction according to the AEX-MS analysis at intact mAb level, the doubly deamidated species were significantly enriched, consistent with the results from the bottom-up analysis. Nevertheless, comparing to the CDR modifications in the other two examples, the HC CDR Asn56 deamidation in msAb-2 did not show a clear separation from the other attributes in both the extent of enrichment and the significance. This suggested that this CDR modification might only affect target binding in a limited way. Compared to the IEX-MS analysis at intact mAb level, the bottom-up approach can simultaneously quantify many PTMs present at very low abundances (e.g., 0.1%), and thus achieve high-throughput evaluation of multiple attributes.
Discussion
During the development of therapeutic mAbs, identification of pCQAs is an important step that provides guidance during candidate selection and a framework for risk assessment. Traditionally, identification of target-binding associated pCQA often involves a laborious and low-throughput variant enrichment step prior to binding affinity measurement. In this work, we developed a novel competitive binding-MS strategy that enables high-throughput and multiplexed assessment of pCQAs directly from unfractionated and unstressed mAb drug samples. Unlike reported methods, our workflow performs competitive binding on the immobilized antigen, and thus allows the enrichment of mAb variants with impaired target binding in the unbound fraction. Following the enrichment, quantitative MS approaches were adopted to compare the relative abundances of multiple attributes in the unfractionated control sample and in the unbound fraction, leading to pCQA identification. Notably, to ensure a proper competitive binding environment, a titration experiment was performed to determine the mixing ratio of the immobilized antigen to antibody. Using a bsAb (HH*L2) and its homodimer msAb (H2L2) as model systems, it was determined that the desired extent of antibody depletion is moderate for bsAb analysis (e.g., 50%), but much more stringent for msAb analysis (≥ 90%). The validity and utility of this method was demonstrated in three mAb case studies, including two bsAb molecules and one msAb molecule, where different CDR and non-CDR attributes were successfully interrogated for their impact on antigen binding. We also showed that native IEX-MS method can be applied to achieve rapid quantitation of multiple CDR modifications at intact mAb level. On the other hand, bottom-up analysis can provide a more comprehensive assessment of many attributes due to its excellent resolving power and sensitivity. Using common attributes as negative controls, the identification of pCQAs can be reliably achieved.
In summary, this newly developed competitive binding-MS approach offers several unique advantages over conventional strategies in pCQA identification, including higher throughput, greater sensitivity, and broader applicability. This new method is particularly desirable during the early stage drug developability assessment, where limited sample material is available and fast turn-around time is often required. Furthermore, this workflow should also be applicable to support various stability studies, where new pCQAs may emerge under different forced degradation conditions. Lastly, in addition to target binding, other attributes that are critical for various Fc receptor binding can also be evaluated using the same platform. For example, using neonatal Fc receptor (FcRn) as the binding target, attributes that impact FcRn-antibody binding can be evaluated, which are important for the half-life of the drug molecule.Citation25,Citation26 Similarly, using FcγR as binding target, attributes associated with Fc-mediated effector functions, such as antibody-dependent cell-mediated cytotoxicity (ADCC) or complement-dependent cytotoxicity (CDC), can also be evaluated.Citation27,Citation28
Materials and Methods
Chemicals and reagents
bsAb-1, bsAb-2, msAb-1, msAb-2, and their corresponding antigens are all produced at Regeneron (Tarrytown, NY). Ammonium acetate (MS grade), acetic acid (MS grade), dimethyl sulfoxide (DMSO), phosphate-buffered saline (PBS), urea, and Amicon centrifugal filters were obtained from Sigma-Aldrich (St. Louis, MO). EZ-Link™ NHS-Biotin, Pierce™ streptavidin agarose resin, Pierce™ micro-spin columns, acetonitrile (ACN; liquid chromatography-MS grade), formic acid (FA), dithiothreitol (DTT), iodoacetamide (IAA), and Invitrogen UltraPure 1 M Tris-HCl buffer, pH 7.5 were purchased from Thermo Fisher Scientific (Waltham, MA). Sequencing grade modified trypsin was purchased from Promega (Madison, WI). A BioPro IEX SF column (4.6 mm×100 mm, 5 μm; YMC Co., Ltd., Kyoto, Japan) and BioPro QA-F SAX column (4.6 mm × 100 mm, 5 μm; YMC Co., Ltd., Kyoto, Japan) were used for SCX and AEX separation, respectively. A C18 column (ACQUITY Ultra-performance liquid chromatography peptide BEH 1.7 μm, 2.1 mm × 150 mm, Waters, Milford, MA) was used for bottom-up analysis.
Antigen biotinylation and conjugation with strepavidin resin
All antigens were biotinylated using EZ-Link™ NHS-Biotin. Immediately before use, a 10 mM biotin solution was prepared by dissolving 2.0 mg reagent in 300 μL of DMSO. Antigens were incubated at concentrations between 2 to 5 mg/mL in the presence of 12-fold molar excess of biotin in PBS at room temperature for 30 minutes. After biotinylation, excess biotin reagent was removed using an Amicon centrifugal filter unit (10 kDa MW cutoff) and buffer exchanged into 100 mM Tris-HCl (pH 7.5). The concentration of the biotinylated antigen was then determined using Nanodrop 2000 spectrophotometer (ThermoFisher Scientific, Waltham, MA USA) by measuring UV absorbance at 280 nm. Biotinylated antigen was conjugated onto streptavidin agarose resin by incubating biotinylated antigen and settled resin at 2 × 10⁻⁵ µmole antigen per µL of resin for one hour at room temperature. The conjugated resin was then washed and equilibrated using 100 mM Tris-HCl buffer, pH 7.5.
Competitive binding experiment
To titrate the competitive binding conditions, an increasing amount of antigen-immobilized resin (2 µL, 4 µL, 8 µL, 10 µL, 20 µL, 40 µL, 60 µL, 80 µL, 100 µL, 120 µL, 140 µL, and 160 µL) was each placed into a micro-spin column and the solution was removed by centrifuging at 3000 g for 1 min. An aliquot of the mAb solution (10–20 uL) containing ~0.4 nmole of mAb was then added into each micro-spin column and incubated at room temperature for 45 min. The mixture was then centrifuged at 3000 g for 1 min to collect the unbound fraction. Both the mAb unfractionated control sample and the unbound fraction were then subjected to UV absorbance measurement at 280 nm to calculate the relative percentage of the mAb in the unbound fraction (i.e., the depletion level). For the competitive binding experiments, an aliquot of each mAb sample was incubated with selected amount (pre-determined from the titration experiment) of the corresponding antigen-immobilized resin at room temperature for 45 min. The sample was then centrifuged at 3000 g for 1 min to collect the unbound fraction. Both the unbound fraction and the unfractionated control sample were then subjected to IEX-MS or bottom-up analysis.
Intact MS analysis using SCX-MS and AEX-MS
For SCX−MS analysis, a BioPro IEX SF column (4.6 mm×100 mm, 5 μm; YMC Co., Ltd., Kyoto, Japan) was used at 45°C with a linear gradient from 20 mM ammonium acetate (pH 5.6, adjusted with acetic acid) to 150 mM ammonium acetate (pH 6.8) in 16 min at 0.4 mL/min. For AEX-MS analysis, a BioPro QA-F SAX column (4.6 mm × 100 mm, 5 μm; YMC Co., Ltd., Kyoto, Japan) was used at 45°C with a linear gradient from 10 mM ammonium acetate (pH 6.8) to 300 mM ammonium acetate (pH 6.8) in 16 min at 0.4 mL/min. An aliquot of 5.0 µL proteins were loaded on the column. A Thermo Q Exactive UHMR mass spectrometer equipped with a Newomics MnESI ionization source and a Microfabricated Monolithic Multi-nozzle (M3) emitter (Berkeley, CA) was used for data acquisition. The detailed MS settings were the same as reported by Yan et al.Citation29
Tryptic digestion and bottom-up analysis
Each unbound fraction (20 µL) and the unfractionated control sample (diluted to the same concentration as the unbound fraction, 20 µL) was mixed with 100 µL of 8 M urea and 10 mM DTT in 0.1 M Tris-HCl (pH 7.5) and incubated at 50°C for 30 minutes. The denatured and reduced samples were then alkylated with 25 mM IAA at room temperature in the dark for 30 minutes, followed by dilution with 0.1 M Tris-HCl (pH 7.5) to 600 µL. Each sample was mixed with 20 µg trypsin and digested at 37°C overnight. Digestion was halted by adding formic acid (FA) to 1%. Approximate 1.2 μg (for msAb) or 6 μg (for bsAb) of the digested sample was loaded onto a C18 column (ACQUITY Ultra-performance liquid chromatography peptide BEH 1.7 μm, 2.1 mm × 150 mm, Waters, Milford, MA) and separated by a 90 min gradient with 0.1% FA in water as mobile phase A, and 0.1% FA in ACN as mobile phase B (0−5 min, 0.1% B; 5−80 min, 0.1−35% B; 80−85 min, 35−90% B; 85−90 min, 90% B). The mobile phase flow rate was 0.25 mL/min. The column temperature was set at 40°C. The instrument source parameters were set as following: spray voltage 3.8 kV, auxiliary gas 10, auxiliary gas temperature 250°C, capillary temperature 350°C, and S-lens RF level 50. A top five data-dependent acquisition method (DDA) was applied for MS/MS data acquisition during online liquid chromatography separation. The following settings were applied for MS1 scans: resolution 70k, AGC target 1E6, maximum ion injection time 50 ms, and scan range 300−2000 m/z. For HCD MS/MS scans, the following settings were applied: isolation window 4 m/z, NCE 27, scan range 200−2000 m/z, resolution 17.5k, AGC target 1E5, and maximum ion injection time 100 ms. The raw data files were searched against the antibody FASTA sequences using Byonic (version 3.9.4, Protein Metrics, San Carlos, CA) for PTM identification.
Data analysis
All experiments were performed in triplicates. Integration of the XIC peak for the SCX-MS and AEX-MS analysis was performed using Thermo Fisher Xcalibur software (version 3.0). Peptide and PTM identification were achieved using Byonic software (version 3.9.4, Protein Metrics, San Carlos, CA). PTM quantitation at peptide level was performed using Skyline software (version 20.1, MacCoss Lab Software, Seattle, USA). The Student’s t-test was performed using GraphPad Prism (version 8.0, GraphPad Software Inc., San Diego, CA).
Supplemental Material
Download MS Word (1.1 MB)Acknowledgments
This study was sponsored by Regeneron Pharmaceuticals Inc.
Disclosure statement
The authors declare the following competing financial interest(s): Z.Z., Y.Y., S.W., and N.L. are full-time employees and shareholders of Regeneron Pharmaceuticals Inc.
Supplementary material
Supplemental data for this article can be accessed online at https://doi.org/10.1080/19420862.2022.2133674
Additional information
Funding
References
- Torre BG, Albericio F. The pharmaceutical industry in 2020. An analysis of FDA drug approvals from the perspective of molecules. Molecules. 2021;26:627. PMID: 33504104. doi:10.3390/molecules26030627.
- Krishnan M, Darling S. Meeting analytical challenges in a brave new world of next generation biotherapeutics. Drug Discovery. 2020;21:31–9.
- Rogers RS, Abernathy M, Richardson DD, Rouse JC, Sperry JB, Swann P, Wypych J, Yu C, Zang L, Deshpande R. A view on the importance of “multi-attribute method” for measuring purity of biopharmaceuticals and improving overall control strategy. AAPS J. 2018;20(1):1–8. PMID: 29192343. doi:10.1208/s12248-017-0168-3.
- Jefferis R. Posttranslational modifications and the immunogenicity of biotherapeutics. J Immunol Res. 2016;2016:5358272. PMID: 27191002. doi:10.1155/2016/5358272.
- Jenkins N, Murphy L, Tyther R. Post-translational modifications of recombinant proteins: significance for biopharmaceuticals. Mol Biotechnol. 2008;39(2):113–18. PMID: 18327554. doi:10.1007/s12033-008-9049-4.
- Moritz B, Stracke JO. Assessment of disulfide and hinge modifications in monoclonal antibodies. Electrophoresis. 2017;38(6):769–85. PMID: 27982442. doi:10.1002/elps.201600425.
- Wang Q, Chung CY, Chough S, Betenbaugh MJ. Antibody glycoengineering strategies in mammalian cells. Biotechnol Bioeng. 2018;115:1378–93. PMID: 29457629. doi:10.1002/bit.26567.
- Wang W, Singh S, Zeng DL, King K, Nema S. Antibody structure, instability, and formulation. J Pharm Sci. 2007;96:1–26. PMID: 16998873. doi:10.1002/jps.20727.
- Beyer B, Schuster M, Jungbauer A, Lingg N. Microheterogeneity of recombinant antibodies: analytics and functional impact. Biotechnol J. 2018;13:1700476. PMID: 28862393. doi:10.1002/biot.201700476.
- Hmiel LK, Brorson KA, Boyne MT. Post-translational structural modifications of immunoglobulin G and their effect on biological activity. Anal Bioanal Chem. 2015;407(1):79–94. PMID: 25200070. doi:10.1007/s00216-014-8108-x.
- Li W, Kerwin JL, Schiel J, Formolo T, Davis D, Mahan A, Benchaar SA. Structural elucidation of post-translational modifications in monoclonal antibodies. State-of-the-art and emerging technologies for therapeutic monoclonal antibody characterization volume 2. Biopharm Character. 2015:119–83. doi:10.1021/bk-2015-1201.
- Yan Y, Wei H, Fu Y, Jusuf S, Zeng M, Ludwig R, Krystek SR, Chen G, Tao L, Das TK. Isomerization and oxidation in the complementarity-determining regions of a monoclonal antibody: a study of the modification-structure-function correlations by hydrogen-deuterium exchange mass spectrometry. Anal Chem. 2016;88(4):2041–50. PMID: 26824491. doi:10.1021/acs.analchem.5b02800.
- Saitoh S. The identification of Critical Quality Attributes (CQAs) for the development of antibody drugs. Yakugaku zasshi. 2018;138(12):1475–81. PMID: 30504661. doi:10.1248/yakushi.18-00020-1.
- Fogel DB. Factors associated with clinical trials that fail and opportunities for improving the likelihood of success: a review. Contemp Clin Trials Commun. 2018;11:156–64. PMID: 30112460. doi:10.1016/j.conctc.2018.08.001.
- Geigert J. The challenge of CMC regulatory compliance for biopharmaceuticals and other biologics. Springer. 2013. doi:10.1007/978-1-4614-6916-2.
- Yan Y, Liu AP, Wang S, Daly TJ, Li N. Ultrasensitive characterization of charge heterogeneity of therapeutic monoclonal antibodies using strong cation exchange chromatography coupled to native mass spectrometry. Anal Chem. 2018;90(21):13013–20. PMID: 30280893. doi:10.1021/acs.analchem.8b03773.
- Zhang Y, Martinez T, Woodruff B, Goetze A, Bailey R, Pettit D, Balland A. Hydrophobic interaction chromatography of soluble interleukin I receptor type II to reveal chemical degradations resulting in loss of potency. Anal Chem. 2008;80(18):7022–28. PMID: 18707131. doi:10.1021/ac800928z.
- Fekete S, Veuthey J-L, Beck A, Guillarme D. Hydrophobic interaction chromatography for the characterization of monoclonal antibodies and related products. J Pharm Biomed Anal. 2016;130:3–18. PMID: 27084526. doi:10.1016/j.jpba.2016.04.004.
- Wang S, Liu AP, Yan Y, Daly TJ, Li N. Characterization of product-related low molecular weight impurities in therapeutic monoclonal antibodies using hydrophilic interaction chromatography coupled with mass spectrometry. J Pharm Biomed Anal. 2018;154:468–75. PMID: 29587227. doi:10.1016/j.jpba.2018.03.034.
- Kükrer B, Filipe V, van Duijn E, Kasper PT, Vreeken RJ, Heck AJ, Jiskoot W. Mass spectrometric analysis of intact human monoclonal antibody aggregates fractionated by size-exclusion chromatography. Pharm Res. 2010;27(10):2197–204. PMID: 20680668. doi:10.1007/s11095-010-0224-5.
- Lu C, Liu D, Liu H, Motchnik P. Characterization of monoclonal antibody size variants containing extra light chains. MAbs. 2013;5(1):102–13. PMID: 23255003. doi:10.4161/mabs.22965.
- Thiagarajan G, Widjaja E, Heo JH, Cheung JK, Wabuyele B, Mou X, Shameem M. Use of Raman and Raman optical activity for the structural characterization of a therapeutic monoclonal antibody formulation subjected to heat stress. J Raman Spectrosc. 2015;46(6):531–36. doi:10.1002/jrs.4679.
- Bondarenko P, Nichols AC, Xiao G, Shi RL, Chan PK, Dillon TM, Garces F, Semin DJ, Ricci MS. Identification of critical chemical modifications and paratope mapping by size exclusion chromatography of stressed antibody-target complexes. MAbs. 2021;13(1):1887629. PMID: 33615991. doi:10.1080/19420862.2021.1887629.
- Shi RL, Xiao G, Dillon TM, McAuley A, Ricci MS, Bondarenko PV. Identification of critical chemical modifications by size exclusion chromatography of stressed antibody-target complexes with competitive binding. MAbs. 2021;13(1):1887612. PMID: 33616001. doi:10.1080/19420862.2021.1887612.
- Andersen JT, Dalhus B, Viuff D, Ravn BT, Gunnarsen KS, Plumridge A, Bunting K, Antunes F, Williamson R, Athwal S, et al. Extending serum half-life of albumin by engineering neonatal Fc receptor (FcRn) binding. J Biol Chem. 2014;289:13492–502. PMID: 24652290. doi:10.1074/jbc.M114.549832.
- Stracke J, Emrich T, Rueger P, Schlothauer T, Kling L, Knaupp A, Hertenberger H, Wolfert A, Spick C, Lau W, et al. A novel approach to investigate the effect of methionine oxidation on pharmacokinetic properties of therapeutic antibodies. MAbs. 2014;6(5):1229–42. PMID: 25517308. doi:10.4161/mabs.29601.
- Iida S, Misaka H, Inoue M, Shibata M, Nakano R, Yamane-Ohnuki N, Wakitani M, Yano K, Shitara K, Satoh M. Nonfucosylated therapeutic IgG1 antibody can evade the inhibitory effect of serum immunoglobulin G on antibody-dependent cellular cytotoxicity through its high binding to FcγRIIIa. Clin Cancer Res. 2006;12(9):2879–87. PMID: 16675584. doi:10.1158/1078-0432.CCR-05-2619.
- Niwa R, Hatanaka S, Shoji-Hosaka E, Sakurada M, Kobayashi Y, Uehara A, Yokoi H, Nakamura K, Shitara K. Enhancement of the antibody-dependent cellular cytotoxicity of low-fucose IgG1 is independent of FcγRIIIa functional polymorphism. Clin Cancer Res. 2004;10(18):6248–55. PMID: 15448014. doi:10.1158/1078-0432.CCR-04-0850.
- Yan Y, Xing T, Wang S, Li N. Versatile, sensitive, and robust native LC–MS platform for intact mass analysis of protein drugs. J Am Soc Mass Spectrom. 2020;31(10):2171–79. PMID: 32865416. doi:10.1021/jasms.0c00277.