
ABSTRACT
Detection of host cell protein (HCP) impurities is critical to ensuring that recombinant drug products, including monoclonal antibodies (mAbs), are safe. Mechanistic characterization as to how HCPs persist in drug products is important to refining downstream processing. It has been hypothesized that weak lipase–mAb interactions enable HCP lipases to evade drug purification processes. Here, we apply state-of-the-art methods to establish lipase-mAb binding mechanisms. First, the mass spectrometry (MS) approach of fast photochemical oxidation of proteins was used to elucidate putative binding regions. The CH1 domain was identified as a conserved interaction site for IgG1 and IgG4 mAbs against the HCPs phospholipase B-like protein (PLBL2) and lysosomal phospholipase A2 (LPLA2). Rationally designed mutations in the CH1 domain of the IgG4 mAb caused a 3- to 70-fold KD reduction against PLBL2 by surface plasmon resonance (SPR). LPLA2-IgG4 mutant complexes, undetected by SPR and studied using native MS collisional dissociation experiments, also showed significant complex disruption, from 16% to 100%. Native MS and ion mobility (IM) determined complex stoichiometries for four lipase-IgG4 complexes and directly interrogated the enrichment of specific lipase glycoforms. Confirmed with time-course and exoglycosidase experiments, deglycosylated lipases prevented binding, and low-molecular-weight glycoforms promoted binding, to mAbs. This work demonstrates the value of integrated biophysical approaches to characterize micromolar affinity complexes. It is the first in-depth structural report of lipase-mAb binding, finding roles for the CH1 domain and lipase glycosylation in mediating binding. The structural insights gained offer new approaches for the bioengineering of cells or mAbs to reduce HCP impurity levels.
Abbreviations: CAN, Acetonitrile; AMAC, Ammonium acetate; BFGS, Broyden–Fletcher–Goldfarb–Shanno; CHO, Chinese Hamster Ovary; KD, Dissociation constant; DTT, Dithiothreitol; ELISA, Enzyme-linked immunosorbent assay; FPOP, Fast photochemical oxidation of proteins; FA, Formic acid; F(ab’), Fragment antibodies; HCP, Host cell protein; IgG, Immunoglobulin; IM, Ion mobility; LOD, Lower limit of detection; LPLA2, Lysosomal phospholipase A2; Man, Mannose; MS, Mass spectrometry; MeOH, Methanol; MST, Microscale thermophoresis; mAbs, Monoclonal antibodies; PPT1, Palmitoyl protein thioesterase; ppm, Parts per million; PLBL2, Phospholipase B-like protein; PLD3, Phospholipase D3; PS-20, Polysorbate-20; SP, Sphingomyelin phosphodiesterase; SPR, Surface plasmon resonance; TFA, Trifluoroacetic acid.
Introduction
Host cell proteins (HCPs) are proteins from the host organism (e.g., Escherichia coli, Cricetulus griseus (Chinese hamster ovary (CHO)) that are present in final protein therapeutic formulations.Citation1 These “hitch-hiking proteins” persist in final products because of interactions with the therapeutic mAb molecule, purification columns or other contact surfaces, where complex formations have a large concentration-dependence.Citation2 HCPs pose a number of problems as drug impurities. They can directly trigger immune responses in patients, shorten the shelf-life of drugs, reduce potency, or de-stabilize the drug formulation.Citation3,Citation4 For example, co-purification of the lipase phospholipase B like protein (PLBL2) with the monoclonal antibody lebrikizumab caused a majority of the patients being treated with the drug product to develop an immune response to PLBL2 and resulted in setbacks for two clinical studies.Citation5 Additionally, several other reports have implicated HCP co-purification in fragmentation and proteolytic cleavage of the protein therapeutic, as well as particle formation due to degradation of some excipients, significantly impacting product quality.Citation6–8 While the levels of these HCPs in the final drug product are usually expected by the US Food and Drug Administration to be less than 100 parts per million (ppm) by enzyme-linked immunosorbent assay (ELISA),Citation9 in the case of enzymatic HCPs, such as esterases, these low levels can still have adverse effects on the product quality of the protein therapeutic.Citation1,Citation10
Esterases represent a class of HCPs that are believed to play an important role in drug product shelf-life.Citation7,Citation11,Citation12 They, and especially their subclass of lipases, have the capacity to degrade the excipient polysorbate-20 (PS-20) and may lead to the generation of sub-visible particles in product formulation.Citation13 PLBL2 is the only lipase that has been shown to directly bind to the therapeutic antibody molecule,Citation14 yet it is no longer thought to play a significant role in PS-20 degradation.Citation15 Other esterases found in even lower abundance in drug formulations have been demonstrated to have residual activity, though a direct drug–lipase interaction has not been observed.Citation7,Citation11–13,Citation16,Citation17 Establishment of a physical interaction between HCPs and drugs would provide a structural basis to help refine the methods for purification or drug engineering strategies to mitigate the levels of the impurity.
With the exception of PLBL2–antibody interactions, binding studies have not been feasible across this class of HCPs due to their low affinities. Thus, emerging technologies and approaches are needed to explore these interactions. Characterization of very weak protein–protein interactions, such as HCP–therapeutic complexes, are often poorly understood due to the challenges in isolating the complexes in their intact form. Traditional screening methods include biochemical fractionation, affinity purification, on-chip and protein-fragment screening, and mass spectrometry (MS) proximity labeling approaches.Citation16 Targeted methods offer an opportunity to directly observe interactions and map areas of binding. Native solution state assays, including analytical ultra-centrifugation and MS, make up part of a biophysical toolbox for characterization, where MS provides the highest level of confidence in identification, but may only be suitable for studying less than tens of micromolar affinity complexes.Citation18 Higher throughput techniques, including surface plasmon resonance (SPR)Citation19 and microscale thermophoresis (MST)Citation20 offer higher sensitivity, but require labeling or immobilization of proteins that can interfere with binding.Citation21 Particle sizing methods, including light scattering, differential mobility analysis, and atmospheric ion mobility (IM) spectrometry, offer high throughput and sensitivity, but rely on calibration or inference from measured mobility values.Citation22,Citation23
Here, we propose, with evidence, structural mechanisms that drive mAb-esterase binding. The analysis demonstrates the suitability of various techniques to detect the binding of highly unstable complexes. Complementary techniques are used, including native MS to determine binding stoichiometry, fast photochemical oxidation of proteins (FPOP) to determine the binding region,Citation24 MST to screen mutations and generate affinity constants, and IM to infer glycosylation patterns enriched in complexes. A conserved mAb region for binding is established, and a new role for lipase glycosylation mediated binding is hypothesized.
Results
Lipase and esterase-class protein complexing of antibodies
This study first sought to determine what technologies could be successful at assessing lipase and esterase binding to antibodies, with two goals of characterizing affinity and complex stoichiometry, and then looked at the structural basis for the binding. Technologies evaluated included SPR, as a traditional affinity assay, MST, as an alternative to SPR for ultra-low-affinity complex preservation, native MS, as a label-free native assay, and IM, to determine the relative amount of complex formed.
SPR analysis was successful in detecting PLBL2-antibody binding, but failed to observe LPLA2 interactions. MST analysis was able to detect all antibody-lipase pairs. LPLA2 binding was weaker compared to PLBL2 for all antibodies tested (). IgG4 binding was tighter compared to IgG1 antibodies, and the IgG2 antibody binding data were inconsistent. The precise rank order of the dissociation constants between antibodies differed between assays, suggesting that the tagging of proteins or immobilization of proteins led to differences in binding. Additionally, certain complexes fell below the limit of quantitation for various assays. The range in KD was approximately 20-fold by MST and 90-fold by SPR. While direct measurements of affinity constants, coupled to a high-throughput assay, were features of both technologies, the wide error (>30% CV in some cases) and limited sensitivity for 1–90 micromolar affinity complexes necessitated a shift to an orthogonal strategy.
Table 1. SPR and MST binding of mAbs to PLBL2 and LPLA2.
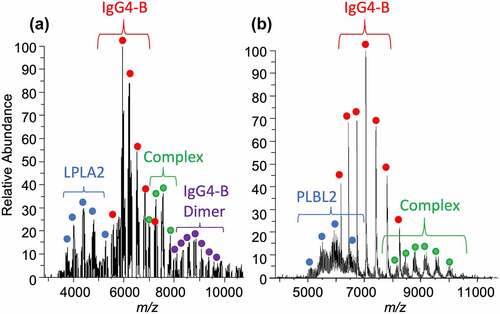
Native MS offered an opportunity to detect non-immobilized or unlabeled complexes and determine the stoichiometry. Native MS was used to first characterize the lipases (Figure S1) and the antibodies uncomplexed, free in solution (Figure S2). The lipases were observed to have extensive glycosylation patterns, and LPLA2 and PLBL2 had a deconvolution mass range from 62 to 76 and 66 to 80 kDa, respectively. Deglycosylation of the lipases showed that the glycosylation load ranged from approximately 20,000–30,000 and 5000–19,000 Da, respectively (Figure S1). The simplified deglycosylated spectra revealed that the proteins contained no other post-translational modifications (PTMs). Detection of antibody lipase complexes was achieved by re-optimizing MS transmission parameters (). Complex formation was tested at a 1:10 and 10:1 lipase:antibody molar ratio (Figure S3). Even at the 10:1 lipase:mAb ratio used for the rest of the MS studies, the antibody charge state distribution appeared with higher intensity compared to the lipase because of its preferred MS ionization. Complexes of LPLA2 and PLBL2 bound to antibody showed high heterogeneity (), indicating that multiple lipase glycoforms were complexed. A 1:1 stoichiometry was observed with an average mass of approximately 218 kDa for PLBL2 and 213 kDa for LPLA2 antibody complexes. While the complex masses have errors in the 30–100 Da range due to the peaks’ low resolution and overlapping glycoforms, this error would not affect the determination of the stoichiometry or the interpretation of the approximate sizes of the glycans attached.
Figure 1. Native mass spectrum of 10:1 IgG4-B to (a) LPLA2 and (b) PLBL2.
The high sensitivity of native MS offered an opportunity to screen additional ultra-low-affinity binders from the esterase family, including palmitoyl protein thioesterase (PPT1),Citation4 phospholipase D3 (PLD3),Citation25 and sphingomyelin phosphodiesterase (SP)Citation26 (), which were previously identified as persisting in drug formulations through proteomics experiments. SP was not detected, and PPT1 and PLD3 complexes could only be observed in 100 mM ammonium acetate, rather than 50 mM. For PPT1, found at 0.6% relative abundance, binding was only achieved at a 100:1 protein:mAb solution ratio (). For PLD3 (), which exists naturally as a dimer, a 2:1 stoichiometric complex at 0.8% levels was observed in a 10:1 solution ratio. Thus, the native stoichiometric state of the esterase was shown in each case to bind a single antibody.
Figure 2. (a) 1:1 PPT1:IgG4-B stoichiometric complex formed in a solution at 100:1 relative molar concentration. (b) 2:1 stoichiometric PLD3: IgG4-B complex formed at 10:1 relative molar concentration in solution. PLD3 was found naturally in solution as a dimer. The mAb peak (not shown) at 6439 m/z (+23) is set to 100% relative abundance in each spectrum for scale. The antibody is 0.27 μM.
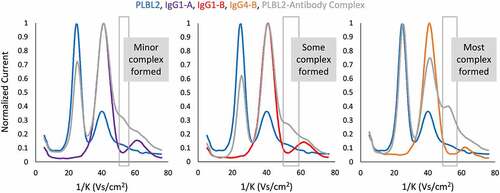
For the cases of PLBL2 and LPLA2, the heterogeneity of the lipase created challenges in the deconvolution of mass spectral data. Furthermore, the complex was only preserved through static spray MS, but not in Triversa NanoMate (Advion, Inc., Ithaca, NY) infusion experiments or liquid chromatography, which limited the throughput of this method. Therefore, a non-MS electrospray IM spectrometry instrument (Figure S4) was evaluated as a first-in-kind screening technology for noncovalent protein complexes in native solutions. In non-MS IM, electrosprayed proteins are produced with a single charge and follow a trajectory around a central rod, in a given electric field, based on their collisional cross-sectional area.Citation27 The inverse mobility (1/K) of ions across a swept voltage range was modeled, where higher inverse mobilities generally correlated with larger species. For each experiment, signals for the control lipase, antibody, and complex species were normalized and compared (). PLBL2 (25.3 1/K) binding to IgG4-B, IgG1-B, and IgG1-A gave rise to a peak at 51.4 1/K, between the monomer mAb (40.9 1/K) and the electrospray gas-phase dimer (60.2 1/K). A minor peak was observed for the PLBL2-IgG1-A complex, suggesting that IM may have a lower limit of detection (LOD) than MST. However, neither PPT nor PLD3 antibody binding could be detected using this method. The amount of complex detected agreed with the prior results, where PLBL2 complex showed a clear rank order in formation of IgG4-B> IgG1-B> IgG1-A.
Figure 3. Ion mobility spectra of IgG1-A (purple), IgG1-B (red), and IgG4-B (orange) complexed to PLBL2 (blue) resulted in different quantities of 1:1 complex (gray) detected at ~51 1/K.
Lipase glycoform effects on complex binding
Atmospheric IM analysis offered an opportunity to directly assess the binding of different lipase conformers to antibodies. A comparison of the mean inverse mobility of the monomer PLBL2 peak was made pre and post complexation. If all gycoforms of lipase bound equally to antibody, the peak would be expected to have a reduced amplitude, but maintain the same width and mean 1/K value. The rightward shift observed for the lipase peak () indicated that smaller-sized, or lesser-glycosylated, lipases complexed preferentially with the mAbs compared to their larger counterparts. To validate this observation, the effects of lipase glycosylation on complexation were further explored by more traditional analyses, including intact mass, glycan composition and exoglycosidase treatment.
Native MS was first used to assess if a complex could be formed after exoglycosidase treatment. Deglycosylation of the lipases LPLA2 and PLBL2 by PNGaseF prevented them from binding to all antibodies tested. Interestingly, desialylation of the lipases by neuraminidase had no effect on binding (Figure S5). Desialylated LPLA2 spectra were suitable for deconvolution, resulting in identification of 38 total species, of which 35 corresponded to differing glycosylation patterns, thus emphasizing the high heterogeneity of the native lipase sample (Table S1).
Glycosylation of proteins is known to vary across different lots of production.Citation28 An additional batch of LPLA2 (Figure S1E, named LPLA2-lot 2) and PLBL2 (Figure S1F, PLBL2-lot 2) were characterized in the hopes of generating structurally unique, differentially glycosylated, but native lipases. Lipase production was confirmed by enzymatic activity experiments. To determine the presence of any PTMs, simplified native MS spectra were generated by deglycosylating the lipases. The deglycosylated intact mass analysis was shown to exactly match the deglycosylated masses of lot 1, with no PTMs detected (Figure S1). However, compared with the reference batch of the native LPLA2, lot 2 had significantly fewer glycoforms of mass 65–70 kDa and was enriched in high-mass forms at 74–80 kDa. (Figure S1E). The charge states of the native spectra were similar between batches, suggesting the tertiary structure was intact.Citation29 LPLA2-lot 2 binding to IgG4 and IgG1 mAbs was not detected by native MS or MST. PLBL2-Lot binding was shown to be increased compared to the reference lot.
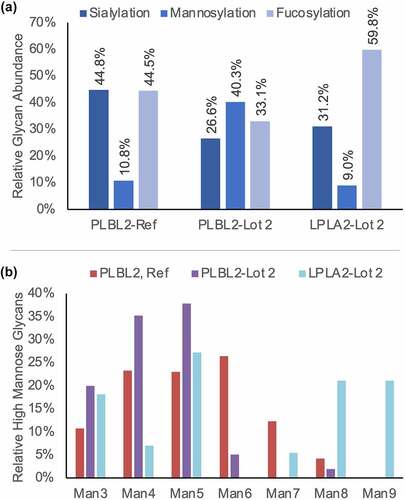
The compositions of PNGase F-released glycans were determined and assessed for trends that could explain the differences in lipase binding (). Compared to the reference, PLBL2-lot 2 had ~20% reduced sialylation, 30% increased mannosylation, and 10% decreased fucosylation. While there was insufficient sample remaining to analyze the released glycans from the LPLA2 reference, the LPLA2-lot 2 sample, which had no binding activity (activity was below the LOD for native MS, IM, and MST analyses), was predominantly composed of fucosylated species (60% relative abundance). As sialylation was known to be irrelevant to binding from the native MS binding experiments, and no trends in fucosylation were observed, the mannosylated species were further examined (). While LPLA2-lot 2 and the reference PLBL2 had similar levels of total mannosylation, nearly 50% of LPLA2-lot 2ʹs mannosylated species were >1200 Da (Man 7–9), whereas >80% of glycans in both PLBL2 samples were size Man6 or smaller. PLBL2-lot 2 had the highest percentage of small mannose species of the three samples.
Figure 4. (a) The relative abundance of sialylated, mannosylated, and fucosylated N-glycan species detected from each lipase. For glycans containing both a fucose and sialic species, its abundance was counted as contributing to both the fucosylated and sialylated groups. (b) The relative proportion of high mannose species detected for each lipase.
Storage of the reference lipases in their purification buffers at 4°C for 6 months resulted in the enrichment of certain glycoforms in solutions, with other glycoforms aggregating, sticking to the plastic vials, and/or precipitating.Citation30 Stored lipases had similar charge state distributions, implying that the tertiary structure was minimally perturbed. In all cases, refrigerated lipases failed to bind to antibodies (storage of samples at −80°C retained forms/activity) by native MS, creating a pseudo “knockout” experiment. At 6 months, the mannose species in each sample was significantly decreased compared to pre-storage conditions (Figure S6, Table S2). The levels of fucosylation and sialylation either remained approximately the same or increased proportionally to the reduction in mannosylation. The differences between the lot variants and the time course treatments, coupled to the changes observed in glycosylation, strongly speak for a role for glycosylation in mediating binding.
Determination of the antibody binding region for lipases
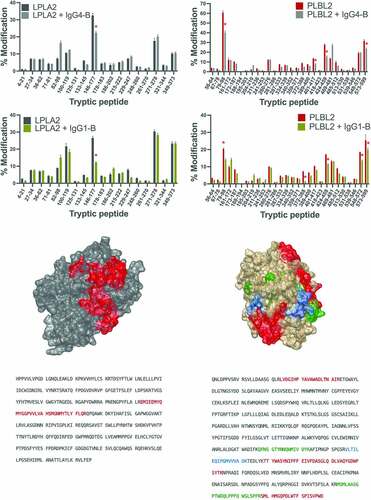
Fast photochemical oxidation of proteins offered an opportunity to assess differences in the solvent-exposed surface area (SASA) pre and post complexation at the protein level.Citation31–33 While FPOP cannot distinguish binding interfaces from binding-induced conformational changes, it provides regions that can be further interrogated for their precise role in binding.Citation34 Each mAb-lipase pair was studied in two experiments wherein there was an excess of the mAb (10:1 molar ratio of mAb:liapse) to completely saturate the lipase and the converse with excess of lipase (1:10 mAb to lipase) in order to completely saturate the mAb binding site. While non-overlapping error bars are considered practically significant, the analysis was limited to changes that were ≧5% to increase the likelihood of identifying direct interactions. Peptide 146–177 of LPLA2 had a significant decrease in oxidation after complexation to both IgG1-B and IgG4-B (). This indicated that these peptides were protected from the solvent on complexation, and therefore may be involved in binding to both antibodies. The interaction surface with PLBL2 appeared to be larger, as several peptides displayed decreases in oxidation levels ≧5% upon complex formation (). Peptides 79–98, 424–459 and 573–599 were common interacting regions with both IgG1-B and IgG4-B (). Peptides 372–388 and 548–572 displayed a reduction in oxidation only when complexed with IgG1-B, while peptide 424–459 only displayed a reduction in oxidation when in complex with IgG4-B. This indicated that these peptides may be unique binding sites to IgG1-B and IgG4-B, respectively.
Figure 5. Change in oxidation levels of LPLA2 peptides free or complexed to (a) IgG4-B or (b) IgG1-B. (c) Binding region of IgG4-B and IgG1-B mapped to the structure of LPLA2. (d) LPLA2 sequence with binding region and glycosylation sites highlighted. Change in oxidation levels of PLBL2 peptides free or complexed to (e) IgG4-B or (f) IgG1-B (g) Binding region of IgG4-B and IgG1-B mapped to the structure of PLBL2 (red = common binding region, blue = IgG4-B binding region, green = IgG1-B binding region). (h) PLBL2 sequence with binding region and glycosylation sites highlighted.
The converse experiment, with an excess of lipase, allowed identification of binding region on the mAbs (). When complexed to LPLA2, IgG4-B peptides 149–197 and 415–437 of the heavy chain (HC) had significantly less oxidation against the control. For PLBL2, IgG4-B light chain (LC) peptide 131–146, and HC peptides 6–38, 44–56, 76–122, 149–197, 254–286 and 415–437 showed reduced oxidation. The HC peptide 149–197 and 415–437 were a common IgG4-B binding interface for both enzymes. For IgG1-B complexes, LC peptides 46–53 for LPLA2 or 1–18 for PLBL2 displayed a reduction in oxidation. For both enzymes, HC peptides 47–67 and 152–214 were common interacting regions while peptide 279–292 was unique to PLBL2. For both IgG1-B and IgG4-B, a larger number of peptides have ≥5% reduction in oxidation as compared to LPLA2. This is consistent with the larger number of interacting sites identified in PLBL2.
Figure 6. Change in oxidation levels of peptides in IgG4-B free or complexed to (a) LPLA2 or (b) PLBL2 or IgG1-B free or complexed to (c) LPLA2 or (d) PLBL2.
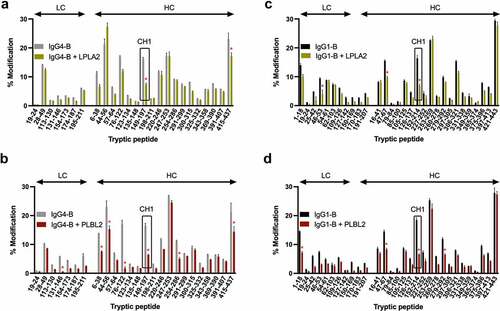
The oxidation changes in IgG4-B peptides 149–197 and IgG1-B 152–214 suggested that a common binding interface fell on the mAb constant CH1 region. Since this region is largely conserved across different antibodies (including subtypes), we hypothesized that this interface could be a universal binding site for the diverse class of lipases produced by host cells and found across different drug products. To test if binding could be disrupted, single alanine mutations of the 32 CH1 domain residues of IgG4-B were prepared and first screened against PLBL2 by SPR (Table S3). Fold decreases in KD ranged from 0- to 70-fold, with 84% having at least a 5-fold effect. The subset of mutations that most substantially reduced binding (30- to 70-fold) were then tested in the LPLA2-IgG4-B system by native MS and IM, to observe the effects in a native-type assay.
Compared to the stoichiometry and intact mass deconvolution experiments, the MS was re-tuned to preferentially increase the signal-to-noise of the complex peaks by changing to a lower resolving power (Table S4). The +29-charge state of each LPLA2 or PLBL2 – IgG4-B complex was then isolated in the MS and subjected to a dissociation experiment to extrapolate their relative binding affinities to mAb wild type (WT), where the VC50 represents the level of higher-energy collisional dissociation (HCD) fragmentation energy to dissociate 50% of the complex (Table S5, Figure S7). For mutants that knocked out binding such that the signal of the intact complex could not be measured (i.e., the lowest energy possible in the mass spectrometer fell on the S-curve slope), the VC50 is not reported (Figure S8). PLBL2 was a significantly more stable binder than LPLA2 against WT IgG4-B, with a VC50 approximately 2.5 times higher and a MS1 S/N approximately 7-fold higher (112.6 versus 15.6), reflecting the differences in their relative binding affinities revealed by MST (). Therefore, per unit HCD fragmentation voltage, LPLA2-IgG4-B complexes would be expected to undergo increased dissociation compared to PLBL2. The decreases observed in the binding energy (VC50) of the IgG4-B mutant species, compared to their respective wild types, against PLBL2 or LPLA2 showed similar trends (Table S5, ). Mutant L198A was too unstable for analysis when complexed to LPLA2 and likewise had over 50% reduced activity against PLBL2. Mutant P175A significantly decreased binding, with 95% confidence, against both lipases, with a 77% decrease in PLBL2 and a 17% decrease in LPLA2. While Q179A and V192A showed significantly decreased stability against PLBL2, there was no significant change in the Q179A VC50 against LPLA2, and a decrease of 6% for mutant V192A was only significant at the 90% confidence interval. Mutant K200A and F174A had a 16% and 13% decrease, respectively, in the VC50 versus the LPLA2-WT sample. No difference was observed for either species against PLBL2 complexes.
Figure 7. VC50 values extracted from native MS binding dissociation curves for (a) PLBL2 and (b) LPLA2 against IgG4-B. Confidence intervals (95%) are shown as error bars, with significant different to WT at 95% or 90% confidence shown as * or +, respectively.
To validate the MS data and compare the relative concentration of complex formed, IM analysis was performed for LPLA2-IgG4-B species (, Figure S9). Mutant L198A had an approximately 90% decrease in the amount of complex formed compared to WT, corroborating the low-levels detected by native MS. Mutants F174A, P175A, and Q179A were decreased over 50% compared to the WT. Minor decreases of 36% and 12% were observed for mutants V192A and K200A.
Table 2. Ratio of the LPLA2- IgG4-B complex peak areas, normalized against the total IM spectral area, for each of the IgG4-B mutants.
Discussion
Hypothesis-informed testing of lipase–antibody interactions through targeted and next-generation methods offers new opportunities to observe low-affinity host cell protein–antibody binding. In this study, the recombinant expression and purification of lipases allowed new methods to be developed for screening against multiple antibodies. Furthermore, we probed mechanistic aspects of antibody lipase complex formation and revealed a new role for lipase glycosylation mediating complexation and determined a common structural region located in the IgG4 and IgG1 constant heavy chain that affects binding. Our study represents the first in the field to take a detailed look at esterase–antibody interactions beyond PLBL2 and with non-SPR techniques. A structural understanding of universal esterase antibody mechanisms would substantially aid efforts to limit host cell impurities and improve drug products.
This work highlights the requirement for orthogonal and native solution techniques to characterize the binding of higher micromolar affinity complexes. Just as MST could screen for LPLA2 binding, which went undetected in SPR experiments, native MS observed PPT1 and PLD3 complexes that went undetected by MST. Differences in dissociation constants or in trends compared to VC50 values between the assays may be caused by a variety of factors.Citation35,Citation36 For example, immobilization of proteins in SPR may change orientation, labeling of proteins in MST may lead to structural changes, or the surrogate nature of HCD-induced dissociation in MS may affect results. Both IM and native MS offered an opportunity to interrogate stoichiometry, and while the MS deconvolved complex mass suggested that a smaller complex was formed, the IM data simplified the observation that low-molecular-weight lipases were enriched in the complex by enabling changes in the free lipase conformer distribution to be directly observed. Lastly, the FPOP experiments provided high-level structural details. It was only through the combination of these assays that a cohesive story on the impact of structure on binding be assembled.
Traditional approaches to detect host cell protein impurities have been hindered by the large dynamic range of co-purified proteins. A variety of sophisticated two-dimensional (2D) techniques, including MS/2D-gel electrophoresisCitation10,Citation37 and 2D-LC-MS,Citation38,Citation39 have proven most successful for detecting new impurities,Citation40 including esterases such as clusterin, PLBL2 and lipoprotein lipase. Yet these techniques cannot explain how HCPs persist into final products. Selection of lipases, and other members of the family of esterases, for targeted analysis could be based on these experimental proteomics datasetsCitation41 or the host cell’s protein database (to date, there are 193 results for CHO cell lipases in the TrEMBL database). Based on this approach, two lipases and one esterase (LPLA2, PPT1, and PLD3), previously found as impurities but never shown to bind directly, were tested and revealed in this study to bind by native MS (). PPT1 and PLD3 complexes could only be observed in higher ionic strength, suggesting that electrostatic repulsion could play a role in mediating binding. For PPT1, binding was only achieved at a 100:1 protein:mAb solution ratio (), supporting a concentration-dependent binding effect.Citation42 All ratios selected for analysis in this work were chosen to be both compatible with certain bioanalytical assays and to reflect actual relative ratios expected in antibody process purification steps, where antibodies are bound to the column and lipases are 0.5–5% of the flow-through. In all cases, the native solution state of the lipase (monomer or dimer) bound to one antibody.
MS and IM were used to further support structural hypotheses related to glycan mediation of lipase binding. Complexes were clearly enriched in low-molecular-weight glycans. While deglycosylation of lipases inhibited complex formation, desialylation had no effect on binding by native MS. While we do not have direct structural evidence for the type of glycans enriched, these negative results point toward fucosylated or mannosylated glycans as a complex promoter. The tightest binders, PLBL2-reference and PLBL2-lot 2, were enriched in low-numbered mannose glycans (Man3-5). PLBL2 lot 2, which had 10% fewer fucose species to the reference, bound tighter to antibodies. Likewise, in the second lot of LPLA2 produced, 60% was composed of fucosylated species and did not form mAb complexes. Generally, the theoretical molecular weight ranges of multi-antennary glycans are greater than sialylated glycans, which are greater than fucosylated glycans, which are greater than high mannose glycans. Thus, we believe the low-molecular-weight glycans enriched in the complexes are very likely low-number “high-mannose” glycans. Follow-up experiments with lipases that are fully enzymatically and structurally characterized from control and mannose-inhibited cell lines should be performed to test these hypotheses, but are beyond the scope of this study.
How lipase structure influences binding was also informed by FPOP. The common interaction sites identified by the reduced oxidation of LPLA2 and PLBL2 peptides on complexation with the mAbs did not overlap structural features with their previously defined functional roles, such as the site of the catalytic triad or the location of the alpha helix lids.Citation43,Citation44 The peptides showing significant oxidation changes in LPLA2 were in proximity to the four glycosylation sites found across the protein, and in PLBL2, the 424–459 conserved interaction did overlap a glycan site. This suggests that the role of glycosylation is likely indirect, by influencing the glycoprotein tertiary structure rather than directly mediating an interaction with the antibody. Peptide 82–98 showed a statistically significant increase in oxidation (~10%) after complexation to both mAbs, suggesting a conformational change occurred across the αA-αA’ loop of LPLA2 (the catalytic core).Citation44 In response to binding, PLBL2 showed an increase in the oxidation of peptide 469–481 against IgG4-B, suggesting increased solvent exposure, although this change was not observed against IgG1-B. Interesting, PLBL2 peptide 469–481 sits at the conserved N-terminal nucleophile hydrolase active site of PLBL2.Citation43 Further work could use glycoproteomic approaches to examine the changes of glycan-containing peptides, and also enhance coverage of the lipases through the use of non-tryptic enzymatic digestion.
Prior work to establish PLBL2-IgG4-B binding was performed using SPR,Citation10 which suggested a role for the F(ab’)2 domain, and these interactions were newly detailed in this study across multiple lipases and antibodies. With FPOP analysis, the SASA of specific regions on the lipase and mAbs were affected by binding, leading to significant decreases in the percent oxidation observed for the mAb CDR-L2, CDR-H1, and CDR-H3 regions. The CH1 domain was a common motif identified across all antibodies by FPOP. Conserved interactions in the CH1 may provide a baseline affinity for binding, while the antibody or lipase-specific binding regions may diminish or enhance affinity, accounting for different binding dissociation constants between a given lipase and different mAbs. Interestingly, the CH1 domain is also the location of a structural difference between IgG1 and IgG4 type antibodies. For IgG1s, the disulfide bond forms between the light chain and upper hinge, while a CH1 residue forms the disulfide bond in IgG4s. Differences in the binding affinity of lipases against these isotypes were observed by SPR and MST (). Mutagenesis across the CH1 region significantly diminished binding to LPLA2 and PLBL2. The results of the alanine-scan experiments were qualitatively consistent between SPR (), IM (), and native MS (). Mutant antibody screening was not possible with PLD3 and PPT1 due to the ultra-low affinity of the interactions, and although knockouts of the complex were observed with native MS with mutants, a change as small as 2% would result in the complex being below the detection limit of the instrument, limiting the conclusions that could be drawn.
Were lipase antibody complexes to form on-column, during drug purification, the F(ab’)2 domains would be the most solvent-accessible region for lipase binding. Protein A binding of antibodies is known to occur in the Fc portion of the antibody, between the CH2 and CH3 domains.Citation45 The importance of antibody orientation on the beads in a chromatography column is supported in a study examining the impact of antibody load on protein A column, where it was shown that PLBL2 elution increased at a disproportionately greater rate to antibody load.Citation46 The authors proposed that an increasing number of interaction sites on a column could be responsible, and the work reported here specifically suggests that the F(ab’)2 domain orientation could be a critical parameter. Interestingly, the CH1 region highlighted in this study neighbors a region implicated in PLBL2 binding to mAbs, as determined by SPR, and reported in a 2018 patent,Citation47 but this region did not appear as a common site across the mAbs that were tested in this study. Possible differences include buffer composition used in each study or structural differences in the expressed lipases. While our data suggest that there is a common lipase/esterase binding site on the CH1 domain of IgGs, a thorough phylogenetic assessment of lipases/hydrolases is essential to make such a generic claim. Such an analysis is out of scope for this study but could be an interesting exercise for the future.
Interaction sites were also identified across the antibody Fc region, although this region was not targeted for mutagenesis. The role of the Fc region in lipoprotein binding was first demonstrated for the glycoprotein clusterin.Citation42,Citation48 In that work, papain-generated Fc and Fabs (derived from an IgG1 and IgG3 mixture) were shown to bind with similar affinity to IgG2 and IgM isotypes, respectively, using an ELISA assay that showed the strongest binding to intact IgG1. Since then, the Fc has been implicated in PLBL2Citation47,Citation49,Citation50 and LPLCitation51 binding to antibodies.
hile lipase expression during mAb production helps host cells survive, the results presented here indicate there is a possible opportunity to produce cell lines with partially deglycosylated lipases through asparagine-mutagenesis. Alternatively, feed-conditionsCitation52,Citation53 could be used to shift the production of glycans toward higher-molecular-weight glycans. Glycosylation-engineered lipases could minimize the formation of non-covalent mAb-lipase complexes and ultimately reduce the propensity for these types of enzymes to persist in formulation buffers, leading to visible particulates. Postproduction, lectins could also be used to purify out all mannose-containing glycans. Purification strategies, such as specific washes to disrupt electrostatic or hydrophobic interactions, would be the easiest to implement in practice, but electrostatic and hydrophobic surface analysis of the lipase interacting regions do not provide any clues to the nature of this interaction (Figure S10). Alternatively, mutagenesis of the antibody CH1 domain could limit co-purifying lipases. While not expected to change, antigen binding and physicochemical stability of the CH1 mutant antibodies should be confirmed. Both strategies delineated here represent new opportunities for controlling HCP expression and purification in manufacturing, and remains an important avenue for further testing and exploration.
Materials and methods
Materials
The therapeutic mAbs used in this study were produced in‐house at Genentech, Inc. Ammonium acetate (AMAC), formic acid (FA), dithiothreitol (DTT), guanidine HCl, methanol (MeOH), and tris HCl were purchased from Sigma‐Aldrich (St Louis, MO). Acetonitrile (ACN), trifluoroacetic acid (TFA) and water were purchased from Fisher Scientific (Hampton, NH). All solvents were HPLC grade or >99.9% purity.
Protein and antibody expression
Plasmids were made by Genewiz Inc. (South Plainfield, NJ) through gene synthesis and subcloning. All esterases, mAbs and alanine mutants were expressed in CHO cells. The esterases were purified by affinity chromatography using a Ni NTA column (Cytiva, Marlborough, MA) followed by gel filtration chromatography. mAbs were purified using a protein A column (Cytiva, Marlborough, MA) followed by gel filtration chromatography. Proteins were characterized using SDS-PAGE and analytical SEC. Enzyme activity was confirmed post-production using a previously published fluorescence-based assay.Citation54
Surface plasmon resonance analysis
Lipases of interest were immobilized onto CM5 chip via amine coupling. Experiments were carried out on a Biacore T200 Instrument (Uppsala, Sweden) using phosphate-buffered saline as the running buffer and 10 mM Glycine pH 2.0 as the regeneration buffer. At least eight different concentrations of the mAb were injected onto the chip immobilized with the lipase and the binding curves were globally fit to the 1:1 Langmuir binding model.
Microscale thermophoresis
In order to measure binding using MST, the lipase was labeled using the Red-tris-NTA dye (NanoTemper Technologies Inc., South San Francisco, CA) that binds to the his-tag on the lipase. In brief, excess dye was incubated with the lipase and the labeled lipase was purified using a Zeba Spin desalting column with a 7k molecular weight cutoff (Thermo Fisher Scientific, Waltham, MA). 1–5 nM of the labeled lipase was incubated with various concentrations of the mAb and subjected to thermophoresis on the Monolith N.T. Automated instrument (NanoTemper Technologies Inc., South San Francisco, CA). Data were analyzed using the MO.Screening Analysis Software (NanoTemper Technologies Inc., South San Francisco, CA).
Fast photochemical oxidation of proteins
Antibody:lipase solutions were prepared at a 1:10 or a 10:1 ratio. An arginine radical scavenger was added to the solutions before asymmetrically mixing with hydrogen peroxide as described previously.Citation55 Samples were flowed through a 150 µm capillary and exposed to a 248 nm KrF excimer laser (GAM Laser Inc. Orlando, FL) pulsed at 30 mJ/pulse. The samples were collected in 10 µL of 50 nM catalase and 200 mM methionine to scavenge residual peroxide. Proteins were cleaned up using a molecular weight cutoff filter, reduced, alkylated, and tryptically digested. Peptides were loaded onto an Agilent 1200 HPLC with a Waters BEH300 C18 (1.7 µm 2.1 × 150 mm) column. A flow rate of 0.3 mL/min was used, with solvent B (ACN, 0.8% TFA) increased to 55% at 45 min. Peptides were detected on a Orbitrap™ Elite (Thermo Fisher, Bremen, Germany) in full scan positive-ion mode at 60,000 resolving power in data-dependent acquisition mode. Peak identification and quantitation of percent oxidation for each peptide were performed using Byos® Software Suite (Protein Metric Inc., Cupertino, CA). Spectra were searched against peptides that were identified using Mascot with a custom database (including a decoy database) using the antibodies or lipases of interest. All oxidation-based modifications were enabled as variable modifications, and the mass tolerance was set at 10 ppm. The modification intensities were taken from the extracted ion chromatogram of the peptides at the MS1 level. Error bars represent the statistical analysis performed using a single sample t-test with a 95% confidence interval. Non-overlapping error bars are considered practically significant, but only changes ≥5% were further evaluated. The peptide numbering reported for lipases is aligned with their Protein Data Bank crystal structures.
Desalting and preparation of protein samples for MS and IM
Protein or antibody samples were buffer exchanged into 50 mM ammonium acetate (pH 7) and exchanged according to the manufacturer protocol on a Micro Bio-SpinTM 6 column (Bio-Rad, Hercules, CA). Samples were used within 3 d of desalting and stored at 4°C deg. Desalted samples were then split for native MS and IM analyses. Complex was prepared for MS analysis at a 10:1 lipase:antibody (2.7:0.27 μM) molar ratio, respectively, and for IM at a 2:1 molar ratio (400:200 nM), respectively, just prior to analysis, at a 50 mM and 25 mM final ammonium acetate concentration, respectively.
Treatment of lipases with glycosidases
For desialylation, lipases were incubated with α2-3,6,8 neuraminidase (New England Biolabs, Ipswich, MA) at 100 units/40 µg lipase for 3 h at 37°C for 3 h. For native deglycosylation, samples were incubated with glycerol-free PNGaseF at 1 unit/5 µg lipase overnight at 37°C.
Native mass spectrometry analysis
Borosilicate glass (1.2 mm OD, 0.69 mm ID) was pulled on a P-1000 puller (Sutter Instruments, Novato, CA) using methods previously described.Citation56 Tips were sputter coated to 6 nm with 80:20 Au/Pd using an Ace600 high vacuum sputter coater (Leica Microsystems Inc. Buffalo Grove, IL). Between 2 and 5 μL of sample was loaded into each tip, inserted into a Nanospray Flex source, and interfaced to a Q ExactiveTM UHMR (Thermo Fisher Scientific, Bremen, DE). The capillary voltage was set between 1.2 and 1.3 kV to maintain stable spray and the inlet temperature was set to 200°C. MS transmission and detection conditions were optimized using approaches previously described.Citation57 The final conditions for the control samples (free lipase, free antibody) and for low- and high-resolution complex spectra are reported in the supplementary Table 4. All spectra were deconvolved for analysis using UniDec 3.1.Citation58
For MS binding energy dissociation experiments, each +29-protein complex was isolated using the centroided peak m/z and a 20 m/z isolation window. The HCD collision energy voltage was swept from 3 to 300 V using a fixed injection time. An in-house python program was used to auto-extract the base peak intensity of peaks inside the isolation window and the associated HCD energies. These values were subsequently imported into R Studio v1.3 and fit with the dr4pl package.Citation59 The data were normalized, cleaned for outliers based on the Tukey method, and fit with a four-parameter logistic growth function using the Mead method for initial parameter selection, Broyden–Fletcher–Goldfarb–Shanno method for parameter optimization and eigenvalue selection through the computation Hessian method. VC50 values, taken as the voltage to reduce the complex to 50% of its initial intensity, were extracted and the areas under each curve were integrated.
Atmospheric ion mobility analysis
A non-MS, stand-alone atmospheric IM device, the IMgenius™ (IonDX, Inc.) was used to compare the formation complex between different antibodies and antibody mutants. The IMgenius (), which has yet to be described in the literature and is based on work to measure the particle sizes of lipoproteins,Citation27 separates singly charged, electrosprayed ions in an electric field according to their collisional cross-sectional area. Samples were infused at 300 nL/min using a nanoLC system adapted for flow injection and equipped with pacified fused silica capillary (220 μm OD, 50 μm ID). Electrospray onset was at 2.7–3 kV in a chamber with 1.9 SLM air and 0.1 SLM CO2. The central rod voltage was swept from 0 to 4 kV and the current detected on a 3-mm-wide ring digitized with a 4-channel 12-bit Pico-Scope (Model 4424, Pico Technologies, UK). Fluid dynamic models of the trajectory of singly charged ions, generated in SIMION (Scientific Instrument Services, Inc., Ringoes, NJ), were used to construct a voltage versus mobility lookup table.
Spectra acquired were the average of five scans, background subtracted, and smoothed with a three-point moving average. For control data sets, data were normalized and imported Magicplot Pro 2.9.3 (Sydney, AU).Citation60 For complex protein data sets, the normalized antibody control IM spectra were subtracted from the normalized complex protein spectra. Control spectra were fit using an automated fit-sum approach of two or four Gaussian-A curves (y(x) = a * exp(-ln(2) * (x–x0)2/dx2)) for control or complex datasets, respectively, from which the mean inverse mobility and curve area were exported.
Global N-linked glycan composition analysis by LC-MS analysis
Ten μg of protein was denatured with 8 M guanidine HCl at a 1:1 volume ratio and reduced with 100 mM DTT for 10 min at 95°C. Samples were diluted with 100 mM Tris HCl, pH 7.5 to a final concentration of 2 M guanidine HCl, followed by an 18-hour digestion at 37°C with 2 μl of glycerol-free PNGase F (New England BioLabs, Ipswich, MA). Deglycosylated sample (150 ng) was injected onto a 1260 Infinity HPLC-Chip Cube, equipped with a 43 mm PGC-Chip II column (Agilent Technologies, Santa Clara, CA). A binary pump was used to deliver 500 nL/min solvent A (99.88% water, 0.1% FA and 0.02% TFA) and solvent B (90% ACN, 9.88% water, 0.1% FA and 0.02% TFA) as a gradient of 2–32% B over 6 min, 32% B for 1.5 min, 32–85% over 0.5 min, and 85% B for 1 min. The column was re-equilibrated at 2% B for 3 min.
Glycans were electrosprayed into an Agilent 6520 Q-TOF mass spectrometer using the following parameters: 1.9 kV spray voltage; 325°C gas temperature; 5 l/min drying gas flow; 160 V fragmentor voltage; 65 V skimmer voltage; 750 V oct 1 RF Vpp voltage; 400–3,000 m/z scan range; positive polarity; MS1 centroid data acquisition using extended dynamic range (2 GHz) instrument mode; 3 spectra/s; 333.3 ms/spectrum; 3243 transients/spectrum; and a CE setting of 0.
Acquired data were searched against a glycan library in the Agilent MassHunter Qualitative Analysis software. The software algorithm utilized a combination of accurate mass with a mass tolerance of 10 ppm and expected retention time for glycan identification. The AUC of extracted N-glycans was calculated, and the relative percentages, compared to the total glycan area per run, was determined.
Data Sharing Statement
All data, including raw data for the FPOP-MS protein analysis, static spray native MS spectra, IM traces, SPR analysis, and MST analysis are available on request. Where possible, the raw data are directly shown in the supplementary information.
Supplemental Material
Download MS Word (8.5 MB)Disclosure Statement
ESH, SH, ATW, NS, WP, DT, RFK, WS, SA are employees of Genentech, Inc., which develops and markets drugs for profit. BA, ADB, and WHB are employees of IonDX, Inc, which develops ion mobility spectrometers. A component of this work has been filed as a provisional patent that has been filed with the USPTO.
Supplementary material
Supplemental data for this article can be accessed online at https://doi.org/10.1080/19420862.2022.2135183
Additional information
Funding
References
- Vanderlaan M, Zhu-Shimoni J, Lin S, Gunawan F, Waerner T, Van Cott KE. Experience with host cell protein impurities in biopharmaceuticals. Biotechnol Prog. 2018;34:828–14. doi:10.1002/btpr.2640.
- Jones M, Palackal N, Wang F, Gaza-Bulseco G, Hurkmans K, Zhao Y, Chitikila C, Clavier S, Liu S, Menesale E, et al. “High-risk” host cell proteins (HCPs): a multi-company collaborative view. Biotechnol Bioeng. 2021;118:2870–85. doi:10.1002/bit.27808.
- Fischer SK, Cheu M, Peng K, Lowe J, Araujo J, Murray E, McClintock D, Matthews J, Siguenza P, Song A, et al. Specific immune response to phospholipase B-like 2 protein, a host cell impurity in lebrikizumab clinical material. AAPS J. 2017;19:254–63. doi:10.1208/s12248-016-9998-7.
- Graf T, Tomlinson A, Yuk IH, Kufer R, Spensberger B, Falkenstein R, Shen A, Li H, Duan D, Liu W, et al. Identification and characterization of polysorbate-degrading enzymes in a monoclonal antibody formulation. J Pharm Sci. 2021;110:3558–67. doi:10.1016/j.xphs.2021.06.033.
- Hanania NA, Noonan M, Corren J, Korenblat P, Zheng Y, Fischer SK, Cheu M, Putnam WS, Murray E, Scheerens H, et al. Lebrikizumab in moderate-to-severe asthma: pooled data from two randomised placebo-controlled studies. Thorax. 2015;70:748–56. doi:10.1136/thoraxjnl-2014-206719.
- Gao SX, Zhang Y, Stansberry-Perkins K, Buko A, Bai S, Nguyen V, Brader ML. Fragmentation of a highly purified monoclonal antibody attributed to residual CHO cell protease activity. Biotechnol Bioeng. 2011;108:977–82. doi:10.1002/bit.22982.
- Dixit N, Salamat-Miller N, Salinas PA, Taylor KD, Basu SK. Residual host cell protein promotes polysorbate 20 degradation in a sulfatase drug product leading to free fatty acid particles. J Pharm Sci. 2016;105:1657–66. doi:10.1016/j.xphs.2016.02.029.
- Robert F, Bierau H, Rossi M, Agugiaro D, Soranzo T, Broly H, Mitchell-Logean C. Degradation of an Fc-fusion recombinant protein by host cell proteases: identification of a CHO cathepsin D protease. Biotechnol Bioeng. 2009;104:1132–41. doi:10.1002/bit.22494.
- Food and Drug Administration, US Department of Health and Human Services. Test procedures and acceptance criteria for biotechnological/biological products. Rockville (MD): Food and Drug Administration, US Department of Health and Human Services; 1999.
- Vanderlaan M, Sandoval W, Liu P. Hamster phospholipase B-like 2 (PLBL2), a host cell protein impurity in CHO-derived therapeutic monoclonal antibodies. BioProcess Int. 2015;13:18–29.
- Chiu J, Valente KN, Levy NE, Min L, Lenhoff AM, Lee KH. Knockout of a difficult-to-remove CHO host cell protein, lipoprotein lipase, for improved polysorbate stability in monoclonal antibody formulations. Biotechnol Bioeng. 2017;114:1006–15. doi:10.1002/bit.26237.
- Hall T, Sandefur SL, Frye CC, Tuley TL, Huang L. Polysorbates 20 and 80 degradation by group XV lysosomal phospholipase A2 isomer X1 in monoclonal antibody formulations. J Pharm Sci. 2016;105:1633–42. doi:10.1016/j.xphs.2016.02.022.
- Dwivedi M, Blech M, Presser I, Garidel P. Polysorbate degradation in biotherapeutic formulations: identification and discussion of current root causes. Int J Pharm. 2018;552:422–36. doi:10.1016/j.ijpharm.2018.10.008.
- Zhu-Shimoni J, Yu C, Nishihara J, Wong RM, Gunawan F, Lin M, Krawitz D, Liu P, Sandoval W, Vanderlaan M, et al. Host cell protein testing by ELISAs and the use of orthogonal methods. Biotechnol Bioeng. 2014;111:2367–79. doi:10.1002/bit.25327.
- Zhang S, Xiao H, Goren M, Burakov D, Chen G, Li N, Tustian A, Adams B, Mattila J, Bak H, et al. Putative phospholipase B-like 2 is not responsible for polysorbate degradation in monoclonal antibody drug products. J Pharm Sci. 2020;109:2710–18. doi:10.1016/j.xphs.2020.05.028.
- Cao S, Martinez-Martin N. Unbiased identification of extracellular protein–protein interactions for drug target and biologic drug discovery. IntechOpen; 2021.
- Zhang S, Xiao H, Molden R, Qiu H, Li N. Rapid polysorbate 80 degradation by liver carboxylesterase in a monoclonal antibody formulated drug substance at early stage development. J Pharm Sci. 2020;109:3300–07. doi:10.1016/j.xphs.2020.07.018.
- Zhou M, Li Q, Wang R. Current experimental methods for characterizing protein-protein interactions. Chem Med Chem. 2016;11:738–56. doi:10.1002/cmdc.201500495.
- Nivedha S, Babu PR, Senthilnathan K. Surface plasmon resonance physics and technology. Curr Sci. 2018;115:56–63. doi:10.18520/cs/v115/i1/56-63.
- Jerabek-Willemsen M, André T, Wanner R, Roth HM, Duhr S, Baaske P, Breitsprecher D. MicroScale thermophoresis: interaction analysis and beyond. J Mol Struct. 2014;1077:101–13. doi:10.1016/j.molstruc.2014.03.009.
- Kairys V, Baranauskiene L, Kazlauskiene M, Matulis D, Kazlauskas E. Binding affinity in drug design: experimental and computational techniques. Expert Opin Drug Discov. 2019;14:755–68. doi:10.1080/17460441.2019.1623202.
- Khodabandehloo A, Chen DDY. Particle sizing methods for the detection of protein aggregates in biopharmaceuticals. Bioanalysis. 2017;9:313–26. doi:10.4155/bio-2016-0269.
- Wang W, Roberts CJ. Protein aggregation – mechanisms, detection, and control. Int J Pharm. 2018;550:251–68. doi:10.1016/j.ijpharm.2018.08.043.
- Hambly D, Gross M. Laser flash photochemical oxidation to locate heme binding and conformational changes in myroglobin. Int J Mass spectrom. 2007;259:124–29. doi:10.1016/j.ijms.2006.08.018.
- Li X, Wang F, Li H, Richardson DD, Roush DJ. The measurement and control of high-risk host cell proteins for polysorbate degradation in biologics formulation. Antibody Therap. 2022;5:42–54. doi:10.1093/abt/tbac002.
- Chen I-H, Xiao H, Li N. Methods for characterizing low-abundance host cell proteins. USPTO US20210302433A1. 2021.
- Caulfield MP, Li S, Lee G, Blanche PJ, Salameh WA, Benner WH, Reitz RE, Krauss RM. Direct determination of lipoprotein particle sizes and concentrations by ion mobility analysis. Clin Chem. 2008;54:1307–16. doi:10.1373/clinchem.2007.100586.
- Costa AR, Rodrigues ME, Henriques M, Oliveira R, Azeredo J. Glycosylation: impact, control and improvement during therapeutic protein production. Crit Rev Biotechnol. 2014;34:281–99. doi:10.3109/07388551.2013.793649.
- Leney AC, Heck AJR. Native mass spectrometry: what is in the name? J Am Soc Mass Spectrom. 2017;28:5–13. doi:10.1007/s13361-016-1545-3.
- Bunc M, Hadži S, Graf C, Bončina M, Lah J. Aggregation time machine: a platform for the prediction and optimization of long-term antibody stability using short-term kinetic analysis. J Med Chem. 2022;65:2623–32. doi:10.1021/acs.jmedchem.1c02010.
- Jones LM, Sperry JB, Carroll JA, Gross ML. Fast photochemical oxidation of proteins for epitope mapping. Anal Chem. 2011;83:7657–61. doi:10.1021/ac2007366.
- Sun Y, Izadi S, Callahan M, Deperalta G, Wecksler AT. Antibody-receptor interactions mediate antibody-dependent cellular cytotoxicity. J Biol Chem. 2021;297:100826. doi:10.1016/j.jbc.2021.100826.
- Schick AJ, Lundin V, Low J, Peng K, Vandlen R, Wecksler AT. Epitope mapping of anti-drug antibodies to a clinical candidate bispecific antibody. mAbs. 2022;14:2028337. doi:10.1080/19420862.2022.2028337.
- Li KS, Shi LQ, Gross ML. Mass spectrometry-based Fast Photochemical Oxidation of Proteins (FPOP) for higher order structure characterization. Acc Chem Res. 2018;51:736–44. doi:10.1021/acs.accounts.7b00593.
- Rogniaux H, Van Dorsselaer A, Barth P, Biellmann JF, Barbanton J, van Zandt M, Chevrier B, Howard E, Mitschler A, Potier N, et al. Binding of aldose reductase inhibitors: correlation of crystallographic and mass spectrometric studies. J Am Soc Mass Spectrom. 1999;10:635–47. doi:10.1016/S1044-0305(99)00030-6.
- Ren C, Bailey AO, VanderPorten E, Oh A, Phung W, Mulvihill MM, Harris SF, Liu Y, Han G, Sandoval W, et al. Quantitative determination of protein–ligand affinity by size exclusion chromatography directly coupled to high-resolution native mass spectrometry. Anal Chem. 2019;91:903–11. doi:10.1021/acs.analchem.8b03829.
- Hunter AK, Wang X, Suda EJ, Herberg JT, Shell RE, Thomas KE, Dufield RL, Gustafson ME, Mozier NM, Ho SV, et al. Separation of product associating E. coli host cell proteins OppA and DppA from recombinant apolipoprotein A-I Milano in an industrial HIC unit operation. Biotechnol Prog. 2009;25:446–53. doi:10.1002/btpr.106.
- Doneanu CE, Xenopoulos A, Fadgen K, Murphy J, Skilton SJ, Prentice H, Stapels M, Chen W. Analysis of host-cell proteins in biotherapeutic proteins by comprehensive online two-dimensional liquid chromatography/mass spectrometry. mAbs. 2012;4:24–44. doi:10.4161/mabs.4.1.18748.
- Liu X, Chen Y, Zhao Y, Liu-Compton V, Chen W, Payne G, Lazar AC. Identification and characterization of co-purifying CHO host cell proteins in monoclonal antibody purification process. J Pharm Biomed Anal. 2019;174:500–08. doi:10.1016/j.jpba.2019.06.021.
- Valente KN, Lenhoff AM, Lee KH. Expression of difficult-to-remove host cell protein impurities during extended Chinese hamster ovary cell culture and their impact on continuous bioprocessing. Biotechnol Bioeng. 2015;112:1232–42. doi:10.1002/bit.25515.
- Baycin-Hizal D, Tabb DL, Chaerkady R, Chen L, Lewis NE, Nagarajan H, Sarkaria V, Kumar A, Wolozny D, Colao J, et al. Proteomic analysis of Chinese hamster ovary cells. J Proteome Res. 2012;11:5265–76. doi:10.1021/pr300476w.
- Wilson MR, Easterbrook-Smith SB. Clusterin binds by a multivalent mechanism to the Fc and Fab regions of IgG. Biochim Biophys Acta. 1992;1159:319–26. doi:10.1016/0167-4838(92)90062-I.
- Lakomek K, Dickmanns A, Kettwig M, Urlaub H, Ficner R, Lübke T. Initial insight into the function of the lysosomal 66.3 kDa protein from mouse by means of X-ray crystallography. BMC Struct Biol. 2009;9:1–17. doi:10.1186/1472-6807-9-56.
- Glukhova A, Hinkovska-Galcheva V, Kelly R, Abe A, Shayman J, Tesmer J. Structure and function of lysosomal phospholipase A2 and lecithin:cholesterol acyltransferase. Nat Commun. 2014;6:1–12.
- Deisenhofer J. Crystallographic refinement and atomic models of a human Fc fragment and its complex with fragment B of protein A from Staphylococcus aureus at 2.9- and 2.8-.ANG. resolution. Biochemistry. 1981;20:2361–70. doi:10.1021/bi00512a001.
- Tran B, Grosskopf V, Wang X, Yang J, Walker D, Yu C, McDonald P. Investigating interactions between phospholipase B-Like 2 and antibodies during Protein A chromatography. J Chrom A. 2016;1438:31–38. doi:10.1016/j.chroma.2016.01.047.
- Bosteels H, Chen S, Farrow K, Kucia-Tran R, Lewis WJK, Thomson AS. Antibodies with reduced binding to process impurities. USPTO WO2018065389. 2017.
- Wilson MR, Roeth PJ, Easterbrook-Smith SB. Clusterin enhances the formation of insoluble immune complexes. Biochem Biophys Res Commun. 1991;177:985–90. doi:10.1016/0006-291X(91)90635-K.
- Dumet C, Pottier J, Gouilleux-Gruart V, Watier H. Insights into the IgG heavy chain engineering patent landscape as applied to IgG4 antibody development. mAbs. 2019;11:1341–50. doi:10.1080/19420862.2019.1664365.
- Gunawan F, Hsiao Y-C, Krawitz DC, Lin MS, Vanderlaan M, Yuk RVH. Compositions and methods for detecting and quantifying host cell protein in cell lines and recombinant polypeptide products. USPTO WO2015038884A2. 2016.
- Singh SK, Mishra A, Yadav D, Budholiya N, Rathore AS. Understanding the mechanism of copurification of “difficult to remove” host cell proteins in rituximab biosimilar products. Biotechnol Prog. 2020;36:e2936.
- Pacis E, Yu M, Autsen J, Bayer R, Li F. Effects of cell culture conditions on antibody N-linked glycosylation—what affects high mannose 5 glycoform. Biotechnol Bioeng. 2011;108:2348–58. doi:10.1002/bit.23200.
- Rameez S, Gowtham YK, Nayar G, Mostafa SS. Modulation of high mannose levels in N-linked glycosylation through cell culture process conditions to increase antibody-dependent cell-mediated cytotoxicity activity for an antibody biosimilar. Biotechnol Prog. 2021;37:e3176. doi:10.1002/btpr.3176.
- Bhargava AC, Mains K, Siu A, Gu J, Zarzar J, Yi L, Yuk IH. High-throughput, fluorescence-based esterase activity assay for assessing polysorbate degradation risk during biopharmaceutical development. Pharm Res. 2021;38:397–413. doi:10.1007/s11095-021-03011-1.
- Garcia NK, Sreedhara A, Deperalta G, Wecksler AT. Optimizing hydroxyl radical footprinting analysis of biotherapeutics using internal standard dosimetry. J Am Soc Mass Spectrom. 2020;31:1563–71. doi:10.1021/jasms.0c00146.
- Kirshenbaum N, Michaelevski I, Sharon M. Analyzing large protein complexes by structural mass spectrometry. J Vis Exp. 2010;1954:e1954.
- van de Waterbeemd M, Fort KL, Boll D, Reinhardt-Szyba M, Routh A, Makarov A, Heck AJR. High-fidelity mass analysis unveils heterogeneity in intact ribosomal particles. Nat Methods. 2017;14:283–86. doi:10.1038/nmeth.4147.
- Marty MT, Baldwin AJ, Marklund EG, Hochberg GKA, Benesch JLP, Robinson CV. Bayesian deconvolution of mass and ion mobility spectra: from binary interactions to polydisperse ensembles. Anal Chem. 2015;87:4370–76. doi:10.1021/acs.analchem.5b00140.
- An H, Landis JT, Bailey AG, Marron JS, Dittmer DP. dr4pl: a stable convergence algorithm for the 4 parameter logistic model. R Journal. 2019;11:171. doi:10.32614/RJ-2019-003.
- Ooi J, Traini D, Young PM. Graphing software for medical writers. Medical Writing. 2014;23:41–44. doi:10.1179/2047480613Z.000000000185.