
ABSTRACT
The propensity for some monoclonal antibodies (mAbs) to aggregate at physiological and manufacturing pH values can prevent their use as therapeutic molecules or delay time to market. Consequently, developability assessments are essential to select optimum candidates, or inform on mitigation strategies to avoid potential late-stage failures. These studies are typically performed in a range of buffer solutions because factors such as pH can dramatically alter the aggregation propensity of the test mAbs (up to 100-fold in extreme cases). A computational method capable of robustly predicting the aggregation propensity at the pH values of common storage buffers would have substantial value. Here, we describe a mAb aggregation prediction tool (MAPT) that builds on our previously published isotype-dependent, charge-based model of aggregation. We show that the addition of a homology model-derived hydrophobicity descriptor to our electrostatic aggregation model enabled the generation of a robust mAb developability indicator. To contextualize our aggregation scoring system, we analyzed 97 clinical-stage therapeutic mAbs. To further validate our approach, we focused on six mAbs (infliximab, tocilizumab, rituximab, CNTO607, MEDI1912 and MEDI1912_STT) which have been reported to cover a large range of aggregation propensities. The different aggregation propensities of the case study molecules at neutral and slightly acidic pH were correctly predicted, verifying the utility of our computational method.
Introduction
The number of therapeutic antibodies in development continues to grow at a remarkable rate.Citation1 Increasing competition for a limited number of targets has put greater emphasis on speed to market, decreased production costs and reduced failure rates.Citation2 In addition, industry assurances for improving patient satisfaction have focused attention on selecting drugs that elicit fewer adverse events and allow greater quality of life. Accordingly, these factors drive the selection of drugs with lower aggregation propensity.Citation3
Antibody aggregation mechanisms are governed by a combination of sequence characteristics and environmental factors which can be categorized by native and non-native state protein–protein interactions. Non-native state aggregation is induced by physical stresses such as extreme pH, temperature and mechanical agitation that affect the conformational stability of the protein. For example, the purification of antibodies typically requires exposure to low pH (3.4–3.6) to elute the antibody molecules bound to an affinity chromatography column. The low pH disrupts the native conformation, partially exposing the hydrophobic core, a subsequent pH adjustment step yields refolded antibody molecules but is associated with varying amounts of aggregation-prone misfolded molecules. Additional purification steps remove these products.Citation4,Citation5 In this work, we focus on native state protein–protein interactions that affect aggregation propensity at physiological pH values, while appreciating that stress-induced, non-native state interactions can also affect overall developability of an antibody.
Antibody therapeutics are often required to be stable at high concentrations (typically greater than >100 mg/mL) to enable subcutaneous administration. This route of administration is advantageous due to lower cost and patient preference. However, risk of aggregate formation is greatly increased at these high protein concentrations.Citation6 The FDA guidelines state that aggregate formation should be avoided, due to their potential to elicit immune responses, which can lead to adverse events, and impaired pharmacokinetics.Citation7 As it is therefore important to minimize aggregation, substantial effort has been put into developing assays that measure aggregation propensity, a key determinant of developability.Citation8
To establish the native state aggregation propensity of a mAb, the preferred approach is to concentrate the sample, then apply various analytical techniques to detect the formation of aggregates. This methodology requires large amounts of purified sample (up to 200 mg), which precludes its use early in the antibody drug discovery phase where sample availability is limited. Other methods to determine aggregation propensity that require smaller quantities of sample (<0.5 mg) include ammonium sulfate-induced precipitation,Citation9 affinity-capture self-interaction nanoparticle spectroscopy (AC-SINS)Citation10,Citation11 and the polyethylene glycol (PEG)-induced protein precipitation assay.Citation12–15 We selected PEG precipitation to study native state aggregation because ammonium sulfate precipitation requires the addition of high salt concentrations, which can perturb native electrostatic interactions between protein molecules. Suppression of electrostatic interactions could bias results toward a hydrophobicity-driven predictive model. AC-SINS is reported to be an effective measure of protein–protein interactions and is compatible with very dilute solutions (1–100 µg/mL). However, the assay requires the test mAb to be immobilized, therefore a substantial portion of the molecule is obscured limiting interactions that would otherwise occur in solution. A study examining the developability of 137 clinical stage mAbs suggested that this assay was likely to be a measure of self-interaction and varying levels of cross interactions with the nanoparticle complexes.Citation16 This observation could explain why samples sharing similar AC-SINS scores were shown to have remarkably different solubility values.Citation17,Citation18 These reports suggested that the AC-SINS assay was not a suitable method for detailed analysis of aggregation propensity.
There are numerous computational tools that predict aggregation of proteins, most are based on amyloid formation and therefore focus on an aggregation mechanism driven by hydrophobicity.Citation19 Few tools have been developed that predict native state antibody aggregation, those that have also tend to focus on hydrophobic interactions, disregard differences between isotype constant domains and simplify electrostatic effects, furthermore the effect of buffer pH is largely overlooked.Citation20–22 A mAb that has a low aggregation propensity at neutral pH could have a remarkably high aggregation propensity at slightly acidic pH, and vice versa. Therefore, aggregation studies should be performed at more than one pH to better reflect developability challenges.Citation23 Thus, an in-silico screening approach that robustly predicts aggregation propensity at different pH values would have improved utility.
We have previously demonstrated that the different aggregation propensities of human IgG1 and IgG4(P) mAbs (sharing the same Fv domain) at slightly acidic and neutral pH could be predicted based on the net charge sign of the Fv domain relative the electrostatic properties of the Fc domain.Citation24 In this work we add a hydrophobic descriptor to our isotype dependent charge-based relative aggregation model to generate a mAb aggregation prediction tool (MAPT). We hypothesized that an attractive intermolecular electrostatic force in combination with high hydrophobicity would result in greater native state aggregation propensity, reducing developability. Absence of substantial intermolecular attractive electrostatic forces or presence of strong intermolecular electrostatic repulsive forces would mitigate the short-range hydrophobic force contributions reducing native state mAb aggregation propensity.
A common approach in scoring hydrophobicity is assignment of hydrophobic patches. Several groups have used patch definitions as a metric to predict aggregation propensity,Citation25–27 but there does not appear to be strong data to suggest that a patch score would be superior to an overall surface hydrophobicity score. Furthermore, defining a hydrophobic patch is not trivial and is complicated by the dynamic nature of the complementarity-determining region (CDR). We elected not to define hydrophobic patches due to the high possibility of error. Instead, we decided to use a simpler measure summarizing the homology model-derived surface hydrophobicity of the entire variable region. This offers the advantage of requiring very little optimization and being intuitive and easily interpretable. Despite not directly defining a hydrophobic patch, it would be expected that an Fv domain with a large hydrophobicity score would have hydrophobic residues in close proximity. A visual inspection of the homology model would permit informed selection of amino acid residues within a hydrophobic cluster for targeted mutation if required. We note that there is disagreement in the literature as to the classification of hydrophobic residues.Citation28–31 Therefore, we defined a hydrophobic residue as being one of the eight most hydrophobic residues according to the normalized hydrophobicity consensus scale published by Eisenberg et al.Citation32 Every hydrophobic amino acid’s side chain ABSASA was calculated and these numbers were summed over the entire Fv region to yield a single overall score. This score was therefore weighted by the size of each hydrophobic amino acid sidechain, as well as its surface exposure within the local environment. We show that this relatively simple measure is sufficient to predict antibody aggregation behavior as part of our MAPT methodology.
To determine a hydrophobic score that would reflect a molecule with poor developability, we examined the surface hydrophobicity of 97 clinical stage therapeutic mAbs. To validate our method, we tested three approved therapeutic mAbs (infliximab, tocilizumab and rituximab), that were reported to show high and low aggregation propensity.Citation16 In addition, we generated two IgG4P mAbs that were reported to exhibit unusually high aggregation propensities as the IgG1 isotype (CNTO607 and MEDI1912). We also produced MEDI1912_STT as an IgG4P mAb; this mutated form of MEDI1912 was reported to show lower aggregation propensity compared to the parental molecule.Citation33,Citation34
This work demonstrates that the intermolecular electrostatic interactions between Fv domains and constant domains govern native state aggregation by modulating the hydrophobic contribution. Importantly, the predictive power of MAPT is maintained at slightly acidic and neutral pH for Fv domains formatted as either the IgG1 or IgG4(P) isotypes.
Results
Fv domain hydrophobicity analysis
A high surface hydrophobicity is an undesirable characteristic and is often cited as a principal component of aggregation. To determine hydrophobicity values that might impede the development of therapeutic mAbs due to increased aggregation propensity, we analyzed 97 clinical stage Fv domain sequences (76 IgG1 mAbs and 21 IgG4(P) mAbs SI ). The therapeutic Fv domains exhibited a wide range of hydrophobicity scores, with a mean absolute solvent-accessible surface areas (ABSASA) hydrophobicity score of 545.6 ÅCitation2 (). We elected to use the 90th percentile as a reasonable cutoff point for molecules displaying a favorable surface hydrophobicity score. Therefore, based on this sample set, Fv domains with ABSASA hydrophobicity scores > 638.5 ÅCitation2 would be expected to show a high probability of poor developability due to high aggregation propensity (depending on charge characteristics and environmental conditions such as buffer pH).
Table 1. Clinical stage antibody therapeutic Fv domains with extremes of charge.
Figure 1. A) Boxplot (demonstrating minimum, maximum, quartiles and median values) of absolute solvent accessible surface area (ABSASA) hydrophobicity scores for 97 clinical stage antibody therapeutics Fv domains. B) Descriptive statistics of plot.
Fv domain charge analysis
We have previously reported that IgG1 mAbs with positively charged Fv domains showed a decreased propensity for native state aggregation whereas IgG4(P) mAbs with positively charged Fv domains showed increased aggregation propensity at pH 7.4.Citation24 Analysis of the 97 clinical stage Fv domains () showed bias toward positive charge; the majority of these Fv domains were formatted as the IgG1 isotype. The overall number of acidic and basic residues varied substantially, ranging from 12 to 23 and 15 to 26, respectively. Analysis of surface hydrophobicity for the samples at the net charge extremes showed relatively low ABSASA hydrophobicity scores for the majority of the samples. Five samples had Fv domains with negative charge ≥ −3, two were of the IgG4(P) isotype, 12 samples had Fv domains with net charge greater than ≥ +6, all of which were of the IgG1 isotype (). Analysis of the nine Fv domains with high ABSASA hydrophobicity scores (>638.5 ÅCitation2) () showed a relatively small net charge range of −4 to +1 at pH 7.4 and −1 to +3 at pH 5.0. Five of these antibody candidates have been discontinued as of October 2022.Citation35,Citation36 This subset of samples with high surface hydrophobicity contained four mAbs that have been approved, belimumab, Tralokinumab, daratumumab and dupilumab,Citation36 each had a low or favorable net charge (isotype dependent) at pH 7.4.
Table 2. Net charge of Fv domains at pH 7.4 and pH 5.0 for IgG1 and IgG4(P) clinical stage antibody therapeutics with an Fv domain ABSASA hydrophobicity score greater than the 90th percentile cut off (>638.5 ÅCitation2).
Figure 2. A) Boxplot (demonstrating minimum, maximum, quartiles and median values) of net charge score for Fv domains of 97 clinical stage antibody therapeutics at pH 7.4 and pH 5.0. B) Descriptive statistics of plot data. C) Boxplot for number of acidic and basic residues. D) Descriptive statistics of acidic and basic plot.
MAPT methodology
MAPT is built on the hypothesis that the Fv domain hydrophobic contribution to aggregation propensity is modulated by the number of charged residues in the Fv domain relative to the number of charged residues in the constant domains. A greater number of charged residues increases the frequency of electrostatic interactions. The probability of unfavorable electrostatic interactions is determined by Fv domain net charge sign in relation to the antibody isotype. A greater Fv domain net charge results in substantially different aggregation propensities at pH 5.0 vs pH 7.4, the magnitude of the difference is dependent on the ABSASA hydrophobicity score.
MAPT Score = (H + H × N) × C
H = re-scaled ABSASA hydrophobicity score (ABSASA hydrophobicity – 300) ÷ 500
N is the weighted Fv domain net charge.
N = 5.00 + (-0.50 × Q5), if isotype = IgG1 and pH = 5.0
N = 6.00 + (-0.50 × Q7), if isotype = IgG1 and pH = 7.4
N = 5.75 + (-0.25 × Q5), if isotype = IgG4(P) and pH = 5.0
N = 5.25 + (0.50 × Q7), if isotype = IgG4(P) and pH = 7.4
(Q5 is the unweighted net charge at pH 5.0. Q7 is the unweighted net charge at pH 7.4).
C is the re-scaled number of amino acids with charged side chains, either acidic or basic depending on isotype and pH. Ccr is the number of charged residues (either acidic or basic residues depending on isotype and pH) within the variable region sequence.
C = 1 + (Ccr - 17.5) ÷ 20
Ccr = number of K or R in variable region, if isotype = IgG4(P) and pH = 7.4 otherwise
Ccr = number of D or E in variable region.
The relative Fv domain charge weightings (N) were based on our previous work describing a differential electrostatic aggregation model for hIgG1 and hIgG4P mAbs at pH 7.4 and pH 5.0.Citation24 The weighted Fv domain net charge justifications are detailed below:
The magnitude of the Fv domain net charge is proportional to differential aggregation propensity of the antibody formatted as either the IgG1 or IgG4(P) isotypes.
At pH 7.4 positively charged Fv domains showed lower aggregation propensity formatted as the hIgG1 isotype relative to the hIgG4(P) isotype. Conversely, negatively charged Fv domains showed lower aggregation propensity formatted as the hIgG4(P) isotype relative to the hIgG1 isotype.
At pH 5.0 hIgG1 mAbs showed lower aggregation propensity relative to the pH 7.4 result.
At pH 5.0 the hIgG4P mAb Fv domain charge sign preference for lower aggregation propensity was reversed.
The reduction in aggregation propensity at pH 5.0 for hIgG4(P) mAbs with positively charged Fv domains was not as large as that observed for the hIgG1 isotype.
Fv domain net charge sign gives the probability of an unfavorable electrostatic interaction. To reflect the frequency of unfavorable electrostatic interactions, we included a simple weighting function (C) that accounts for an unusually high or low number of unfavorably charged residues (isotype specific).
MAPT scores can be interpreted as a traffic light system, where low scores represent decreased native state aggregation risk (score < 4, green), high numbers indicate high native state aggregation risk (score > 5, red). The generation of the risk assignments were based on a proprietary data set (not shown) and supported by a statistical analysis of 97 clinical stage antibody therapeutics utilizing percentiles and standard deviations away from the mean to define relative MAPT score standings (described in the next section).
Aggregation propensity is affected by factors other than charge and hydrophobicity (for example, structural stability and post-translational modifications). Therefore, confidence in the predictions is greater for samples with MAPT scores of <3 or >6. In general, a direct comparison between the outputted MAPT score and stress-induced aggregation would be inappropriate. The MAPT algorithm metrics are derived from native-state structures and typical storage buffer pH values. The prediction of stress-induced aggregation propensity is beyond the scope of this work.
MAPT scores for 97 clinical stage antibody therapeutics
MAPT analysis of 97 therapeutic mAbs () revealed that the majority of samples that reach the clinical stage have low MAPT scores (<4). Only one mAb from the approved panel (infliximab) had a MAPT pH 7.4 score two standard deviations above the mean (≥6.1), indicating a high aggregation propensity for this sample. Four samples had MAPT pH 7.4 scores >6.1 in the discontinued panel (duligotuzumab, cixutumumab, sirukumab and drozitumab).
Figure 3. A) Boxplot (demonstrating minimum, maximum, quartiles and median values) for MAPT scores of 97 clinical stage antibody therapeutics (76 IgG1 and 21 IgG4(p)). B) Descriptive statistics of plot.
MAPT pH 5.0 scores were generally lower, with all the approved samples having MAPT scores <5.0, except dupilumab, which had a score of 5.1. The discontinued samples with high MAPT scores at pH 7.4 also had relatively high MAPT scores at pH 5.0. Duligotuzmab had the largest MAPT pH 5.0 score (6.3) and also had the largest MAPT pH 7.4 score of 7.5. It is notable that infliximab had a MAPT score of 3.9 at pH 5.0, suggesting that this sample would exhibit low aggregation propensity at a slightly acidic pH ().
Table 3. Clinical stage antibody therapeutics with MAPT pH 7.4 scores >6.0.
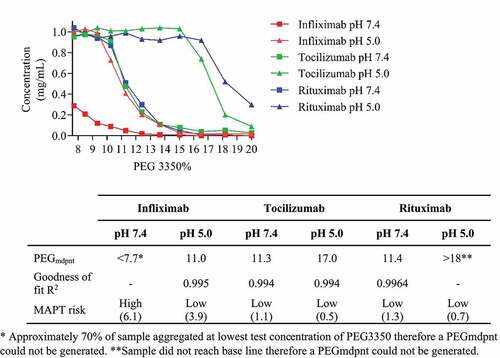
Our approach in classifying developability indicated that infliximab, an approved therapeutic IgG1 mAb for the treatment of autoimmune diseases, would have high aggregation propensity at pH 7.4, which could have been mitigated by formulation at pH 5.0. This mAb has an unusually high number of acidic residues (22), and histidine residues (4). The Fv domain has −3 net negative charge at pH 7.4, at pH 5.0 the Fv domain net charge is +1 (). To confirm our prediction, we analyzed this molecule in the PEG aggregation assay. For comparison, we also tested tocilizumab and rituximab, which MAPT predicted to have low aggregation propensity at pH 7.4 and very low aggregation propensity at pH 5.0 (). A PEGmdpnt score for infliximab at pH 7.4 could not be generated as 70% of the sample aggregated at the lowest test concentration of PEG3350. At pH 5.0 the PEGmdpnt score was 11.0, indicating a large reduction in aggregation propensity. Tocilizumab and rituximab had pH 7.4 PEGmdpnt scores of 11.3 and 11.4, respectively, at pH 5.0 both samples exhibited substantially increased PEGmdpnt scores, indicating very low aggregation propensity.
Table 4. Fv domain electrostatic descriptors and ABSASA hydrophobicity scores of three approved therapeutic mAbs. Fv domain homology model surface map: Green = hydrophobic side chains, red = acidic side chains (D&E), blue = basic side chains (R&K) and cyan = basic side chain (H).
Figure 4. Plot shows Infliximab (red line), Tocilizumab (green line), and Rituximab (blue line) concentration versus PEG 3350 concentration in PBS pH 7.4 (squares) and 50 mM acetate 125 mM sodium chloride pH 5.0 (triangles). Table insert shows MAPT scores and PEGmdpnt scores derived from a nonlinear regression, sigmoidal dose response variable slope fit.
To further validate MAPT as a suitable method for identifying IgG1 and IgG4(P) mAbs with poor developability, we examined the literature for mAbs reported to have high native state aggregation propensity with sequences in the public domain (). MEDI1912 is a phage-display derived antibody formatted as an IgG1 mAb which was reported to aggregate at 1.0 mg/mL at a near neutral pH. A variant of this mAb with reduced hydrophobicity (MEDI1912_STTIgG1) was reported to show decreased aggregation propensity compared to MEDI1912IgG1.Citation34 Our analysis of the MEDI1912 Fv domain sequence revealed a high ABSASA hydrophobicity score of 718.6 Å,Citation2 and a net negative charge of −1; MAPT assigned high aggregation risk to this molecule as an IgG1 mAb at pH 7.4. The MEDI1912_STT Fv domain showed a substantial decrease to the ABSASA hydrophobicity score (605.6 ÅCitation2) bringing it below our hydrophobic risk cutoff point defined by the clinical stage mAb panel, resulting in MAPT score predicting low aggregation risk.
Table 5. Fv domain electrostatic descriptors and ABSASA hydrophobicity scores of CNTO607, MEDI1912 and MEDI1912_STT. Fv domain surface map: Green = hydrophobic side chains, Red = Acidic side chains (D&E), Blue = basic side chains (R&K) and Cyan = basic side chain (H).
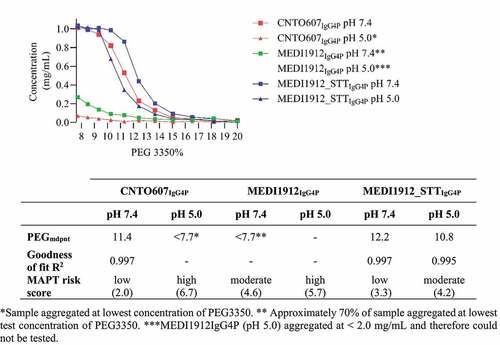
To exemplify the utility of our MAPT method, we produced MEDI1912 and MEDI1912_STT as IgG4P mAbs. PEG precipitation assay data () showed that both MEDI1912IgG4P and MEDI1912_STTIgG4P at pH 7.4 exhibited reduced native state aggregation relative to the respective sample at pH 5.0, consistent with the MAPT prediction. A PEGmdpnt for MEDI1912IgG4P at pH 7.4 could not be determined because ~70% of the sample aggregated at the lowest test concentration of PEG, indicating a high propensity for native state aggregation. The sample was stable at 2.0 mg/mL at pH 7.4. Size exclusion chromatography data indicated the sample was 98% monomer (data not shown). Buffer exchanging MEDI1912IgG4P into pH 5.0 buffer resulted in visible aggregation at <2.0 mg/mL, indicating extremely high aggregation propensity, therefore this sample could not be measured in the PEG aggregation assay. MEDI1912-STTIgG4P exhibited a large reduction in aggregation propensity compared to MEDI1912IgG4P, with a PEGmdpnt score of 12.2, at pH 7.4 and 10.8 at pH 5.0. We noted that the generated MAPT score of 4.6 (moderate-to-high aggregation risk) did not reflect the remarkable aggregation propensity of MEDI1912IgG4P. This was probably due to additional, specific factors that contributed to the unusually poor solubility of this in vitro affinity matured mAb. For example, Dobson et al. reported that MEDI1912IgG1 exhibited unique Fab – Fab domain interactions,Citation34 which would help to explain the extremely high propensity for self-interaction. Nevertheless, the molecule was correctly identified as having aggregation risk by our methodology, and importantly, the effect of altering the buffer pH, and isotype was consistent with the prediction.
Figure 5. Plot shows CNT0607IgG4P (red line), MEDI1912IgG4P (green line) and MEDI1912-STTIgG4P (blue line) concentration versus the PEG 3350 concentration in PBS pH 7.4 (squares) and 50 mM acetate 125 mM sodium chloride pH 5.0 (triangles). Table inset shows MAPT scores and PEGmdpnt scores derived from a nonlinear regression sigmoidal dose response (variable slope) fit.
Wu et al. reported that CNTO607, an IgG1 mAb that binds IL-13 with high affinity, exhibited poor solubility, aggregating at ~13.3 mg/mL in phosphate-buffered saline (PBS) pH 7.2.Citation33 In contrast to the mAb, the Fab of CNT0607 was reported to be highly soluble in PBS, reaching 160 mg/mL without any visible aggregation.Citation37 Our analysis of this Fv domain revealed a high ABSASA hydrophobicity score of 671.1 Å.Citation2 The net charge state of this Fv domain is −6. MAPT analysis assigned high aggregation risk to this Fv domain formatted as the IgG1 isotype at pH 7.4, consistent with the published experimental findings.
MAPT predicted that CNTO607, formatted as the IgG4P isotype, would show substantially different aggregation propensities at pH 7.4 and pH 5.0 compared to the IgG1 isotype. To test this, we generated CNTO607 as an IgG4P mAb. The PEG precipitation assay () gave a PEGmdpnt of 11.4 for this molecule at pH 7.4, indicating low aggregation propensity. During buffer exchange to the test pH 5.0 buffer the sample precipitated, therefore we could not generate a PEGmdpnt. These results were consistent with the MAPT prediction.
MAPT comparison to developability profiling tool
To measure the performance of MAPT, we compared our methodology to a refined versionCitation38 of the therapeutic antibody profiler (TAP),Citation39 a well-known computational method reported to selectively highlight antibodies with aggregation issues. The refined clinical stage therapeutic (CST) antibody profiling rules were calculated as described by the authors (pH range of pH 6.4 to 8.4, centered at pH 7.4). The four profiling descriptors were: CDR hydrophobicity, Fv domain charge, CDR length and Fv domain net charge asymmetry (patch_cdr_hyd, ens_charge_Fv, cdr_len, and Fv_chml = VH charge – VL charge). For patch_cdr_hyd, a cutoff of 530 ÅCitation2 was applied, an ens_charge_Fv range from −2.5 to 8.5 was used, a cdr_len window from 61 to 75 and for Fv_chml charge separation, a window from −4 to +4 was used.
compares MAPT scores, with experimentally derived native state aggregation data, to the antibody profiling method for determining developability. All antibodies’ native state aggregation risk propensities were correctly identified by MAPT. In contrast, the antibody profiling rules incorrectly identified the aggregation propensity of several samples (false positive and false negative aggregation propensity assignments). CNTO607IgG4 had three flags, suggesting high aggregation propensity, but this antibody was reported to be stable at 110 mg/ml in PBSCitation37 and had a high PEG midpoint score indicating low aggregation propensity at pH 7.4. Four antibodies had no flags, two of which (drozitumab and infliximab), were experimentally determined to show high aggregation propensity at pH 7.4.Citation16 Two samples had only one flag (duligotuzumab and sirukumab), both of which were reported to have high aggregation propensity in PBS.Citation16
Table 6. Comparison of MAPT to the mAb profiling tool.
Discussion
Therapeutic antibodies are often required to be stable at high concentrations and have high affinities. Improved affinity, however, is frequently achieved by the selection of samples that have a greater number of charged and hydrophobic residues in the CDR, which can result in increased aggregation propensity.Citation40,Citation41 This problem can be resolved by screening for (or designing) high affinity molecules that have reduced aggregation propensity. The aim of this work was to develop and validate a computational aggregation prediction methodology facilitating the early selection of viable therapeutic molecules. We previously described a charge-based model that elucidated the cause of the differential aggregation propensities of human IgG1 and IgG4(P) mAb with the same Fv domains,Citation24 and this model was recently corroborated by the work of Tang et al., Lai et al. and Han et al.Citation42–44 We reasoned that by adding a computationally derived hydrophobicity descriptor to our electrostatic model the generation of a robust aggregation propensity scoring system could be achieved.
We investigated the use of hydrophobic interaction chromatography (HIC) to experimentally validate our homology model-derived hydrophobicity scores. Several groups have reported the use of HIC for evaluating aggregation propensity by ranking sample elution times.Citation16,Citation22,Citation45 The HIC assay requires a high concentration of ammonium sulfate (0.8 M) to facilitate binding to the column matrix. To ensure that the HIC buffer did not affect native state conformation, we tested the thermal stability of eight mAbs in 0.8 M ammonium sulfate 50 mM phosphate pH 7.4 (SI ). We observed a large range of thermal stability increases of up to 10°C for the Fab domains. Notably, the Fc domains did not show substantial thermal stability changes. These data suggested that the high salt HIC buffer induced CDR structural rearrangements. Consequently, HIC retention times are unlikely to reflect the native state hydrophobicity of mAbs in typical storage buffers. This observation could explain the difficulty in using in-silico methods to accurately predict HIC column elution times.Citation46,Citation47 Therefore, we could not generate reliable experimental validation of our in-silico-derived hydrophobicity score.
To contextualize and validate the MAPT methodology, we applied it to a data set of 97 clinical stage mAb therapeutics (76 IgG1, 21 IgG4(P)). This panel was modified from the 137 clinical stage mAbs panel collected by Jain et al.Citation16 We excluded samples that had mutations in Fc domains, antibody-drug conjugates, and therapeutics with non-typical structures. It is reasonable to expect that most of these mAbs would be biased toward low aggregation propensity (greater developability). However, the fact that these mAbs reached clinical stage testing does not preclude the possibility of some of these molecules having sub-optimal developability characteristics. Typically, high-affinity antibodies are selected, and these molecules are then triaged based on their biophysical properties. Poor developability may be mitigated by time-consuming iterative experimental investigations of various purification methods and formulation conditions. Therefore, Fv domains with net charge or ABSASA hydrophobicity scores that are outside of the normal range could reflect poor developability.
We found that the 97 clinical stage samples, the majority of which belonged to the IgG1 subclass, were biased toward having positively charged Fv domains. Only five of the 97 Fv domains had net negative charge lower than −2 at pH 7.4. This observation was consistent with our isotype dependent electrostatic interaction aggregation model.
We observed a wide range of ABSASA hydrophobicity scores for the 97 Fv domains (393.8 ÅCitation2 – 757.5 ÅCitation2). We reasoned that an ABSASA hydrophobicity score greater than the 90th percentile (> 638.5 ÅCitation2) would be a good approximation of a Fv domain with an unusually high hydrophobic character. This cut off was consistent with an internally generated hydrophobic risk score generated using early stage UCB project samples (proprietary data). Five of the nine samples with high hydrophobicity scores were reported to be discontinued,Citation35,Citation36 although we appreciate that antibodies may be discontinued for a variety of reasons. The mAbs with Fv domains that had extremes of charge (+6 to +9 and −3 to −5) had relatively low ABSASA hydrophobicity scores. There were no IgG4(P) molecules in this subset with positive charge. These observations were consistent with our hypothesis that a high Fv domain ABSASA hydrophobic score combined with an unfavorably high net charge (sign dependent on isotype and buffer pH) would be predicted to show high aggregation propensity.
MAPT analysis of the 97 clinical stage mAb therapeutics showed that 75% of the samples had low MAPT scores (<4.0) at pH 7.4, indicating low aggregation risk. Five samples from the clinical stage test set had MAPT scores >6.0, four of which were reported to be discontinued (duligotuzumab, cixutumumab, sirukumab and drozitumab). Markedly, Jain et al. reported that all five of these IgG1 samples had the maximum AC SINS assay score (∆λmax 29.6 nm, tested in PBS), suggesting poor developability. It is probable that self-interactions contributed to these extremely high AC SINS scores, although additional nonspecific cross interactions with the capture complex are likely.Citation16 It was surprising to find that infliximab, an IgG1 therapeutic approved in 1998 for the treatment of rheumatoid arthritis, had a MAPT pH 7.4 score of 6.1. MAPT identified that the aggregation risk could be mitigated by formulation in a slightly acidic buffer. As predicted, infliximab showed high aggregation propensity in the PEG aggregation assay at pH 7.4 that was substantially reduced by formulating at pH 5.0. This mAb was one of the first approved antibody therapeuticsCitation36 and pre-dates the development of several biophysical assays now commonly used to rank antibody developability. These observations suggested that MAPT would be a good predictor of aggregation propensity. To confirm the utility of MAPT we examined the literature for mAbs that have been shown to have high native aggregation propensity.
CNTO607 is a potent neutralizing anti-IL-13 IgG1 monoclonal antibody derived from phage display technology. Its use as a therapeutic was prevented due to its high aggregation propensity.Citation33 The Fv domain of this mAb has a net charge of −6. The lowest net negatively charged score observed for the 97 clinical stage mAbs was −5. An ABSASA hydrophobicity score of 671.1 ÅCitation2 was generated for CNTO607, which indicated that this molecule had an Fv domain with an unusually high hydrophobicity score. MAPT flagged this molecule as having very high aggregation risk at pH 7.4 consistent with the published solubility limits of 13.3 mg/mL for this IgG1 mAb in PBS.Citation33 At pH 5.0 MAPT predicted improved solubility for this Fv domain formatted as the IgG1 Isotype. This prediction was consistent with the work of Baker et al. who reported that this molecule exhibited greater solubility in sodium acetate pH 5.0, although the extent of improvement was not defined.Citation48
To further validate the utility of our method, we generated CNTO607 as an IgG4P mAb. In contrast to CNTO607IgG1, MAPT predicted that CNTO607IgG4P would show low aggregation propensity at pH 7.4 due to lack of intermolecular electrostatic attraction between the Fv domain and constant domains/greater electrostatic repulsion. The PEG precipitation assay gave a PEGmdpnt of 11.4 for this molecule at pH 7.4, indicating low aggregation propensity. This result was in agreement with data published by Bethea et al. showing that CNTO607IgG4P did not aggregate at 110 mg/mL in PBS pH 7.2.Citation37 MAPT predicted that CNTO607IgG4p would have high risk of aggregating at pH 5.0. During buffer exchange to the slightly acidic test pH the sample visibly aggregated. Removal of aggregates by filtration and dilution to 2.0 mg/mL did not prevent further aggregation. Therefore, we could not generate a PEGmdpnt since we could not achieve a concentration of 2.0 mg/mL required for the assay. The outcome of the isotype swap was consistent with our hypothesis that Fv domain net charge can mitigate the hydrophobic contribution in a predictable manner.
MEDI1912 is a phage display-derived IgG1 mAb with picomolar affinity for nerve growth factor, but a remarkably high aggregation propensity; aggregates were observed at concentrations as low as 1.0 mg/mL.Citation34 This molecule was generated by in vitro affinity maturation of MEDI-578 which was reported not to exhibit the undesirable properties observed for MEDI1912 (aggregation propensity of MEDI-578 was not revealed). Hydrogen/deuterium-exchange mass spectrometry and the SAP algorithmCitation25 were used to identify the amino acid residues unique to MEDI1912 that were most likely to be responsible for the high aggregation propensity. Three hydrophobic residues were mutated back to the counterpart amino acids in the parental MEDI-578, W30S, F31T and L56T (MEDI1912_STT), resulting in improved relative solubility (no aggregates were observed at 1–6 mg/mL by dynamic light scattering).
We generated a homology model of the MEDI1912 Fv domain to compare our computational scoring system with the published experimental data. The net charge was determined to be −1, the ABSASA hydrophobicity score was 744.9 Å,Citation2 substantially greater than our hydrophobicity score cut off, suggesting high aggregation risk. MAPT indicated that this Fv domain would have a high risk of aggregating at pH 7.4 when formatted as the IgG1 isotype. The ABSASA hydrophobicity score for the Fv domain of MEDI1912_STT was 622.8 Å,Citation2 which was below our hydrophobicity risk cutoff point. The MAPT prediction was consistent with the published experimentally determined solubility data.
As with CNTO607, we produced MEDI1912 and MEDI1912_STT as IgG4P mAbs. MAPT indicated that both Fv domains formatted as an IgG4P mAb would show decreased aggregation propensity at pH 7.4 and greater aggregation propensity at pH 5.0. Consistent with the MAPT prediction, MEDI1912IgG4P showed high aggregation propensity at pH 5.0, with visible aggregates at 2.0 mg/mL preventing analysis by the PEG aggregation assay. At pH 7.4 MEDI1912IgG4P showed reduced aggregation propensity compared to MEDI1912IgG4P at pH 5.0. The sample was stable at 2.0 mg/mL in PBS, but a PEGmdpnt could not be determined as ~70% of the sample aggregated at the lowest test concentration of PEG3350. As predicted, the lower ABSASA hydrophobicity score of MEDI1912-STTIgG4P resulted in a substantial reduction in aggregation propensity. The PEGmdpnt score at pH 7.4 was greater than at pH 5.0, consistent with the MAPT prediction.
Taken together these data suggested that electrostatic attraction/repulsion can increase/decrease the impact of the hydrophobic aggregation force. Altering the charge state of a mAb, by changing the buffer pH can substantially alter aggregation propensity. This can be explained by the relative distances that are required for each force to show an effect. Unlike electrostatic forces, which are comparatively long ranged and can exert an effect in dilute solutions, hydrophobic forces are short ranged and require protein solutions to be relatively concentrated before having a meaningful effect. The amount of intermolecular electrostatic attractive or repulsive force likely alters the local concentration in relatively dilute solutions, thereby modulating the hydrophobic contribution.
To evaluate the predictive power of our method, we compared MAPT to a refined version of TAP, a highly cited homology model-based method for the identification of antibodies with high aggregation risk.Citation39 The refined antibody profiling method produced by Thorsteinson et al.Citation38 used four descriptors, CDR hydrophobicity, Fv domain charge, CDR length and Fv domain net charge asymmetry. The authors reported that each of these rules individually provided a trace preference for approved antibodies, but taken together, provided an enrichment for approved antibodies. MAPT correctly identified the aggregation risk of each antibody, whereas the profiling methodology gave false negative and false positive predictions compared to the experimentally derived aggregation data at the test pH.
Application of MAPT permits samples to be selected based on developability and facilitates selection of buffer pH to decrease aggregation propensity mitigating developability issues. However, samples that are predicted to have high risk of aggregation at a physiological pH may impede the effectiveness of the therapeutic. Therefore, MAPT informed engineering strategies to reduce aggregation propensity may be preferred. Biopharmaceuticals are commonly formulated at slightly acidic pH (with a variety of stabilizing agents), whereas the pH within the subcutaneous tissue is approximately 7.4.Citation49 Post administration of drug, the beneficial properties of the formulation are lost. This is a particular concern for subcutaneous administration since the sample remains at a high local concentration for a significant period, increasing the potential for aggregation. It is well known that the formation of protein aggregates can elicit adverse events and are associated with the formation of anti-drug antibodies, which may affect potency, or pharmacokinetics.Citation50 For example, Sharma et al. reported that mAbs with characteristics associated with increased aggregation propensity tended to show greater clearance in cynomolgus monkeys.Citation51 Both MEDI1912IgG1 and CNTO607IgG1 (each stabilized by slightly acidic formulation buffers) were reported to show poor pharmacokinetics/serum persistence. MEDI1912 had a poor pharmacokinetic profile compared to MEDI1912_STT, intravenous administration to rats revealed a 2-fold difference in half-life.Citation34 Baker et al. reported that CNTO607, although stable in slightly acidic formulation buffer, exhibited phase changes associated with aggregation events when mixed with serum.Citation48 Although approved, infliximab has been reported to exhibit unusually high aggregation propensity at physiological pH and is associated with a high risk of infusion-related adverse eventsCitation52 and high immunogenicity.Citation53 These observations suggested that mAbs with high aggregation propensity at physiological pH might not be optimal drug candidates. While it remains unclear what constitutes an acceptable level of aggregation propensity,Citation50,Citation54 it is reasonable to assume that therapeutic molecules with low aggregation propensity would have advantages.
Native state aggregation is an extremely complex process and not limited to electrostatic and hydrophobic interactions. Despite this, our data demonstrate that MAPT robustly predicts the aggregation propensity of an Fv domain formatted as either the hIgG1 or hIgG4(P) isotype at slightly acidic and neutral pH. This permits the selection of optimal formulation strategies, or rational engineering of antibodies with improved biophysical properties, decreasing the likelihood of encountering technical difficulties during the production of the antibody. Furthermore, MAPT offers the potential for identifying therapeutic mAbs with a lower risk of adverse events and improved pharmacokinetics. In conclusion, MAPT facilitates the early selection of therapeutic lead candidates, which may increase the efficiency of the drug discovery process, and potentially reduce the time to market and immunogenicity risk.
Materials and methods
The variable region (V-region) sequences for antibodies CNTO607 and MEDI1912 were taken from PDB entry 3G6A and patent US 2016/0297878 A1, respectively. The MEDI1912_STT variant sequence information was obtained from a report by Dobson et al.Citation34 The V-region sequences for infliximab and rituximab were taken from patents US 5656272 and WO 02/060955 A2, respectively, and the sequences for tocilizumab were taken from Sato et al.Citation55 Genes encoding the heavy and light-chain V-region sequences for each antibody were designed and constructed by an automated synthesis approach by ATUM, Inc. The synthesized genes incorporated restriction endonuclease sites to facilitate cloning into human lambda or kappa light-chain vectors or gamma-1 or gamma-4P IgG heavy-chain vectors, and Kozak and N-terminal leader peptide sequences, derived from mouse antibody V-region genes, to enable expression in mammalian cells.
Recombinant IgGs were expressed in UCB’s proprietary CHOSXE cell line using our electroporation expression platform.Citation56 Following electroporation (MaxCyte® flow electroporator), cells were cultured in wave bags for 14 days in ProCHO medium (Lonza) containing 2 mM Glutamax, at 32°C, 5% CO2. Culture supernatants were harvested by centrifugation for 45 min at 4000 RPM and clarified by filtration using 0.22 µm Stericup filters.
Purification of samples
Samples were purified using a two-step purification process. A 25 mL MabSelect SuRe column, (GE Healthcare, 17543802) and a HiLoad 16/600 and Superdex 200 prep grade gel filtration column (GE Healthcare, 28989335) was attached to an ÄKTAXpress (GE Healthcare, 18664501). The MabSelect Sure column was equilibrated in PBS pH 7.4 and supernatant was applied at a flow rate of 5 mL/min. The column was washed with PBS pH 7.4 and the bound material was eluted with 0.1 M sodium citrate, pH 3.6 and fractions were pH adjusted with 2 M TRIS-HLC pH 8.5 to a pH of 5–6 with 2 M Tris-HCl pH 8.5. The eluted material was then applied to a HiLoad Superdex 200 16/600 gel filtration column (GE Healthcare, 28989335) to remove aggregates. Unlike the other purified samples, CNT0607IgG4P and MEDI1912IgG4P exhibited high levels of aggregate formation post pH adjustment and required additional filtration steps prior to loading onto the gel filtration column.
Sample preparation
Post gel filtration, the samples’ concentrations were normalized to approximately 3.0 mg/mL, filtered through a 0.22 µm filter and buffer exchanged into PBS pH 7.4 or 50 mM sodium acetate 125 mM sodium chloride pH 5.0 using Slide-A-Lyzer™ MINI dialysis device 10 K MWCO (ThermoFisher Scientific, 88401), following the manufacturer’s instructions. Following dialysis, the samples were diluted to 2.0 mg/mL in the respective buffer. For clarity, the buffers are referred to by their pH value.
Polyethylene glycol aggregation assay
Stock PEG 3350 (Merck, 202444) solutions (w/v) were prepared in PBS pH 7.4 or 50 mM sodium acetate 125 mM sodium chloride pH 5.0. An eleven step, 1:1.1 serial titration was performed by an assist plus liquid handling robot (Integra, 4505), to avoid liquid handling issues the top concentration of PEG 3350 was limited to 40%. To minimize non-equilibrium precipitation, sample preparation consisted of mixing protein and PEG solutions at a 1:1 volume ratio. 35 µL of the PEG 3350 stock solutions was added to a 96-well v-bottom PCR plate (ThermoFisher Scientific, AB1300). 35 µL of a 2.0 mg/mL sample solution was added to the PEG stock solutions resulting in a 1.0 mg/mL test concentration and PEG 3350 concentrations of 7.7–20% (w/v). The plates were then sealed with adhesive PCR plate foils (ThermoFisher Scientific, AB0626) and incubated at 20°C for 24 h and subsequently centrifuged at 4000 x g for 1 h at 20°C. 50 µL of supernatant was dispensed into a UV-Star®, half area, 96-well, μClear®, microplate (Greiner, 675801). Protein concentrations were determined by UV spectrophotometry at 280 nm using a FLUOstar Omega multi-detection microplate reader (BMG LABTECH). The resulting values were plotted using Graphpad prism version 7.04, the PEG midpoint (PEGmdpnt) score was derived from the midpoint of a sigmoidal dose–response (variable slope) fit.
Hydrophobicity score
We first generated homology models of each Fv domain sequence being analyzed using ABodyBuilder,Citation57 and refined these models using MAESTRO prepwizard to remove any remaining steric clashes. We defined a hydrophobic residue as being one of the eight most hydrophobic residues according to the normalized hydrophobicity consensus scale published by Eisenberg et al.Citation32 These residues are: phenylalanine, isoleucine, tryptophan, leucine, valine, methionine, alanine and glycine. Every hydrophobic amino acid’s side chain ABSASA (measured in Ångstroms squared) was calculated using the program PSA, which is part of the JOY suite,Citation58 and these numbers were summed over the entire Fv region to yield a single overall score. As a natural side effect of this calculation, the contribution of each hydrophobic amino acid to the overall score is therefore weighted by the size of its sidechain, as well as its surface exposure within the local environment.
Electrostatic analysis
We used discrete charge rather than partial charge to simplify the charge scoring system. The pH values chosen for analysis (pH 7.4 and pH 5.0) are sufficiently described by discrete charge due to the dominant contribution of charged side chains at these pH values, and their prominent involvement in protein–protein self-interactions. The amino acids with electrically charged side chains used for our calculations were arginine, lysine, histidine, aspartic acid, and glutamic acid. Basic residues were binned into two groups, residues with positively charged side chains at pH 7.4 (lysine and arginine) and residues with positively charged side chains at pH 5.0 (histidine, lysine and arginine). Residues with negatively charged side chains at pH 7.4 and pH 5.0 included aspartic acid and glutamic acid. Net charge was determined by subtracting the number of negatively charged residues from the number of positively charged residues, at a given pH. The predictions are based on typical storage buffer salt concentrations (50 mM −150 mM), substantial deviations from these salt concentrations would compromise the accuracy of the prediction due to salt shielding effects.Citation24
Clinical stage therapeutic profiling tool
The method for calculating the CST profiling tool descriptors was as described by Thorsteinson et al.Citation38 In brief, homology models of the variable regions that were not part of the test set published by Thorsteinson et al. (CNTO607IgG4P, MEDI1912IgG4P and MEDI1912_STTIgG4P) were created using the Antibody Modeler application with Molecular Operating Environment (MOE) 2022.02, from the Chemical Computing Group. The descriptors were calculated with the MOE Protein Properties application with sample feature toggled on. This produced 100 conformations of each model where the framework is restrained, and sidechains are free to move using LowModeMD and alternate protonation states are sampled from pH 6.4 to 8.4, centered at pH 7.4. Four profiling rules were used describing CDR hydrophobicity, Fv domain charge, CDR length (MOE CCG CDR definition) and Fv domain net charge asymmetry (patch_cdr_hyd, ens_charge_Fv, cdr_len, and Fv_chml = VH charge – VL charge).
Alphabetical list of abbreviations
Å Angstrom; ABSASA Absolute solvent-accessible surface area; AC-SINS; Affinity-capture self-interaction nanoparticle spectroscopy; CCG Chemical Computing Group; cdr_len Total number of CDR residues annotated with CCG scheme; CST Clinical-stage therapeutic antibody; Ens_charge_Fv Forcefield charge of the Fv averaged on a structural ensemble; Fc Fragment, crystalizable domain of the antibody; Fv Fragment, variable domain of the antibody; Fv_chml Fv charge heavy minus light; HIC Hydrophobic interaction chromatography; IgG Immunoglobulin G; mAb Monoclonal antibody; MAPT mAb aggregation prediction tool; patch_cdr_hyd Surface area of the hydrophobic patches near the CDRs; PEG Polyethylene glycol; SEC Size exclusion chromatography; TAP Therapeutic antibody profiler
Supplemental Material
Download MS Word (763.4 KB)Disclosure statement
All authors in this report are employees of UCB pharma and may hold shares and/or stock options.
Supplementary material
Supplemental data for this article can be accessed online at https://doi.org/10.1080/19420862.2022.2138092
Additional information
Funding
References
- Kaplon H, Muralidharan M, Schneider Z, Reichert JM. Antibodies to watch in 2020. mAbs. 2020;12(1):1703531. doi:10.1080/19420862.2019.1703531.
- Kola I, Landis J. Can the pharmaceutical industry reduce attrition rates? Nat Rev Drug Discov. 2004;3(8):711–14. doi:10.1038/nrd1470.
- Bailly M, Mieczkowski C, Juan V, Metwally E, Tomazela D, Baker J, Uchida M, Kofman E, Raoufi F, Motlagh S, et al. Predicting antibody developability profiles through early stage discovery screening. mAbs. 2020;12(1):1743053. doi:10.1080/19420862.2020.1743053.
- Imamura H, Sasaki A, Honda S. Fate of a stressed therapeutic antibody tracked by fluorescence correlation spectroscopy: folded monomers survive aggregation. J Phys Chem B. 2017;121(34):8085–93. doi:10.1021/acs.jpcb.7b05603.
- Pham NB, Meng WS. Protein aggregation and immunogenicity of biotherapeutics. Int J Pharm. 2020;585:119523. doi:10.1016/j.ijpharm.2020.119523.
- Turner MR, Balu-Iyer SV. Challenges and opportunities for the subcutaneous delivery of therapeutic proteins. J Pharm Sci. 2018;107(5):1247–60. doi:10.1016/j.xphs.2018.01.007.
- Sauna ZE, Lagassé D, Pedras-Vasconcelos J, Golding B, Rosenberg AS. Evaluating and mitigating the immunogenicity of therapeutic proteins. Trends Biotechnol. 2018;36(10):1068–84. doi:10.1016/j.tibtech.2018.05.008.
- Xu Y, Wang D, Mason B, Rossomando T, Li N, Liu D, Cheung JK, Xu W, Raghava S, Katiyar A, et al. Structure, heterogeneity and developability assessment of therapeutic antibodies. mAbs. 2019;11(2):239–64. doi:10.1080/19420862.2018.1553476.
- Yamniuk AP, Ditto N, Patel M, Dai J, Sejwal P, Stetsko P, Doyle ML. Application of a kosmotrope-based solubility assay to multiple protein therapeutic classes indicates broad use as a high-throughput screen for protein therapeutic aggregation propensity. J Pharm Sci. 2013;102(8):2424–39. doi:10.1002/jps.23618.
- Sule SV, Sukumar M, Weiss WF, Marcelino-Cruz AM, Sample T, Tessier PM. High-throughput analysis of concentration-dependent antibody self-association. BiophysJ. 2011;101(7):1749–57. doi:10.1016/j.bpj.2011.08.036.
- Liu Y, Caffry I, Wu J, Geng SB, Jain T, Sun T, Reid F, Cao Y, Estep P, Yu Y, et al. High-throughput screening for developability during early-stage antibody discovery using self-interaction nanoparticle spectroscopy. mAbs. 2014;6(2):483–92. doi:10.4161/mabs.27431.
- Gibson TJ, Mccarty K, Mcfadyen IJ, Cash E, Dalmonte P, Hinds KD, Dinerman AA, Alvarez JC, Volkin DB. Application of a high-throughput screening procedure with PEG-induced precipitation to compare relative protein solubility during formulation development with IgG1 monoclonal antibodies. JPharmSci. 2011;100:1009–21.
- Toprani VM, Joshi SB, Kueltzo LA, Schwartz RM, Middaugh CR, Volkin DB. A micro-polyethylene glycol precipitation assay as a relative solubility screening tool for monoclonal antibody design and formulation development. J Pharm Sci. 2016;105(8):2319–27. doi:10.1016/j.xphs.2016.05.021.
- Li L, Kantor A, Warne N. Application of a PEG precipitation method for solubility screening: a tool for developing high protein concentration formulations. Protein Sci. 2013;22(8):1118–23. doi:10.1002/pro.2289.
- Atha DH, Ingham KC. Mechanism of precipitation of proteins by polyethylene glycols. Analysis in Terms of Excluded Volume J Biol Chem. 1981;256:12108–17.
- Jain T, Sun T, Durand S, Hall A, Houston NR, Nett JH, Sharkey B, Bobrowicz B, Caffry I, Yu Y, Cao Y, Lynaugh H, Brown M, Baruah H, Gray LT, Krauland EM, Xu Y, Vásquez M, Wittrup KD, et al. Biophysical properties of the clinical-stage antibody landscape. Proc Natl Acad Sci U S A. 2017;114(5):944–49. doi:10.1073/pnas.1616408114.
- Wu J, Schultz JS, Weldon CL, Sule SV, Chai Q, Geng SB, Dickinson CD, Tessier PM. Discovery of highly soluble antibodies prior to purification using affinity-capture self-interaction nanoparticle spectroscopy. Protein Eng Des Sel. 2015;28(10):403–14. doi:10.1093/protein/gzv045.
- Geng SB, Wittekind M, Vigil A, Tessier PM. Measurements of monoclonal antibody self-association are correlated with complex biophysical properties. Mol Pharm. 2016;13(5):1636–45. doi:10.1021/acs.molpharmaceut.6b00071.
- Meric G, Robinson AS, Roberts CJ. Driving forces for nonnative protein aggregation and approaches to predict aggregation-prone regions. Annu Rev Chem Biomol Eng. 2017;8(1):139–59. doi:10.1146/annurev-chembioeng-060816-101404.
- Sormanni P, Amery L, Ekizoglou S, Vendruscolo M, Popovic B. Rapid and accurate in silico solubility screening of a monoclonal antibody library. Scientific Reports. 2017;7(1):8200. doi:10.1038/s41598-017-07800-w.
- Lauer TM, Agrawal NJ, Chennamsetty N, Egodage K, Helk B, Trout BL. Developability index: a rapid in silico tool for the screening of antibody aggregation propensity. J Pharm Sci. 2012;101(1):102–15. doi:10.1002/jps.22758.
- Wolf Perez AM, Sormanni P, Andersen JS, Sakhnini LI, Rodriguez-Leon I, Bjelke JR, Gajhede AJ, De Maria L, Otzen DE, Vendruscolo M, et al. In vitro and in silico assessment of the developability of a designed monoclonal antibody library. mAbs. 2019;11(2):388–400. doi:10.1080/19420862.2018.1556082.
- Gentiluomo L, Svilenov HL, Augustijn D, El Bialy I, Greco ML, Kulakova A, Indrakumar S, Mahapatra S, Morales MM, Pohl C, et al. Advancing therapeutic protein discovery and development through comprehensive computational and biophysical characterization. Mol Pharm. 2020;17(2):426–40. doi:10.1021/acs.molpharmaceut.9b00852.
- Heads JT, Lamb R, Kelm S, Adams R, Elliott P, Tyson K, Topia S, West S, Nan R, Turner A, et al. Electrostatic interactions modulate the differential aggregation propensities of IgG1 and IgG4P antibodies and inform charged residue substitutions for improved developability. Protein Eng Des Sel. 2019;32(6):277–88. doi:10.1093/protein/gzz046.
- Chennamsetty N, Voynov V, Kayser V, Helk B, Trout BL. Design of therapeutic proteins with enhanced stability. Proc Natl Acad Sci U S A. 2009;106(29):11937–42. doi:10.1073/pnas.0904191106.
- Zambrano R, Jamroz M, Szczasiuk A, Pujols J, Kmiecik S, Ventura S. AGGRESCAN3D (A3D): server for prediction of aggregation properties of protein structures. Nucleic Acids Res. 2015;43(W1):W306–13. doi:10.1093/nar/gkv359.
- Nichols P, Li L, Kumar S, Buck PM, Singh SK, Goswami S, Balthazor B, Conley TR, Sek D, Allen MJ, et al. Rational design of viscosity reducing mutants of a monoclonal antibody: hydrophobic versus electrostatic inter-molecular interactions. mAbs. 2015;7(1):212–30. doi:10.4161/19420862.2014.985504.
- Moelbert S, Emberly E, Tang C. Correlation between sequence hydrophobicity and surface-exposure pattern of database proteins. Protein Sci. 2004;13(3):752–62. doi:10.1110/ps.03431704.
- Palliser CC, Parry DA. Quantitative comparison of the ability of hydropathy scales to recognize surface beta-strands in proteins. Proteins. 2001;42(2):243–55. doi:10.1002/1097-0134(20010201)42:2<243::AID-PROT120>3.0.CO;2-B.
- Biswas KM, DeVido DR, Dorsey JG. Evaluation of methods for measuring amino acid hydrophobicities and interactions. J Chromatogr A. 2003;1000(1–2):637–55. doi:10.1016/s0021-9673(03)00182-1.
- Simm S, Einloft J, Mirus O, Schleiff E. 50 years of amino acid hydrophobicity scales: revisiting the capacity for peptide classification. Biol Res. 2016;49(1):31. doi:10.1186/s40659-016-0092-5.
- Eisenberg D, Schwarz E, Komaromy M, Wall R. Analysis of membrane and surface protein sequences with the hydrophobic moment plot. J Mol Biol. 1984;179(1):125–42. doi:10.1016/0022-2836(84)90309-7.
- Wu S-J, Luo J, O’Neil KT, Kang J, Lacy ER, Canziani G, Baker A, Huang M, Tang QM, Raju TS, et al. Structure-based engineering of a monoclonal antibody for improved solubility. Protein Eng Des Sel. 2010;23(8):643–51. doi:10.1093/protein/gzq037.
- Dobson CL, Devine PW, Phillips JJ, Higazi DR, Lloyd C, Popovic B, Arnold J, Buchanan A, Lewis A, Goodman J, et al. Engineering the surface properties of a human monoclonal antibody prevents self-association and rapid clearance in vivo. Sci Rep. 2016;6(1):38644. doi:10.1038/srep38644.
- The Antibody Society. Antibody therapeutics in late-stage clinical studies; 2022 Oct 01 [accessed 2022 Oct 15]. https://www.antibodysociety.org/antibodies-in-late-stage-clinical-studies/.
- The Antibody Society. Therapeutic monoclonal antibodies approved or in regulatory review. [accessed 2022 Oct 15]. https://www.antibodysociety.org/antibody-therapeutics-product-data.
- Bethea D, Wu SJ, Luo J, Hyun L, Lacy ER, Teplyakov A, Jacobs SA, O’Neil KT, Gilliland GL, Feng Y, et al. Mechanisms of self-association of a human monoclonal antibody CNTO607. Protein Eng Des Sel. 2012;25(10):531–38. doi:10.1093/protein/gzs047.
- Thorsteinson N, Gunn JR, Kelly K, Long W, Labute P. Structure-based charge calculations for predicting isoelectric point, viscosity, clearance, and profiling antibody therapeutics. mAbs. 2021;13(1):1981805. doi:10.1080/19420862.2021.1981805.
- Raybould MIJ, Marks C, Krawczyk K, Taddese B, Nowak J, Lewis AP, Bujotzek A, Shi J, Deane CM. Five computational developability guidelines for therapeutic antibody profiling. Proc Natl Acad Sci U S A. 2019;116(10):4025–4030. doi:10.1073/pnas.1810576116.
- Rabia LA, Desai AA, Jhajj HS, Tessier PM. Understanding and overcoming trade-offs between antibody affinity, specificity, stability and solubility. Biochem Eng J. 2018;137:365–74. doi:10.1016/j.bej.2018.06.003.
- Kuroda D, Tsumoto K. Engineering stability, viscosity, and immunogenicity of antibodies by computational design. J Pharm Sci. 2020;109:1631–51.
- Lai PK, Ghag G, Yu Y, Juan V, Fayadat-Dilman L, Trout BL. Differences in human IgG1 and IgG4 S228P monoclonal antibodies viscosity and self-interactions: experimental assessment and computational predictions of domain interactions. mAbs. 2021;13(1):1991256. doi:10.1080/19420862.2021.1991256.
- Tang Y, Cain P, Anguiano V, Shih JJ, Chai Q, Feng Y. Impact of IgG subclass on molecular properties of monoclonal antibodies. mAbs. 2021;13(1):1993768. doi:10.1080/19420862.2021.1993768.
- Han X, Shih J, Lin Y, Chai Q, Cramer SM. Development of QSAR models for in silico screening of antibody solubility. mAbs. 2022;14(1):2062807. doi:10.1080/19420862.2022.2062807.
- Jarasch A, Koll H, Regula JT, Bader M, Papadimitriou A, Kettenberger H. Developability assessment during the selection of novel therapeutic antibodies. J Pharm Sci. 2015;104(6):1885–98. doi:10.1002/jps.24430.
- Jain T, Boland T, Lilov A, Burnina I, Brown M, Xu Y, Vásquez M. Prediction of delayed retention of antibodies in hydrophobic interaction chromatography from sequence using machine learning. Bioinform 2017;33(23):3758–66. doi:10.1093/bioinformatics/btx519.
- Hebditch M, Roche A, Curtis RA, Warwicker J. Models for antibody behavior in hydrophobic interaction chromatography and in self-association. J Pharm Sci. 2019;108(4):1434–41. doi:10.1016/j.xphs.2018.11.035.
- Baker AE, Mantz AR, Chiu ML. Raman spectroscopy characterization of antibody phases in serum. mAbs. 2014;6(6):1509–17. doi:10.4161/19420862.2014.975100.
- Kinnunen HM, Mrsny RJ. Improving the outcomes of biopharmaceutical delivery via the subcutaneous route by understanding the chemical, physical and physiological properties of the subcutaneous injection site. J Control Release. 2014;182:22–32. doi:10.1016/j.jconrel.2014.03.011.
- Moussa EM, Panchal JP, Moorthy BS, Blum JS, Joubert MK, Narhi LO, Topp EM. Immunogenicity of therapeutic protein aggregates. J Pharm Sci. 2016;105(2):417–30. doi:10.1016/j.xphs.2015.11.002.
- Sharma VK, Patapoff TW, Kabakoff B, Pai S, Hilario E, Zhang B, Li C, Borisov O, Kelley RF, Chorny I, Zhou JZ, Dill KA, Swartz TE, et al. In silico selection of therapeutic antibodies for development: viscosity, clearance, and chemical stability. Proc Natl Acad Sci U S A 2014; 111(52):18601–06 doi:10.1073/pnas.1421779112. Erratum in: Proc Natl Acad Sci U S A. 2015;112(48):E6719.
- Lichtenstein L, Ron Y, Kivity S, Ben-Horin S, Israeli E, Fraser GM, Dotan I, Chowers Y, Confino-Cohen R, Weiss B, et al. Infliximab-related infusion reactions: systematic review. J Crohn’s Colitis. 2015;9(9):806–15. doi:10.1093/ecco-jcc/jjv096.
- Radstake TR, Svenson M, Eijsbouts AM, van den Hoogen FH, Enevold C, van Riel PL, Bendtzen K. Formation of antibodies against infliximab and Adalimumab strongly correlates with functional drug levels and clinical responses in rheumatoid arthritis. Ann Rheum Dis. 2009;68(11):1739–45. doi:10.1136/ard.2008.092833.
- Roberts CJ. Therapeutic protein aggregation: mechanisms, design, and control. Trends Biotechnol. 2014;32(7):372–80. doi:10.1016/j.tibtech.2014.05.005.
- Sato K, Tsuchiya M, Saldanha J, Koishihara Y, Ohsugi Y, Kishimoto T, Bendig MM. Reshaping a human antibody to inhibit the interleukin 6-dependent tumor cell growth. Cancer Res. 1993;53:851–56.
- Cain K, Peters S, Hailu H, Sweeney B, Stephens P, Heads J, Sarkar K, Ventom A, Page C, Dickson A, et al. A CHO cell line engineered to express XBP1 and ERO1-Lα has increased levels of transient protein expression. Biotechnol Prog. 2013;29(3):697–706. doi:10.1002/btpr.1693.
- Leem J, Dunbar J, Georges G, Shi J, Deane CM. ABodyBuilder: automated antibody structure prediction with data-driven accuracy estimation. mAbs. 2016;8(7):1259–68. doi:10.1080/19420862.2016.1205773.
- Mizuguchi K, Deane CM, Blundell TL, Johnson MS, Overington JP. JOY: protein sequence-structure representation and analysis. Bioinform 1998;14(7):617–23. doi:10.1093/bioinformatics/14.7.617.