
 ?Mathematical formulae have been encoded as MathML and are displayed in this HTML version using MathJax in order to improve their display. Uncheck the box to turn MathJax off. This feature requires Javascript. Click on a formula to zoom.
ABSTRACT
Receptor occupancy assays applied in clinical studies provide insights into pharmacokinetic-pharmacodynamic relationships for therapeutic antibodies. When measured by different assays, however, receptor occupancy results can be controversial, as was observed for nivolumab, a monoclonal antibody targeting programmed cell death 1 (PD-1) receptor. We suggested an explanation of results obtained and a mechanistic approach based on specific features of the receptor occupancy assays: measurement of the free or bound receptor, normalized to the baseline or at each time point. The approach was evaluated against controversial clinical data on PD-1 receptor occupancy by nivolumab. It was shown that receptor occupancy measured by different assays might vary substantially if the internalization rate of the bound receptor is higher than the rate of degradation of the free receptor. Equations proposed in this work can be applied in quantitative systems pharmacology models to describe target receptor occupancy by different therapeutic antibodies.
KEYWORDS:
Introduction
Immune checkpoint molecules are one of the most promising targets for application in the immune-oncology area.Citation1 Engineered monoclonal antibodies (mAbs) are widely used as agents targeting membrane-bound receptors on the surface of immune and cancer cells to modulate an immune response. In this way, mAb-based therapies require a reliable method of target binding assessment to support decision-making on the way from preclinical studies toward first in-human trials. Receptor occupancy (RO) is a direct measure of mAb binding to a target, which is believed to provide information on the early pharmacodynamic (PD) efficacy of the therapy.Citation2 It is worth noting that the target engagement does not necessarily result in a functional effect, and there are a large number of factors affecting clinical response (e.g., anti-drug antibodies, immune cell infiltration, exhaustion, tumor mutational burden). RO should be considered an initial step toward the initiation of the PD effects. By definition RO is a proportion of total surface receptor occupied by drug, but flow cytometry-based RO assays vary in performance and are not so straightforward for interpretation, which might be challenging in quantitative systems pharmacology (QSP) studies.Citation3
Nivolumab (Opdivo®) is a human IgG4 mAb that targets programmed cell death 1 (PD-1) receptor on lymphocytes. PD-1 receptor is an extensively studied immune checkpoint protein mainly expressed by activated T cells, which promotes self-tolerance suppressing T-cell activity.Citation4,Citation5 PD-1 blocking by nivolumab prevents binding of its natural ligands, PD-L1 and PD-L2, which results in activation of T cells and restores cell-mediated effector functions.Citation6 Nivolumab’s efficacy was demonstrated in a number of clinical trials, and the US Food and Drug Administration has approved it for treatment of various cancers. including melanoma,Citation7 non-small cell lung cancer,Citation8 renal cell carcinoma (RCC),Citation9 and classical Hodgkin lymphoma.Citation10 Nivolumab has a manageable safety profile with a relatively low frequency of serious adverse events at doses up to 10 mg/kg.Citation11 Hence, a dose of 240 mg every 2 weeks (Q2W) is recommended as the main treatment regimen, but a 480 mg every 4 weeks (Q4W) extended regimen is also used.Citation12
Comprehensive analysis of nivolumab clinical data revealed unexpected and controversial results: Phase 1 study data show mean trough RO in blood around 70% even at the highest doses, whereas later study data indicate sustainable RO ≥ 90% at all dose levels (ClinicalTrials.gov numbers, NCT00730639 and NCT01358721, respectively).Citation13,Citation14 This discrepancy might raise questions regarding the performance of RO assays and calls for a correct interpretation of the obtained results. To this end, we decided to suggest a validated approach for RO description in terms of QSP modeling and conducted a model-based analysis of clinical data in an attempt to explain discordant nivolumab RO results.
Results
Simulations of nivolumab pharmacokinetics
The developed model structure () is sufficient to reproduce nivolumab pharmacokinetic (PK) profiles and does not require incorporating non-linear clearance via binding with the target, since there is no evidence of target-mediated drug disposition effects at the studied doses. The plasma nivolumab concentration profiles generated using estimates on PK parameters are consistent with observed clinical dataCitation14 (Figure S1). Moreover, the simulations show that nivolumab serum concentration tends to accumulation at multiple dosing (data not shown).
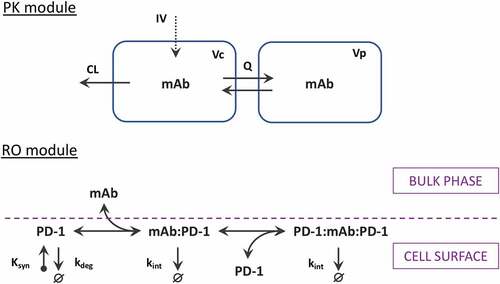
Figure 1. Scheme of the PK-RO model for mAbs targeting PD-1 receptor. The PK module describes pharmacokinetics utilizing a generic two-compartmental model with zero-order intravenous (IV) infusion. The PD-1 module describes the dynamics of PD-1 receptors (synthesis, degradation, and internalization) as well as receptor interactions with mAb at the cellular surface.
Prediction of PD-1 occupancy by nivolumab in peripheral blood
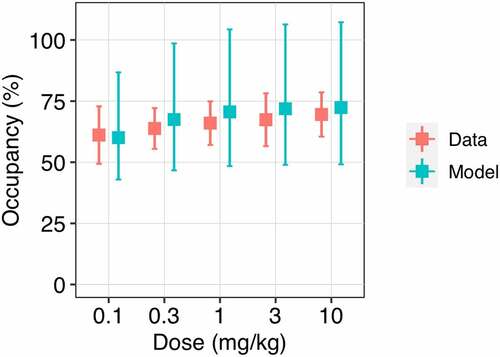
shows trough RO generated using Equationequation 3(3)
(3) (measurement of the bound receptor with normalization to a baseline). Simulated trough PD-1 occupancy gradually increases from 60 to 70% according to nivolumab dose level 0.1 to 10 mg/kg intravenous (IV) Q2W, which is in good agreement with observed data.Citation15 Simulated PD-1 RO profiles after a single administration of nivolumab dose 0.3 to 10 mg/kg demonstrate a peak occupancy around 80–90% at the end of infusion and then sustainable plateau occupancy of 70%, maintained over an extended period of time (Figure S2). Long-term simulations following administration of nivolumab 10 mg/kg reveal high stability and retention of PD-1 occupancy with an apparent half-life ~150 daysCitation13 (Figure S3). The utilization of Equationequation 3
(3)
(3) for RO simulations provides a concordance between the model predictions and clinical data from the Phase 1 trial.
Figure 2. Observed and model predicted trough PD-1 occupancy depending on nivolumab dose level. The trough receptor occupancy in peripheral blood was assessed at day 56 of treatment at a dose of 0.1 to 10 mg/kg Q2W. Red symbols represent the clinical data (mean ± SD); blue symbols correspond to the model simulations (median with 95% CI).
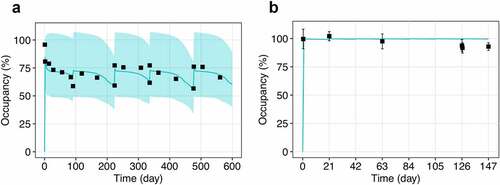
Simulations of PD-1 occupancy following multiple administration of nivolumab 10 mg/kg from different clinical studies are shown in . Despite the similar dose level, there is a drastic difference in clinical RO profiles, which was captured by different equations for RO assessment: Equationequation 3(3)
(3) with receptor normalization to baseline () and Equationequation 4
(4)
(4) with receptor normalization at each time point (). Indeed, simulations conducted according to Equationequation 4
(4)
(4) demonstrate ≥90% PD-1 occupancy during the dosing interval and less pronounced RO dose-dependence at the studied doses 0.3, 2, and 10 mg/kg IV Q3W14 (Figure S4). Application of various equations for RO demonstrates good visual predictive check and allows the observed heterogeneity of the data to described without changes in model parameters and structure.
Figure 3. Observed and model predicted profiles of PD-1 occupancy after multiple administration of nivolumab 10 mg/kg. (a) EquationEquation 3(3)
(3) was used to generate the RO profile with receptor normalization to the baseline level. (b) EquationEquation 4
(4)
(4) was used to generate the RO profile with receptor normalization at each time point. Symbols represent the clinical data (mean ± SD); solid lines correspond to the model simulations (median with 95% CI).
Comparison of RO assessment strategies
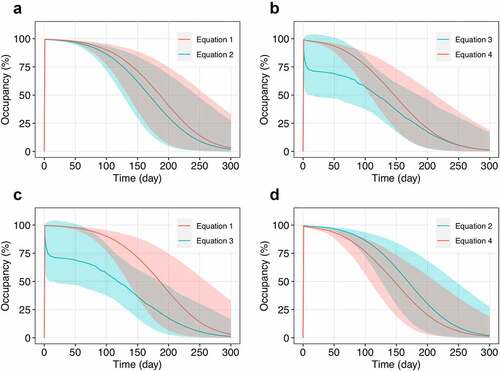
To illustrate the proof of concept in practice, the paired comparisons of RO assessment equations are presented in . The flat dose 240 mg approved for nivolumab was chosen as a reference for PD-1 occupancy simulations. The results obtained from Equationequation 1(1)
(1) and Equationequation 2
(2)
(2) (associated with measurements of free PD-1 receptor) provide mainly overlapping RO profiles with a slightly higher occupancy in Equationequation 1
(1)
(1) (), whereas Equationequation 3
(3)
(3) and Equationequation 4
(4)
(4) (associated with measurements of bound PD-1 receptor) result in substantially different modes of RO dynamics (), which were supported by clinical data in the previous section (). EquationEquations 1
(1)
(1) , Equation2
(2)
(2) , and Equation4
(4)
(4) demonstrate almost complete and prolonged PD-1 occupancy after infusion with subsequent decay. Unlike other equations, Equationequation 3
(3)
(3) provides a complex RO profile with a sharp peak during the first day after infusion followed by a slowly decaying plateau. These differences in RO description stem from the dynamics of corresponding molecular species, which are used for RO calculation (Figure S5). Paired comparison of Equationequations 1
(1)
(1) versus 3 (associated with normalization to baseline) and Equationequations 2
(2)
(2) versus 4 (associated with normalization at each time point) follows the similar trends described above (). In general, reported occupancy level and its apparent maintenance depend on the strategy of RO assessment and increase in raw: Equationequation 3
(3)
(3) < Equationequation 4
(4)
(4) < Equationequation 2
(2)
(2) < Equationequation 1
(1)
(1) .
Figure 4. Comparison of PD-1 occupancy profiles generated utilizing different strategies of RO assessment. (a) EquationEquation 1(1)
(1) versus Equationequation 2
(2)
(2) – free receptor measurements with normalization to baseline and at each time point, respectively; (b) Equationequation 3
(3)
(3) versus Equationequation 4
(4)
(4) – bound receptor measurements with normalization to baseline and at each time point, respectively; (c) Equationequation 1
(1)
(1) and Equationequation 3
(3)
(3) – free and bound receptor measurements with normalization to baseline, respectively; (d) Equationequation 2
(2)
(2) and Equationequation 4
(4)
(4) – free and bound receptor measurements with normalization at each time point, respectively. The simulations were conducted for a single infusion of nivolumab at a flat dose of 240 mg. Solid lines correspond to the model simulations (median with 95% CI).
Additionally, we conducted the simulations, assuming that there is no enhanced internalization of bound receptors (i.e., the rate constant of internalization equals the rate constant of degradation of free receptors). As expected, the RO equations with normalization to baseline and normalization to total at each time point demonstrated similar results (Figure S6 A, B) in the framework of free (Equationequations 1(1)
(1) and Equation2
(2)
(2) ) and bound (Equationequations 3
(3)
(3) and Equation4
(4)
(4) ) strategies. However, simulations revealed the difference between free and bound strategies (Figure S6 C, D), which directly follows from the methodology: the bound strategy detects the drug bound to receptors (
) instead of bound receptors (
).
Discussion
RO assays applied in clinical studies might provide insights into PK/PD relationships for drugs targeting immune checkpoint receptors. PD-1 is markedly expressed on the surface of circulating T cellsCitation16 and blood sampling makes it available for further analysis. The first in-human, Phase 1, dose-escalation study (NCT00730639) reported that PD-1 occupancy after nivolumab administration appears to be dose-independent with a mean peak occupancy of 85% immediately after infusion and a mean plateau occupancy of 72%.Citation13 In addition, the study revealed a long persistent PD-1 occupancy, even when serum nivolumab levels were below the lower limit of quantification (<1 μg/mL), which is consistent with a high binding affinity of nivolumab (KD ~ 3 nM). In the nivolumab metastatic RCC study (NCT01358721), RO was assessed using fresh whole blood specimens and RO profiles were similar across all dose cohorts (0.3, 2, and 10 mg/kg Q3W). Surprisingly, in contrast to previous studies, PD-1 occupancy of ≥ 90% was achieved within one hour post nivolumab administration and remained near this level throughout the entire treatment cycle.Citation14 These observations raise speculations of data inconsistency and reliability of dose selection that requires more detailed consideration.
The reported differences in steady-state RO (70% versus 90%) have been attributed to the use of frozen peripheral blood mononuclear cells (PBMCs) for the analysis in Phase 1 and freshly isolated PBMCs in metastatic RCC study, respectively. The investigators hypothesized that PD-1 occupancy analyses of cryopreserved PBMCs may underestimate occupancy on fresh PBMCs.Citation13 However, cryopreservation is necessary for the transportation and serial analysis of samples from clinical studies. Indeed, dimethyl sulfoxide, a common cryopreservation agent that infiltrates the cells and affects their viability, must be removed during the thawing procedure, which may compromise the assays.Citation17 A recent study on defrosted samples reported trough PD-1 occupancy of ~99% on CD8 T cells in cancer patients who received nivolumab 3 mg/kg or flat dose 240/480 mg Q2W or Q4W.Citation16 Nevertheless, the authors noted that the composition of the mixture for cryopreservation may affect the percentage of PD-1-positive T cells. It is still unknown whether these findings reflect the linkage between experimental manipulations (freezing and thawing) and the results of RO assay.
In this work, we propose another hypothesis that may explain the previous controversial observations and highlight some challenges in RO assessment. It is formulated as follows: the use of different RO assay formats with specific algorithms of RO calculation may result in different outputs (). To our knowledge, there is only one article that provides information on direct comparison of the RO quantification strategies,Citation3 whereas clinical reports are often accompanied by a poor description of the RO calculation procedure. In hindsight, utilization of anti-drug antibodies was chosen as the main strategy for RO quantification in the first clinical trials, since nivolumab is a human IgG4 antibody that makes it convenient for detection. This refers to the “bound receptor” format of RO assay evaluating the amount of antibody attached to the cell surface. However, the experiment description often does not provide information on details of calculus, not specifying what was used as a denominator in RO equation, i.e., the baseline amount of receptor or the total amount of receptor measured at each time point. As it was demonstrated earlier for Equationequation 3(3)
(3) and Equationequation 4
(4)
(4) (), this results in various RO profiles under similar conditions.
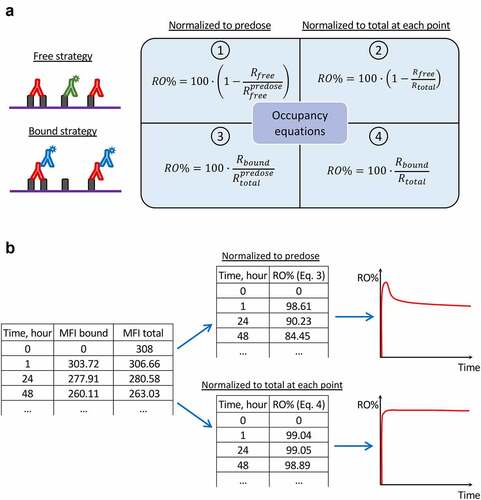
Figure 5. Different formats of receptor occupancy assays and equations utilized for occupancy calculation. (a) Scheme reflecting the links between flow cytometry strategies for RO assessment and corresponding equations for RO calculation. (b) An example of PD-1 occupancy calculations based on raw MFI data, which results in different occupancy values. The initial table contains MFI values (subtracting background signal) corresponding to the drug bound to receptor and to the total receptor, respectively. The upper table and graph represent RO values calculated with Equationequation 3(3)
(3) , whereas the lower table and graph represent RO values calculated with Equationequation 4
(4)
(4) . The results diverge due to different normalization during RO calculations.
Receptor internalization is an important factor for consideration in RO assays. If receptors internalize in vivo upon drug binding, this may lead to inaccuracy of receptor assessments. For example, receptor binding may be underestimated if a fluorescence-labeled secondary antibody is used for detection since previously bound receptors might be internalized. Downmodulation of PD-1 expression by ~25% in cancer patients during the treatment with anti-PD-1 mAbs has been reported.Citation16,Citation18 The PD-1 pathway has a sophisticated system of recycling that rescue internalized receptor from degradation and maintain surface receptors at a certain level.Citation19 Hence, the use of Equationequation 3(3)
(3) allows dynamic changes in the number of bound receptors normalized to the baseline to be monitored: if PD-1 receptors are completely occupied by an antibody that induces receptor internalization, decreasing expression below the baseline level (Figure S5). It is precisely for this reason that we observe the unusual shape of the RO profile with a transient peak after infusion followed by a prolonged plateau occupancy. Thus, measuring the occupancy status along with the expression level of the receptor provides additional mechanistic insights into PD efficacy.
In this context, the “free receptor” format of RO assay seems more robust to modulation of expression by definition: if there are no free receptors for detection, the RO equation tends to 100% regardless of total receptor amount. However, little is known about the application of this format to nivolumab studies. We found only a few cases that illustrate the implementation of Equationequation 1(1)
(1) and Equationequation 2
(2)
(2) in practice.Citation20,Citation21 These results are in line with model prediction, indicating a high trough PD-1 occupancy of ≥90% after nivolumab administration.
It was shown earlier that normalization over total receptor allowed variability of receptor expression to be overcome and allowed the most accurate measurement of RO.Citation22 This fact is consistent with model simulations using Equationequation 2(2)
(2) and Equationequation 4
(4)
(4) . In terms of mathematics, that means, if both numerator and denominator in RO equations are simultaneously calculated at each time point, and the numerator does not exceed denominator, RO does not exceed 100% in contrast to baseline normalization (). That is why we observe fewer variability rates in simulations when all receptors are saturated by the drug.
These observations are not limited to the nivolumab RO. For instance, we found analogous RO data discrepancies for two other anti-PD-1 mAbs budigalimab (ABBV-181) and camrelizumab (SHR-1210). Both drugs were studied at similar dose levels, have comparable PK profiles and affinities similar to nivolumab. However, the reported occupancy values were significantly different: almost complete occupancy for budigalimabCitation23 versus ~80% for camrelizumab.Citation24 For budigalimab, the authors reported that free strategy with normalization to baseline (Equationequation 1(1)
(1) ) was used for RO assessment, whereas for camrelizumab, a bound strategy but no description of the normalization method was reported. Hence, assuming that normalization to baseline (Equationequation 3
(3)
(3) ) was used for camrelizumab RO calculation, we may explain the observed difference in reported RO values.
Another important example follows from clinical data on the anti-CD47 antibody magrolimab.Citation25 The bound strategy was used for occupancy assessment, but the normalization way of RO data was not specified. The study reported approximately 100% CD47 RO on circulating red blood cells (RBCs) and white blood cells (WBCs). Interestingly, treatment with magrolimab resulted in almost complete downregulation of the CD47 receptor on RBCs, whereas CD47 expression on WBCs remained nearly constant.Citation26 Summing the results, it becomes clear that only normalization to the total receptor at each time point (Equationequation 4(4)
(4) ) may provide 100% CD47 occupancy under such specific conditions. That is why it is important to measure not only the RO, but to track the receptor expression level as well.
Our work not only demonstrates how to describe RO in QSP modeling using different output functions based on RO assays design, but also suggests the possible explanation of controversial experimental results. We believe that these findings may be extrapolated for other targets and the development of RO assays to support clinical studies.
Materials and Methods
Nivolumab pharmacokinetics
A generic two-compartmental model with zero-order IV infusion was used to describe PK. Estimates on PK parameters (with inter-patient variability) such as volume of distribution in the central and peripheral compartments (Vc and Vp, respectively), inter-compartmental clearance (Q), and clearance from the central compartment (CL) were taken from population PK analysis of nivolumab.Citation27 To describe the effect of body weight, it was included as a covariate of the central compartment volume and clearance. The final list of PK parameters is presented in .
Table 1. Overview of the model parameters and their origin.
PD-1 receptor dynamics
The modeling of receptor dynamics may be performed in different ways: single-cell modeling or bulk-phase modeling in which receptor dynamics is merged with cellular dynamics and describes the total receptor amount in the compartment. The single-cell consideration is closer to the principles of flow cytometry that are used for the analysis of protein expression and characterization of distinct cell types. The proposed receptor model describes the following processes at the single-cell level: (1) free receptor synthesis and degradation at the surface of CD4 and CD8 T cells; (2) two-step binding of bivalent mAb with membrane-bound PD-1 receptor; and (3) internalization of all PD-1 bound forms from the cell surface ().
The two-step binding process is attributed to the bivalent binding properties of mAbs. Indeed, the first step occurs when mAb from bulk-phase binds PD-1 on the cell surface, whereas the second step is completely limited to the cellular surface. It is worth noting that the parameters of the mAb-receptor interactions at each step should be different due to the reduction of dimensionality.Citation28–30 It is unknown whether the formation of ternary complexes (PD-1:mAb:PD-1) is allowed by the conformation of mAb-receptor complexes or not, but it is considered as a general case in the model. A more detailed description of the difference between the first and second binding events can be found in the supplementary information.
The PD-1 turnover rate was estimated on the basis of in vivo data on 13C6-leucine administration and subsequent quantification of isotope-labeled receptors in peripheral blood mononuclear cells, the reported PD-1 median half-live is 49.5 hours.Citation31 The internalization rate of bound PD-1 should be substantially higher than the degradation rate that results in the apparent receptor downmodulation (median fold change ~0.75) during the course of treatment with anti-PD-1 mAbs.Citation16,Citation18 All these processes occur at the cellular membrane, the surface area of which was estimated based on the spherical volume of cell.Citation32 The full list of parameters related to the PD-1 receptor is presented in . The results of parameter sensitivity analysis can be found in Table S1 in the supplementary information.
Receptor occupancy assessment
RO assays are based on ex vivo flow cytometry analysis that allows measurement of the level of target engagement in the patient’s sample. Briefly, as described below, RO assays include several formats depending on experimental design and performance.Citation3
The “free receptor” format evaluates the amount of receptor which is not occupied by drug using either fluorescently labeled drug or competitive antibody (). RO is defined as follows RO% = 100 – %Free. To establish the reference point, the format requires the measurement of the predose level of the receptor (Equationequation 1(1)
(1) ) or the total receptor during the time course of treatment (Equationequation 2
(2)
(2) ). Assessment of total receptor expression may be performed using the noncompetitive antibody or the excess of labeled drug that saturates receptor.
“Bound receptor” format evaluates the amount of drug bound directly to the receptor using the fluorescently labeled anti-drug antibodies (). In this case, RO corresponds to the %Bound. As well as in the free format assay, experimental data may be normalized to the predose level of the receptor (Equationequation 3(3)
(3) ) or the total receptor at each time point during the treatment (Equationequation 4
(4)
(4) ).
Therefore, experimental design dictates the formulation of equations for RO calculation and requires the analogous expression in terms of the model:
where is the amount of free receptor, sum
denotes the amount of drug bound to the receptor,
is the predose amount of receptor, and sum
denotes the actual amount of total receptor taking into account the stoichiometry of formed antibody-receptor complexes.
It is important to note that there are background signals related to the nonspecific binding and/or autofluorescence which should be subtracted from both the numerator and denominator of the equations.Citation18 The contribution of nonspecific signals is out of the scope of our research and is considered to be negligible.
In clinical studies, RO is often assessed on the basis of the percentage of cells harboring receptors instead of mean fluorescence intensity (MFI), which is believed to be directly proportional to the number of receptors at the cell surface. Indeed, the percentage of positive cells is linked to some extent with the number of molecules per cell, but the exact relationship is unknown.Citation33 Hence, it was assumed that these RO calculations based on MFI and % PD-1(+) cells result in similar values.
Parameter variability implementation
To implement the inter-patient variability in the model, several parameters sets (corresponds to a number of virtual patients, N = 100) were generated using the information on parameters distribution (). We conducted the simulations for each parameter set and then presented results as 2.5-th, 50-th, and 97.5-th percentiles. The general rule of parameter variation may be expressed as follows:
where is the estimated parameter value for i-th individual,
is an estimate of the typical population value of the parameter,
is a normally distributed random variable with zero mean and variance related to the
parameter,
is the body weight of i-th individual,
is the reference body weight in the population, and
represents the body weight covariate (related only to nivolumab PK parameters Vc and CL).Citation27
Modeling software
The model was developed using the Heta compiler.Citation34 Heta compiler is a tool for the development of QSP platforms that allows storing models in different formats (e.g., XLSX or Heta language code) and exporting them into different formats including SBML, SLV, mrgsolve, Simbio, and Matlab. The fully annotated model equations and parameters are presented in XLSX file, which may be converted into the desired format (Supplementary Material). The simulations were performed using DBSolve Optimum software package.Citation35
Abbreviations
mAbs: monoclonal antibodies; MFI: mean or median fluorescence intensity; PBMCs: peripheral blood mononuclear cells; PD-1: programmed cell death 1 receptor; PD: pharmacodynamics; PK: pharmacokinetics; QSP: quantitative systems pharmacology; RBCs: red blood cells; RCC: renal cell carcinoma; RO: receptor occupancy; WBCs: white blood cells.
Supplemental Material
Download Zip (1.3 MB)Acknowledgments
DS conceived the study, performed data analysis, and wrote the manuscript. ODJr aided in analysing data, discussion and editing the manuscript.
Disclosure statement
No potential conflicts of interest were disclosed.
Supplementary material
Supplemental data for this article can be accessed online at https://doi.org/10.1080/19420862.2022.2156317
Correction Statement
This article has been corrected with minor changes. These changes do not impact the academic content of the article.
Additional information
Funding
References
- Pardoll DM. The blockade of immune checkpoints in cancer immunotherapy. Nat Rev Cancer. 2012;12(4):252–8. doi:10.1038/NRC3239.
- Liang M, Schwickart M, Schneider AK, Vainshtein I, Del Nagro C, Standifer N, Roskos LK. Receptor occupancy assessment by flow cytometry as a pharmacodynamic biomarker in biopharmaceutical development. Cytometry B Clin Cytom. 2016;90(2):117–27. doi:10.1002/CYTO.B.21259.
- Sternebring O, Alifrangis L, Christensen TF, Ji H, Hegelund AC, Högerkorp CM. A weighted method for estimation of receptor occupancy for pharmacodynamic measurements in drug development. Cytometry B Clin Cytom. 2016;90(2):220–29. doi:10.1002/CYTO.B.21277.
- Freeman GJ, Long AJ, Iwai Y, Bourque K, Chernova T, Nishimura H, Fitz LJ, Malenkovich N, Okazaki T, Byrne MC, et al. Engagement of the PD-1 immunoinhibitory receptor by a novel B7 family member leads to negative regulation of lymphocyte activation. J Exp Med. 2000;192(7):1027–34. doi:10.1084/JEM.192.7.1027.
- Chemnitz JM, Parry RV, Nichols KE, June CH, Riley JL. SHP-1 and SHP-2 associate with immunoreceptor tyrosine-based switch motif of programmed death 1 upon primary human T cell stimulation, but only receptor ligation prevents T cell activation. J Immunol. 2004;173(2):945–54. doi:10.4049/JIMMUNOL.173.2.945.
- Quan L, Chen X, Liu A, Zhang Y, Guo X, Yan S, Liu Y. PD-1 blockade can restore functions of T-cells in epstein-barr virus-positive diffuse large B-Cell lymphoma in vitro. PLoS One. 2015;10(9). doi:10.1371/JOURNAL.PONE.0136476.
- Hazarika M, Chuk MK, Theoret MR, Mushti S, He K, Weis SL, Putman AH, Helms WS, Cao X, Li H, et al. U.S. FDA approval summary: nivolumab for treatment of unresectable or metastatic melanoma following progression on ipilimumab. Clin Cancer Res. 2017;23(14):3484–88. doi:10.1158/1078-0432.CCR-16-0712.
- Kazandjian D, Suzman DL, Blumenthal G, Mushti S, He K, Libeg M, Keegan P, Pazdur R. FDA approval summary: nivolumab for the treatment of metastatic non-small cell lung cancer with progression on or after platinum-based chemotherapy. Oncologist. 2016;21(5):634–42. doi:10.1634/THEONCOLOGIST.2015-0507.
- Xu JX, Maher VE, Zhang L, Tang S, Sridhara R, Ibrahim A, Kim G, Pazdur R. FDA approval summary: nivolumab in advanced renal cell carcinoma after anti-angiogenic therapy and exploratory predictive biomarker analysis. Oncologist. 2017;22(3):311–17. doi:10.1634/THEONCOLOGIST.2016-0476.
- Kasamon YL, de Claro RA, Wang Y, Shen YL, Farrell AT, Pazdur R. FDA approval summary: nivolumab for the treatment of relapsed or progressive classical hodgkin lymphoma. The Oncologist. 2017;22(5):585–91. doi:10.1634/THEONCOLOGIST.2017-0004.
- Agrawal S, Feng Y, Roy A, Kollia G, Lestini B. Nivolumab dose selection: challenges, opportunities, and lessons learned for cancer immunotherapy. Journal for ImmunoTherapy of Cancer. 2016;4(1). doi:10.1186/S40425-016-0177-2.
- OPDIVO (Nivolumab). Label.; 2022. https://www.accessdata.fda.gov/drugsatfda_docs/label/2022/125554s112lbl.pdf.
- Brahmer JR, Drake CG, Wollner I, Powderly JD, Picus J, Sharfman WH, Stankevich E, Pons A, Salay TM, McMiller TL, et al. Phase I study of single-agent anti-programmed death-1 (MDX-1106) in refractory solid tumors: safety, clinical activity, pharmacodynamics, and immunologic correlates. J Clin Oncol. 2010;28(19):3167–75. doi:10.1200/JCO.2009.26.7609.
- OPDIVO (Nivolumab). Assessment Report.; 2015. https://www.ema.europa.eu/en/documents/assessment-report/opdivo-epar-public-assessment-report_en.pdf.
- Topalian SL, Hodi FS, Brahmer JR, Gettinger SN, Smith DC, McDermott DF, Powderly JD, Carvajal RD, Sosman JA, Atkins MB, et al. Safety, activity, and immune correlates of anti-PD-1 antibody in cancer. N Engl J Med. 2012;366(26):2443–54. doi:10.1056/NEJMOA1200690.
- Pluim D, Ros W, Miedema IHC, Beijnen JH, Schellens JHM. Multiparameter flow cytometry assay for quantification of immune cell subsets, PD-1 expression levels and pd-1 receptor occupancy by nivolumab and pembrolizumab. Cytometry A. 2019;95(10):1053–65. doi:10.1002/CYTO.A.23873.
- Awan M, Buriak I, Fleck R, Fuller B, Goltsev A, Kerby J, Lowdell M, Mericka P, Petrenko A, Petrenko Y, et al. Dimethyl sulfoxide: a central player since the Dawn of cryobiology, is efficacy balanced by toxicity? Regen Med. 2020;15(3):1463–91. doi:10.2217/RME-2019-0145.
- Fu J, Wang F, Dong LH, Xing MJ, Cheng X, Wei S, Xu JZ, Han M, Dong K, Song HF. Receptor occupancy measurement of anti-PD-1 antibody drugs in support of clinical trials. Bioanalysis. 2019;11(14):1347–58. doi:10.4155/BIO-2019-0090.
- He X, Xu C. Immune checkpoint signaling and cancer immunotherapy. Cell Res. 2020;30(8):660–69. doi:10.1038/S41422-020-0343-4.
- Yanagihara T, Tanaka K, Matsumoto K. A measuring method for occupancy of immune checkpoint inhibitors in the cell surface. Biochem Biophys Res Commun. 2020;527(1):213–17. doi:10.1016/J.BBRC.2020.04.122.
- Das R, Verma R, Sznol M, Boddupalli CS, Gettinger SN, Kluger H, Callahan M, Wolchok JD, Halaban R, Dhodapkar MV, et al. Combination therapy with anti-CTLA-4 and anti-PD-1 leads to distinct immunologic changes in vivo. J Immunol. 2015;194(3):950–59. doi:10.4049/JIMMUNOL.1401686.
- Vainshtein I, Schneider AK, Sun B, Schwickart M, Roskos LK, Liang M. Multiplexing of receptor occupancy measurements for pharmacodynamic biomarker assessment of biopharmaceuticals. Cytometry B Clin Cytom. 2016;90(2):128–40. doi:10.1002/CYTO.B.21319.
- Powderly J, Spira A, Kondo S, Doi T, Luke JJ, Rasco D, Gao B, Tanner M, Cassier PA, Gazzah A, et al. model informed dosing regimen and phase i results of the anti‐PD‐1 antibody budigalimab (ABBV‐181). Clin Transl Sci. 2021;14(1):277. doi:10.1111/CTS.12855.
- Mo H, Huang J, Xu J, Chen X, Wu D, Qu D, Wang X, Lan B, Wang X, Xu J, et al. Safety, anti-tumour activity, and pharmacokinetics offixed-dose SHR-1210, an anti-PD-1 antibody in advanced solid tumours: adose-escalation, phase 1 study. Br J Cancer. 2018;119(5):538. doi:10.1038/S41416-018-0100-3.
- Advani R, Flinn I, Popplewell L, Forero A, Bartlett NL, Ghosh N, Kline J, Roschewski M, LaCasce A, Collins GP, et al. cd47 blockade by Hu5F9-G4 and Rituximab in Non-Hodgkin’s Lymphoma. N Engl J Med. 2018;379(18):1711–21. doi:10.1056/NEJMOA1807315.
- Chen JY, McKenna KM, Choi TS, Duan J, Brown L, Stewart JJ, Sompalli K, Vyas P, Schrier S, Majeti R, et al. RBC-Specific CD47 Pruning confers protection and underlies the transient anemia in patients treated with anti-CD47 Antibody 5F9. Blood. 2018;132(Supplement 1):2327–2327. doi:10.1182/BLOOD-2018-99-115674.
- Bajaj G, Wang X, Agrawal S, Gupta M, Roy A, Feng Y. Model-based population pharmacokinetic analysis of nivolumab in patients with solid tumors. CPT Pharmacometrics Syst Pharmacol. 2017;6(1):58–66. doi:10.1002/PSP4.12143.
- Bell GI. Models for the specific adhesion of cells to cells. Science. 1978;200(4342):618–27. doi:10.1126/SCIENCE.347575.
- Kaufman EN, Jain RK. Effect of bivalent interaction upon apparent antibody affinity: experimental confirmation of theory using fluorescence photobleaching and implications for antibody binding assays. Cancer Res. 1992;52:4157–67.
- Li K, Cheng X, Tilevik A, Davis SJ, Zhu C. In situ and in silico kinetic analyses of programmed cell death-1 (PD-1) receptor, programmed cell death ligands, and B7-1 protein interaction network. J Biol Chem. 2017;292(16):6799–809. doi:10.1074/JBC.M116.763888.
- Lassman ME, Chappell DL, McAvoy T, Cheng A, de Alwis Dp, Pruitt SK, Laterza OF, Li C, Stoch A, Mayawala K, et al. Experimental Medicine Study to Measure Immune Checkpoint Receptors PD-1 and GITR Turnover Rates In Vivo in Humans.Clin Pharmacol Ther. 2021;109(6):1575–82. doi:10.1002/CPT.2129
- Chapman EH, Kurec AS, Davey FR. Cell volumes of normal and malignant mononuclear cells. J Clin Pathol. 1981;34(10):1083–90. doi:10.1136/JCP.34.10.1083.
- Junker F, Gulati P, Wessels U, Seeber S, Stubenrauch KG, Codarri-Deak L, Markert C, Klein C, Teixeira PC, Kao H. A human receptor occupancy assay to measure anti-PD-1 binding in patients with prior anti-PD-1. Cytometry A. 2021;99(8):832–43. doi:10.1002/CYTO.A.24334.
- Metelkin E. Heta compiler: a software tool for the development of large-scale QSP models and compilation into simulation formats. J Open Source Softw. 2021;6(67):3708. doi:10.21105/JOSS.03708.
- Gizzatkulov NM, Goryanin II, Metelkin EA, Mogilevskaya EA, Peskov KV, Demin OV. DBSolve Optimum: a software package for kinetic modeling which allows dynamic visualization of simulation results. BMC Syst Biol. 2010;4:4. doi:10.1186/1752-0509-4-109.