
ABSTRACT
Hageman factor (FXII) is an essential component in the intrinsic coagulation cascade and a therapeutic target for the prophylactic treatment of hereditary angioedema (HAE). CSL312 (garadacimab) is a novel high-affinity human antibody capable of blocking activated FXII activity that is currently undergoing Phase 3 clinical trials in HAE. Structural studies using hydrogen/deuterium exchange coupled to mass spectrometry revealed evidence of interaction between the antibody and regions surrounding the S1 specificity pocket of FXII, including the 99-loop, 140-loop, 180-loop, and neighboring regions. We propose complementarity-determining regions (CDRs) in heavy-chain CDR2 and CDR3 as potential paratopes on garadacimab, and the 99-loop, 140-loop, 180-loop, and 220-loop as binding sites on the beta chain of activated FXII (β-FXIIa).
Introduction
Hereditary angioedema (HAE) is a rare, potentially life-threatening genetic disorder caused by an underlying deficiency or dysfunction of C1-esterase inhibitors.Citation1,Citation2 Factor XII (Hageman factor, FXII) is the principal initiator of the plasma contact system, which consists of a protease cascade involving the proteins FXII, prekallikrein, and high molecular weight kininogen.Citation3 FXII is synthesized in the liver and circulates in the plasma as a zymogen that becomes an active enzyme (FXIIa) after autoactivation on foreign or biological charged surfaces. This activation is then amplified through a positive feedback loop between pre-kallikrein, kallikrein, and FXIIa, where the C1-esterase inhibitor (C1-INH) functions as the cognate inhibitor and protects against spontaneous activation.Citation4,Citation5 Further proteolytic processing of FXIIa releases the catalytically active fragment β-FXIIa. FXIIa triggers fibrin formation after activation of FXI via the intrinsic coagulation pathway and leads to the production of the proinflammatory mediator bradykinin through the kallikrein-kinin system. Bradykinin production is increased during HAE attacks and is the key mediator of swelling in HAE.Citation6,Citation7 Thus, activated forms of FXII have proinflammatory and procoagulant activities. Garadacimab, a human immunoglobulin G4 (IgG4) monoclonal antibody targeting FXIIa, was generated after the affinity maturation of a parental anti-FXIIa antibody (3F7), which displayed both potent antiinflammatoryCitation8 and antithrombotic activity.Citation9 Garadacimab is currently being investigated in Phase 3 clinical trials for prophylactic treatment of HAE attacks in patients with a C1-INH deficiency (HAE-C1-INH).Citation8,Citation10–12
Hydrogen/deuterium exchange coupled mass spectrometry (HDX-MS) is an emerging analytical approach used to study antibody–antigen interactions in conjunction with complementary surface plasmon resonance (SPR) affinity-based epitope mapping and negative strain/cryogenic electron microscopy (EM).Citation13–15 The technique is especially useful in early phases of drug development when the crystal structures of therapeutic candidates are not readily available.Citation16 HDX-MS utilizes differential footprinting of hydrogen and deuterium incorporation across the amino acid sequence to identify molecular regions with reduced or enhanced solvent accessibility, pinpointing potential binding interfaces and assisting in elucidating the mode of action (MOA) of an antibody used for therapeutic purposes.Citation15 Detection of isotope shifts due to deuterium incorporation is achieved through a combination of nonspecific enzymatic digestion and high-resolution peptide MS.Citation14,Citation17 Given that the technique relies on highly sensitive kinetics of hydrogen-deuterium exchange of the backbone hydrogens, comprehensive HDX-MS studies are typically performed on integrated liquid handling robotics systems that are coupled with online digestion, liquid chromatography, and MS platforms.Citation18–20 A multitude of commercial and in-house platforms have recently been developed specifically for this area of study.Citation20 – 23
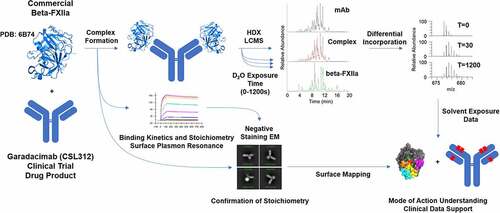
Here, we report an HDX-MS study of garadacimab, human β-FXIIa, and their antibody–antigen complex (study design shown in ). The binding kinetics between garadacimab and β-FXIIaCitation8 used in this study were confirmed and the stoichiometry assessed using an SPR method and negative staining EM. Differential hydrogen/deuterium (H/D) incorporation onto the antibody and antigen in the presence and absence of the complexing protein was mapped against garadacimab complementarity-determining region (CDR) sequences and the known structure of human β-FXIIa when complexed with benzamidine (protein data bank 6B74). The resultant findings from the H/D exchange data were superimposed onto the publicly available crystal structure of human β-FXIIa,Citation24,Citation25 and cross-referenced against computationally derived residue-level solvent accessibility information to further identify potentially key amino acids that could be involved at the interface with garadacimab.Citation26,Citation27
Figure 1. Schematic workflow of hydrogen/deuterium exchange coupled to mass spectrometry (HDX-MS); binding between the antibody (garadacimab) and antigen (β-FXIIa); and confirmation of binding stoichiometry. Garadacimab, β-FXIIa, and the bound complex were individually incubated in deuterated buffer for different exposure times. The differentially deuterated materials were quenched using a low-pH denaturing and reducing cocktail at low temperature. The quenched mixtures were subsequently digested by pepsin. The reduced and digested peptides from varying exposure times were analyzed using liquid chromatography–mass spectrometry (LCMS) and the mass isotopic data were processed to determine the mass shifts indicative of differential deuterium incorporation (or uptake). Formation of the complex and confirmation of complex integrity were guided by surface plasmon resonance binding kinetics and stoichiometry analysis by negative staining electron microscopy. Data interpretation was performed by mapping the exposure of peptide to solvent against the crystal structure of β-FXIIa and complementarity determining region paratope regions according to Kabat numbering.
Results
Characterization of the garadacimab–β-FXIIa complex by negative-staining EM, binding kinetics, and stoichiometry by SPR
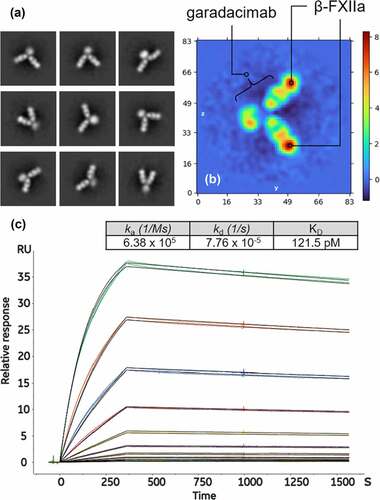
The preformed antibody–antigen complex was characterized using negative staining EM at ×57,000 magnification. Two-dimensional (2D) class averages showed various distinct conformations, highlighting the flexibility of the hinge region;Citation28,Citation29 nevertheless, the two-to-one stoichiometry of β-FXIIa to garadacimab is observed throughout (). Further elucidation by ab initio reconstruction followed by homogeneous refinement produced an enhanced electron density map of the two β-FXIIa moieties bound to the two antigen-binding fragments (Fabs) of the antibody (; further information on ab initio reconstruction and homogeneous refinement of the bound complex is available in Figures S1 and S2). Cross-validation by SPR of the binding kinetics between garadacimab and commercially obtained β-FXIIa demonstrated tight binding with dissociation constant (KD) ranges of ~100–200 pM (), as expected.Citation8 Further analysis of the interaction between β-FXIIa and garadacimab using SPR confirmed a 2:1 stoichiometric ratio (Table S1 and Figure S3 using Supplementary method M1). The stoichiometry data obtained from SPR align well with observations from negative-staining EM.
Figure 2. Negative stain electron microscopy images used to visually confirm the stoichiometry of the garadacimab–β-FXIIa complex. (a) The nine panels show the antigen–antibody complex at different angular views, demonstrating the flexibility of the hinge-stabilized IgG4. The extracted pixel box size shows 84 pixels with a pixel size of 4.48 Å. (b) Real space (central) slices of the 3D reconstruction from the three orthogonal viewing directions. The color gradient shows the relative density of the particle image and the axis scale is in pixels with a pixel size of 4.48 Å. (c) Binding of β-FXIIa to captured garadacimab was determined by surface plasmon resonance. Sensorgrams (colored) and fitted curves (black) for each concentration (10 nM–0.02 nM) are shown. Kinetic rate constants and affinity of the interaction are shown in the inset.
Sequence coverage of garadacimab by HDX-MS footprinting
To characterize garadacimab, a spectral database containing 538 unique peptic peptides corresponding to 97% and 99% sequence coverage for the garadacimab heavy and light chains, respectively, was used to track and compare the H/D exchange isotope patterns from 55 compatible peptic peptides covering relevant CDRs and fragment crystallizable (Fc) regions. Characterization of β-FXIIa was supported by a spectral database containing 270 unique peptic peptides, corresponding to 100% sequence coverage. In total, 128 compatible peptic peptides covering key loops (the N-terminal autolysis loop, 37-loop, 60-loop, 99-loop, 140-loop, 180-loop, and 220-loop) were used for H/D exchange isotope pattern tracking, creating an H/D exchange coverage map of 89% (Figure S4).
Kinetics of deuteration in the CDR of garadacimab
The differential incorporation of deuterium (in units of deuterium) by free and complexed garadacimab is shown in . Detailed analysis of the kinetics of deuteration before and after binding showed that the uptake of deuterium amino acid residues close to the center of the heavy-chain loop, CDR1, between Ser-25 and Gln-35 did not change, whereas loops between Ile-53 and Gly-66 (CDR2) and Leu-100 and Val-118 (CDR3) experienced pronounced reduction in deuterium when complexed with β-FXIIa, specifically from Ile-51 to Tyr-60 and Leu-100 to Ala-115 (). Interestingly, we also observed a minor reduction in deuterium uptake in light-chain CDR2 (data not shown), although this region had not undergone affinity maturation.Citation30,Citation31 Further refinement toward individual amino acid residues was not pursued.
Figure 3. Differential hydrogen/deuterium (H/D) exchange (average relative deuterium) in garadacimab and β-FXIIa at various exposure times (30–1200 seconds). Specific paratopes on (a) garadacimab light chain complementarity determining region (CDR) and (b) garadacimab heavy chain CDR and the expected non-paratopic Fc control region. (c) β-FXIIa with six epitopic regions highlighted (red: histidine residue of the catalytic triad; blue: N-terminus of β-FXIIa; Orange: 99-loop; magenta: autolysis 140-loop; cyan: activation 180-loop; and yellow: 220-loop).
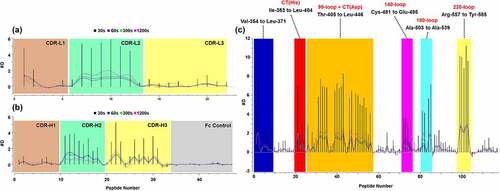
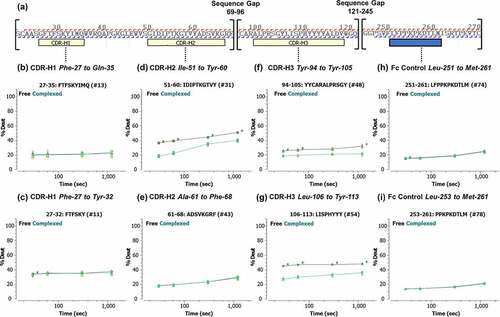
Figure 4. (a) Peptic peptide fragment ion coverage of the heavy chain variable region and the Fc constant heavy region 2 (CH2) constant region. (b–i) Kinetics of the hydrogen/deuterium (H/D) exchange showing the percent of deuterium exchanged as a function of time for selected peptides. Lines are drawn as a guide to the eye (black: free garadacimab; green: complexed garadacimab). Asterisks denote significance of change at the 95% confidence interval. CDR, complementarity determining region.
Dynamics of β-FXIIa upon binding with garadacimab
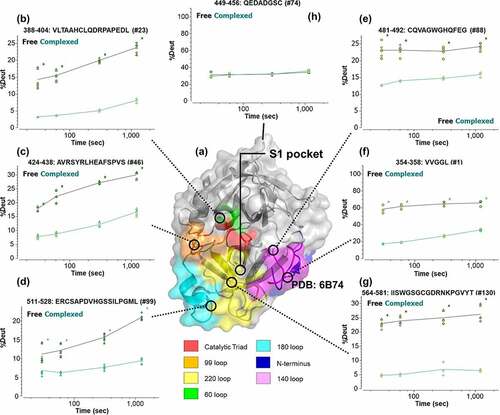
Comparison between the incorporated deuterium (in units of deuterium) in free and complexed β-FXIIa () showed significant changes in the solvent accessibility of the N-terminus, 60-loop, 99-loop, 140-loop, 180-loop, and 220-loop. Different kinetics of deuteration were most pronounced in peptides covering the valine-rich N-terminus (, panel F), 99-loop (, panel C), and 180-loop (, panel D), where ~40%, ~25%, and ~30% reduction, respectively, in H/D exchange was observed. This was followed by the 140-loop (, panel E) and 220-loop (, panel G) where deuteration differences of ~15% were estimated between the free and complexed forms. Structurally, the proximity of the catalytic triad encapsulating the 99-loop, 140-loop, and 220-loop and extending toward 180-loop showed a likely continuum of residues that may be solvent-protected upon binding. These results suggest that the most relevant solvent protection was from residue Thr-390 to His-393 and in 99-loop from Ser-435 to Asp-442 (which contains the catalytic triad residues His and Asp).Citation24,Citation25 The stretch of 180-loop from Leu-533 to Ala-539 was also equally relevant given its proximity to the final catalytic triad residue Ser-544.
Figure 5. (a) Mapping of hydrogen/deuterium (H/D) exchange on regions of β-FXIIa (structure based on X-ray crystallography).Citation24 Separate epitopic regions on β-FXIIa based on HDX-MS data are highlighted (red: catalytic triad; blue: N-terminus of β-FXIIa; green: 60-loop, Orange: 99-loop; magenta: autolysis 140-loop; cyan: activation 180-loop; and yellow: 220-loop). Additional designation of the S1 pocket is shown to demonstrate potential blocking of substrate entry. (b–g) Corresponding kinetics of H/D exchange in β-FXIIa via selected peptides covering denoted epitopic regions. (h) Solvent-exposed 110-loop (as negative control), showing no significant difference in deuterium uptake. Lines are drawn as a guide to the eye (black: free β-FXIIa; green: complexed β-FXIIa). Asterisks denote significance of change at the 95% confidence interval.
VADAR residue refinement within loop regions highlighted by HDX-MS of β-FXIIa
To improve the limited resolution of overlapping peptide data by HDX-MS of β-FXIIa, we sought to identify high fractional side-chain accessible surface area (side-ASA) residues around key regions identified by HDX-MS having reduced H/D exchange upon complexing with garadacimab. Using volume area dihedral angle reporter (VADAR)-computed surface accessibility of individual amino acid residues from the benzamidine complexed β-FXIIa X-ray crystal coordinates (protein data bank 6B74),Citation24 63 residues with a side-ASA of ≥50% were identified.Citation26 There were 16 specific residues in β-FXIIa that coincided with regions identified as having reduced H/D exchange upon complexing with garadacimab (). The goal of this analysis was to computationally refine and identify the likely solvent-exposed amino acid residues (high side-ASA) on the valine-rich N-terminus, 99-loop, 140-loop, 180-loop, and 220-loop, all of which were found to have reduced H/D exchange. It was interesting to note that, although we observed a noticeable reduction in H/D exchange on the 60-loop, VADAR computational analysis did not reveal amino acid residues with high side-ASA.
Figure 6. Sequence alignment and mapping of the hydrogen/deuterium (H/D) exchange data and volume area dihedral angle reporter (VADAR) analysis (with side-accessibility surface area [side-ASA] of ≥50%) on regions of β-FXIIa. VADAR analyses were computed using X-ray crystallography coordinates from the protein data bank.Citation24 Red boxes denote regions identified by HDX-MS data while bolded text denotes surface-exposed residues (from VADAR analysis). Various surface loops and termini with notable reduction in H/D uptake (N-terminus, 60-loop, 99-loop, 140-loop, 180-loop, and 220-loop) are shown. Asterisks denote the position of the catalytic triad His-Asp-Ser on β-FXIIa.
![Figure 6. Sequence alignment and mapping of the hydrogen/deuterium (H/D) exchange data and volume area dihedral angle reporter (VADAR) analysis (with side-accessibility surface area [side-ASA] of ≥50%) on regions of β-FXIIa. VADAR analyses were computed using X-ray crystallography coordinates from the protein data bank.Citation24 Red boxes denote regions identified by HDX-MS data while bolded text denotes surface-exposed residues (from VADAR analysis). Various surface loops and termini with notable reduction in H/D uptake (N-terminus, 60-loop, 99-loop, 140-loop, 180-loop, and 220-loop) are shown. Asterisks denote the position of the catalytic triad His-Asp-Ser on β-FXIIa.](/cms/asset/27596e24-1e2e-4bd3-a5c5-ae66b37f5092/kmab_a_2163459_f0006_oc.jpg)
Discussion
To better understand the garadacimab MOA that provides therapeutic treatment of HAE attacks in patients with HAE-C1-INH,Citation10 we performed a combined structural analysis based on negative stain EM, SPR, and HDX-MS to identify critical FXIIa epitopes and their cognate garadacimab paratopes.
Closer examination of the deuterium uptake in garadacimab CDR pre- and post-binding confirms the involvement of the affinity-matured residues from heavy-chain Ile-53 to Tyr-60.Citation30 This provides a much-needed validation of affinity-maturation efforts from the parental antibody 3F7. Perhaps unsurprising was the expected involvement of the heavy-chain loop CDR3 containing a high number of tyrosine residues.Citation32,Citation33 The pronounced reduction in deuterium uptake post binding by residues of His-110 to Ala-115 (His-Tyr-Tyr-Tyr-Tyr-Ala), a sequence containing a high number of aromatic amino acids, suggests that these may be additional paratopes against β-FXIIa.Citation33 Finally, we noted that, although we saw a reduction in deuterium uptake on the residues in light-chain CDR2, it is unlikely to be a driver for binding. We speculate that the observed differences may be related to allosteric changes post binding.Citation34
The observed reduction in solvent accessibility across multiple-exposed surface loops near the specificity (S1) pocketCitation24 of β-FXIIa by HDX-MS was perhaps the most interesting finding of this study. Fundamentally, it was reassuring to find these loops aggregating near the entrance of the S1 pocket, given that the observed functional silencing of β-FXIIa activity must indicate some means of it allosterically blocking its own self-amplifying cascade. Mapping these regions against the crystal structure of β-FXIIaCitation24 convincingly demonstrates that the converging contact points toward the S1 pocket, specifically the proximity of the surface-adjoining 140-loop to 220-loop, then toward the 180-loop and 99-loop (, panels C, D, E, and G). When coupled with VADAR-derived side-ASA predictions, we were able to putatively identify, at least computationally, amino acids along the loop regions (of β-FXIIa) with high side-ASA that may be involved in the interfacial binding with garadacimab. The additional computational analysis adds significant value to the interpretation of our data since the HDX-MS findings could not provide sufficient resolution to suggest the potential contact residues on β-FXIIa. Specifically, it was most interesting that Pro-436 and Val-437 on the 99-loop and Ser-569 and Gly-570 on the 220-loop around the S1 pocket were identified as residues with high side-ASA. When taken collectively, the current results suggest that garadacimab may function as a “lid” obstructing the catalytic pocket entrance.
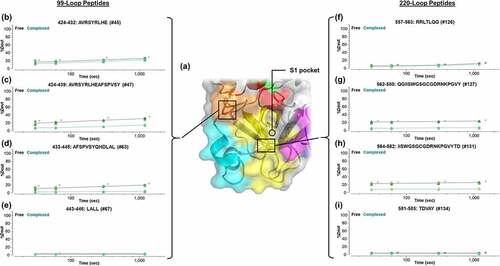
We were able to further corroborate these findings based on an additional localization analysis performed using overlapping peptic peptides (experimentally pinpointing residues SPVS on the 99-loop and IISWGSGCGDRNKPGVY on the 220-loop; ). It is important to note that we have not considered the changes in conformation of both antigen and antibody that are likely to occur upon binding.Citation34–36 Although such studies are outside the scope of this report, we anticipate that high-resolution single-particle cryo-EM should guide understanding of those molecular dynamics.Citation13,Citation37
Figure 7. Localization of the epitope region specific to the entrance to the S1 substrate pocket via the 99-loop and 220-loop through the utilization of overlapping peptic peptides. (a) Correlation with the X-ray crystallography-based structure of β-FXIIa.Citation24 Kinetics of deuteration are shown in (b–e) for the 99-loop region and (f–i) for the 220-loop. Lines are drawn as a guide to the eye (black: free β-FXIIa; green: complexed β-FXIIa). Asterisks denote significance of change at the 95% confidence interval.
Through the HDX-MS approach, our results provide early indications of relevant paratopes and epitopes on garadacimab and β-FXIIa. The aggregated solvent-accessibility map modeled onto the crystal data is convincing given the proximity of residues exhibiting high deuterium uptake to the S1 pocket entry, 99-loop, and 220-loop, providing, for the first time, structural evidence of the antibody-based blocking of FXIIa. Findings from our study lead to an improved understanding of the MOA for garadacimab, validating its observed preclinical and clinical efficacy in the reduction of HAE attacks.Citation8,Citation10,Citation12 The studies also demonstrate that the solvent-accessibility approach, accomplished using HDX-MS complemented by SPR and EM, is a valuable tool to study protein binding in antigen/antibody complexes, particularly when the crystal structures are not immediately available.Citation16
Materials and methods
Protein materials
CSL312 GMP4 DP (garadacimab, lot 5314003AB2, CSL) and human FXIIa beta-chain (β-FXIIa; lot HFXIIAB-5395, Molecular Innovations) were acquired through either in-house production (CSL recombinant product development) or commercial sources (Molecular Innovations). Proteins were stored at −80°C and retrieved for processing on the day of the experiment. Proteins were allowed to thaw to room temperature for at least 1 hour before handling.
Reagents and chemicals
Deuterated water (D2O, 99.96%, PN: 423459–1ML), Trizma® base (PN: T1503), Trizma® HCl (PN: T3253), 8 M urea in water (PN: 51457–100ML), and lyophilized bovine serum albumin (PN: A9418) were purchased from Sigma-Aldrich. Tris (2-carboxyethyl) phosphine-HCl (TCEP-HCl; PN: 20490B) was purchased from Pierce™ Thermo Fisher Scientific. Formic acid (min. 97.5%, PN: 56302) was from Honeywell Research Chemicals. Liquid chromatography–MS (LCMS)-grade acetonitrile (PN: 1.00029.2500) and LCMS-grade water (PN: 1.15333.2500) were from Merck. EDTA (PN: EL022-500 G) and Tween-20/PS-20 (PN TL020-500 M) were purchased from ChemSupply. HEPES (PN: HEPES05) was purchased from Formedium.
Complex formation between antibody and antigen
Formation of complexed antibody (garadacimab) and antigen (β-FXIIa) was achieved by incubating the antibody and antigen via a predefined 1:2 antibody to antigen stoichiometry (empirically confirmed by SPR) under physiological pH (7.4). The complexes were then incubated at 25°C for a further 30 minutes before further analysis.
Negative stain EM
Garadacimab and the activated FXII beta-chain protein were complexed in a 1:2 ratio immediately before negative staining. Samples were diluted in mouse tonicity Tris-buffered saline (10 mM Tris, 140 mM NaCl, pH 7.0) to a final concentration of 4.9 µM. EM data collection was performed at the Ian Holmes Imaging Center at the Bio21 Molecular Science and Biotechnology Institute, University of Melbourne, Australia. Carbon-coated Cu grids (GSCU400CC, 400-mesh) were glow-discharged at 15 mA for 30 seconds. Sample was diluted 10× in the same buffer, and 10 µL was deposited onto the grid with the excess sample blotted off (with Whatman® No. 1 filter paper) after 60 seconds. The grids were then negatively stained with two consecutive droplets (10 µL) of 2% phosphotungstic acid (pH 6.8) for 30 seconds, blotted to remove residual stain, and air dried. The grids were imaged at room temperature using transmission EM (Talos L120C, 120 kV) at a magnification of ×57,000 with a pixel size of 4.88 Å. All images (.tif) were converted to “mrc” files using the EMAN2 python script (e2proc2d).Citation38 Thirty MRC files were imported into cryoSPARC v3.312Citation38 using the following input parameters: pixel size 4.48 Å; accelerating voltage 120 kV; spherical aberration 2.7 mm, and negative stain. Patch CTF, followed by “blob picking” (150–250 Å), “inspect particle picks,” and “extract particle picks” (84-pixel box size) rendered 23,446 particles for 2D classification. Selection of representative 2D class averages enabled template-based automatic particle picking (diameter 250 Å), which resulted in 16,689 particles after an additional two rounds of 2D classification to further remove junk particles.
SPR analysis
Binding kinetics were measured using a Biacore® 8 K+ SPR Biosensor (Cytiva) docked with a Series S CM5 sensor chip (Cytiva). Anti-human IgG Fc (Thermo Fisher, Catalog No.: H10500) was immobilized using standard amine coupling chemistry to ~15,000 response units. Garadacimab was captured on active flow cells at the beginning of each cycle to a surface density of ~250 response units. Flow cell 1, in which no garadacimab was captured, was used as a reference. Recombinant β-FXIIa was injected over both flow cells for 350 seconds at concentrations between 0.02 nM and 10 nM and dissociation was monitored for 1200 seconds. A buffer blank was used for referencing purposes. After each cycle, the surface was regenerated with a 45-seconds injection of 100 mM H3PO4. The analysis was performed at 37°C at a flow rate of 30 µL/min in 10 mM HEPES, 150 mM NaCl, 3 mM EDTA, 0.005% v/v surfactant P20 supplemented with 0.1% bovine serum albumin and adjusted to pH 7.4. Biacore Insight Evaluation software v3.0.12.15655 (Cytiva) was used to fit double-referenced sensorgrams to a 1:1 kinetics model including a term for mass transport limitation.Citation39 The Rmax value was fitted locally to account for slight deviations in the level of garadacimab captured. The association rate (ka), dissociation rate (kd), and equilibrium (KD) were fitted globally.
Automated H/D exchange and online pepsin digestion
Up to 10 µg of antibody (total volume 1–2 µL), antigen, or antibody–antigen complex were treated equally using an automated liquid handling and reaction system (LEAP PAL-RTC platform); scheduling of reactions and valve routing was performed via Chronos software v4.9 (PAL Systems) with temperature-controlled syringe and auto-sampler systems (both held at 3°C). Pre-dispensed proteins (1 µL for antibody or antigen; 2 µL for antibody–antigen complex) were mixed with deuterated Tris buffer (10 mM Tris and 140 mM NaCl in D2O; pH 7.4) to approximately 90% D2O final volume and allowed to react for fixed periods of time (t = 0, 30, 60, 300, and 1200 seconds) at 3°C.
For each time point, 45 µL reacted sample was transferred to a pre-dispensed sample vial containing 15 µL quench solution (8 M urea, 4% formic acid, and 0.125 M TCEP), mixed, and subsequently injected into a three-valve flow routing system for online pepsin enzymatic digestion on an enzyme-immobilized column (Waters Enzymate™ BEH Pepsin, 2.1 × 30 mm, 5 µm). Digestion was performed in 0.1% formic acid at 9°C with a flow rate of 50 µL/min and a total 4-minute digestion wait time. Peptides leaving the pepsin column were passed through a desalting pre-column (see next section), which was subsequently regenerated using three repeats of 2 M urea washes (55 µL).
Measurements of deuterated peptides by LCMS
Up to 10 µg quenched deuterated digest was passed through a trap-elute reverse phase liquid chromatography (RPLC) system consisting of a desalting pre-column (Waters BEH-C18, 2.1 × 5 mm, 1.7 µm, 130 Å) and an analytical column (Waters BEH-C18, 2.1 × 50 mm, 1.7 µm, 130 Å). Column temperature was held constant at 0–1°C using a built-in Peltier cooling system. The trap-elute RPLC program consisted of a 2-minute desalting step (100% Buffer A, 50 µL/min) followed by a 15-minute linear separation gradient (1–40% Buffer B, 45 µL/min). Buffer A was 0.1 v/v% formic acid in Milli-Q water and buffer B was 0.1 v/v% formic acid in acetonitrile. The method includes a further 5-minute column washing and conditioning, with a total run time of 20 minutes. The separated peptides were detected using an electrospray (Ion Max NG HESI ion source) coupled to an Orbitrap Fusion Lumos (Thermo Fisher). The capillary voltage was set at 4.6 kV. The deuterated peptides were detected at a resolution of 60,000 for a mass range of 300–1600 m/z.
Experimental replicates and significance of the kinetics of deuteration
All the measurements described above were repeated to create a triplicate dataset (n = 3). Evaluation of significance from the differential kinetics of deuteration was intrinsic to the study of garadacimab via the measurement of pre-/post binding along the Fc section of the molecule (between Phe-270 and Val-271, and Ile-386 and Leu-407, containing the solvent-exposed Met-261 and the Asn-Gly motif at Asn-393) as these regions were not expected to interact with β-FXIIa. The significant difference between the free and the complexed state was determined to be ±0.15 units of deuterium at a 99.7% confidence interval (3× standard deviation; Figures S5 and S6), indicating that a differential uptake of ≤0.15 units of deuterium was not considered significant.Citation40 This value was therefore used to evaluate the significance of the subsequent deuterium kinetics datasets. The average hydrogen back-exchange was assessed using maximally labeled cytochrome C model protein as per the guidance white paper,Citation40 and determined to be ~36% (see Supplementary methods M2 and M3, Figure S7 for additional detail).Citation19,Citation40,Citation41
Peptic peptide mapping
Initial protein sequence mapping for the antibody, antigen, and antibody–antigen complex by LCMS was performed using the platform described previously but without the use of deuterium, i.e., all samples were exposed to H2O only (non-deuterated protein samples). Detection of peptic peptides by MS also includes an additional data-dependent MS step, where the top 12 precursors per scan between charges 2 and 6 were selected for MS/MS (set at a resolution of 15,000, an automatic gain control of 1 × 10⁵ ions, and a maximum injection time of 120 ms). The resulting accurate mass and retention time information were used for subsequent deuterated peptide analysis.
Peptic peptide mapping: data analysis
MS data from non-deuterated protein samples were processed using Byos™ v3.80 (Protein Metrics). Peptide searches were performed using the Byonic™ search engine module using an initial C-term criterion of Phe, Tyr, Trp, and Leu followed by an expanded nonspecific cleavage search with five allowed missed cleavages.Citation42 All searches were performed using a general mass accuracy limit of 10 ppm for parent and 0.05 Da for MS/MS fragment masses. The post-processing minimum score cutoff for peptides was set to 400, and the minimal peptide length was four amino acids. The retention time (apex time) was automatically extracted and determined by the Byologic™ module and a final filtered peptide list was exported for further processing.
VADAR analysis
Computational analysis of surface accessibility was performed using the VADAR v1.8 algorithm to estimate the surface accessibility of individual amino acid residues in β-FXIIa.Citation27 Structural coordinates were taken from the publicly available X-ray crystal structure for benzamidine-complexed β-FXIIa.Citation24 Amino acid residues with a computed fractional side-ASA ≥50% were considered as surface exposed (Table S2). These surface-exposed residues were then cross-referenced with available HDX-MS data to assist with the identification of potential epitope-related residues.Citation26
HDX-MS data processing
Exported lists of peptides from protein sequencing mapping were used as the basis for deuterated sample processing. Processing was performed using HDExaminer™ (Sierra Analytics, CA, USA) using the FASTA database for antibody and antigen separately.Citation43 Raw data were parsed semi-automatically using predefined settings for bottom-up LCMS and the definition of deuteration at t = 0, 30, 60, 300, and 1200 seconds at 90% D2O. Charge states were set initially by those found by peptide search and expanded to a min–max of 1–4. Retention time reference was anchored to t = 0. Filtering of fit was initially performed using an automatic cutoff of ≤0.7 as low confidence and ≥0.9 as high confidence. All fits between 0.7 and 0.9 were manually reviewed. All the processed data were mapped using preloaded (1) heat map data/image, (2) peptide plot data/image, (3) peptide pool result, (4) uptake summary table, (5) uptake plot, and (6) deuteration comparison plots from HDExaminer™.
Abbreviations
2D, Two-dimensional; C1-INH, C1-esterase inhibitor; CDR, Complementarity determining region; EM, Electron microscopy; Fc, fragment crystallizable; FXII, Hageman factor; FXIIa, activated FXII; HAE, Hereditary angioedema; H/D, hydrogen/deuterium; HDX-MS, Hydrogen/deuterium exchange coupled to mass spectrometry; Ig, immunoglobulin; LCMS, liquid chromatography–mass spectrometry; MS, Mass spectrometry; MOA, Mechanism of action; RPLC, Reverse phase liquid chromatography; side-ASA, side-accessibility surface area SPR, Surface plasmon resonance; TCEP, Tris (2-carboxyethyl) phosphine; VADAR, Volume area dihedral angle reporter.
Supplemental Material
Download MS Word (1.9 MB)Acknowledgments
The authors thank Robert Ninnis for the conceptualization and initial development of the HDX-MS platform used in this study. The authors also thank Eric Hanssen and Andrew Leis from the Bio21 Ian Holmes Imaging Centre for the support of the negative stain EM experiments.
Disclosure statement
SYO is an associate director for research in CSL Limited. EAK and JS are senior research scientists in CSL Limited. VT and AZ are research scientists in CSL Limited. CP is a senior director for research in CSL Limited. MJW is a vice president for research in CSL Limited. ADN is the chief scientific officer in CSL Limited. MP is a senior director for research in CSL Limited.
SYO, EAK, VT, AZ, and JS participated in the research concept, design, performance of experiments, data analysis, and writing of the article. CP, MJW, ADN, and MP participated in the research concept, design of the experiment, and writing of the article. MJW, JS, and ADN hold patent number EP2548892A1 in the European Patent Application.
Supplementary material
Supplemental data for this article can be accessed online at https://doi.org/10.1080/19420862.2022.2163459
Correction Statement
This article has been corrected with minor changes. These changes do not impact the academic content of the article.
Additional information
Funding
References
- Bork K. Pasteurized C1 inhibitor concentrate in hereditary angioedema: pharmacology, safety, efficacy and future directions. Expert Rev Clin Immunol. 2008;4:13–10. doi:10.1586/1744666X.4.1.13.
- Gower RG, Busse PJ, Aygören-Pürsün E, Barakat AJ, Caballero T, Davis-Lorton M, Farkas H, Hurewitz DS, Jacobs JS, Johnston DT, et al. Hereditary angioedema caused by c1-esterase inhibitor deficiency: a literature-based analysis and clinical commentary on prophylaxis treatment strategies. World Allergy Organ J. 2011;4:S9–s21. doi:10.1186/1939-4551-4-S2-S9.
- Schmaier AH, Emsley J, Feener EP, Gailani D, Govers-Riemslag JWP, Kaplan AP, Maas C, Morrissey JH, Renné T, Sidelmann JJ, et al. Nomenclature of factor XI and the contact system. J Thromb Haemost. 2019;17:2216–19. doi:10.1111/jth.14595.
- de Maat S, Maas C. Factor XII: form determines function. J Thromb Haemost. 2016;14:1498–506. doi:10.1111/jth.13383.
- Renné T, Schmaier AH, Nickel KF, Blombäck M, Maas C. In vivo roles of factor XII. Blood. 2012;120:4296–303. doi:10.1182/blood-2012-07-292094.
- Nussberger J, Cugno M, Amstutz C, Cicardi M, Pellacani A, Agostoni A. Plasma bradykinin in angio-oedema. Lancet. 1998;351:1693–97. doi:10.1016/S0140-6736(97)09137-X.
- Nussberger J, Cugno M, Cicardi M, Agostoni A. Local bradykinin generation in hereditary angioedema. J Allergy Clin Immunol. 1999;104:1321–22. doi:10.1016/S0091-6749(99)70030-8.
- Cao H, Biondo M, Lioe H, Busfield S, Rayzman V, Nieswandt B, Bork K, Harrison LC, Auyeung P, Farkas H, et al. Antibody-mediated inhibition of FXIIa blocks downstream bradykinin generation. J Allergy Clin Immunol. 2018;142:1355–58. doi:10.1016/j.jaci.2018.06.014.
- Larsson M, Rayzman V, Nolte MW, Nickel KF, Björkqvist J, Jämsä A, Hardy MP, Fries M, Schmidbauer S, Hedenqvist P, et al. A factor XIIa inhibitory antibody provides thromboprotection in extracorporeal circulation without increasing bleeding risk. Sci Transl Med. 2014;6:222ra217. doi:10.1126/scitranslmed.3006804.
- Craig T, Magerl M, Levy DS, Reshef A, Lumry WR, Martinez-Saguer I, Jacobs JS, Yang WH, Ritchie B, Aygören-Pürsün E, et al. Prophylactic use of an anti-activated factor XII monoclonal antibody, garadacimab, for patients with C1-esterase inhibitor-deficient hereditary angioedema: a randomised, double-blind, placebo-controlled, phase 2 trial. Lancet. 2022;399:945–55. doi:10.1016/S0140-6736(21)02225-X.
- https://clinicaltrials.gov/ct2/show/record/NCT04739059. Long-term safety and efficacy of CSL312 (Garadacimab) in the prophylactic treatment of hereditary angioedema attacks (clinicalTrials.gov identifier: NCT04739059). U.S. National Library of Medicine, Last accessed: 10 May 2022.
- Pawaskar D, Chen X, Glassman F, May F, Roberts A, Biondo M, McKenzie A, Nolte MW, Jusko WJ, Tortorici M. Pharmacokinetic/pharmacodynamic modeling for dose selection for the first-in-human trial of the activated Factor XII inhibitor garadacimab (CSL312). Clin Transl Sci. 2022;15:709–20. doi:10.1111/cts.13192.
- Engen JR, Komives EA. Complementarity of hydrogen/deuterium exchange mass spectrometry and cryo-electron microscopy. Trends Biochem Sci. 2020;45:906–18. doi:10.1016/j.tibs.2020.05.005.
- Englander SW. Hydrogen exchange and mass spectrometry: a historical perspective. J Am Soc Mass Spectrom. 2006;17:1481–89. doi:10.1016/j.jasms.2006.06.006.
- Masson GR, Jenkins ML, Burke JE. An overview of hydrogen deuterium exchange mass spectrometry (HDX-MS) in drug discovery. Expert Opin Drug Discov. 2017;12:981–94. doi:10.1080/17460441.2017.1363734.
- Puchades C, Kűkrer B, Diefenbach O, Sneekes-Vriese E, Juraszek J, Koudstaal W, Apetri A. Epitope mapping of diverse influenza Hemagglutinin drug candidates using HDX-MS. Sci Rep. 2019;9:4735. doi:10.1038/s41598-019-41179-0.
- Wales TE, Eggertson MJ, Engen JR. Considerations in the analysis of hydrogen exchange mass spectrometry data. Methods Mol Biol. 2013;1007:263–88.
- Chalmers MJ, Busby SA, Pascal BD, He Y, Hendrickson CL, Marshall AG, Griffin PR. Probing protein ligand interactions by automated hydrogen/deuterium exchange mass spectrometry. Anal Chem. 2006;78:1005–14. doi:10.1021/ac051294f.
- Hamuro Y. Determination of equine cytochrome c backbone amide hydrogen/deuterium exchange rates by mass spectrometry using a wider time window and isotope envelope. J Am Soc Mass Spectrom. 2017;28:486–97. doi:10.1007/s13361-016-1571-1.
- Hamuro Y, Coales SJ. Optimization of feasibility stage for hydrogen/deuterium exchange mass spectrometry. J Am Soc Mass Spectrom. 2018;29:623–29. doi:10.1007/s13361-017-1860-3.
- Cummins DJ, Espada A, Novick SJ, Molina-Martin M, Stites RE, Espinosa JF, Broughton H, Goswami D, Pascal BD, Dodge JA, et al. Two-site evaluation of the repeatability and precision of an automated dual-column hydrogen/deuterium exchange mass spectrometry platform. Anal Chem. 2016;88:6607–14. doi:10.1021/acs.analchem.6b01650.
- Espada A, Haro R, Castañon J, Sayago C, Perez-Cozar F, Cano L, Redero P, Molina-Martin M, Broughton H, Stites RE, et al. A decoupled automation platform for hydrogen/deuterium exchange mass spectrometry experiments. J Am Soc Mass Spectrom. 2019;30:2580–83. doi:10.1007/s13361-019-02331-2.
- Watson MJ, Harkewicz R, Hodge EA, Vorauer C, Palmer J, Lee KK, Guttman M. Simple platform for automating decoupled LC-MS analysis of hydrogen/deuterium exchange samples. J Am Soc Mass Spectrom. 2021;32:597–600. doi:10.1021/jasms.0c00341.
- Dementiev A, Silva A, Yee C, Li Z, Flavin MT, Sham H, Partridge JR. Structures of human plasma β-factor XIIa cocrystallized with potent inhibitors. Blood Adv. 2018;2:549–58. doi:10.1182/bloodadvances.2018016337.
- Pathak M, Wilmann P, Awford J, Li C, Hamad BK, Fischer PM, Dreveny I, Dekker LV, Emsley J. Coagulation factor XII protease domain crystal structure. J Thromb Haemost. 2015;13:580–91. doi:10.1111/jth.12849.
- Ständer SR, Grauslund L, Scarselli M, Norais N, Rand K. Epitope mapping of polyclonal antibodies by hydrogen–deuterium exchange mass spectrometry (HDX-MS). Anal Chem. 2021;93:11669–78. doi:10.1021/acs.analchem.1c00696.
- Willard L, Ranjan A, Zhang H, Monzavi H, Boyko RF, Sykes BD, Wishart DS. VADAR: a web server for quantitative evaluation of protein structure quality. Nucleic Acids Res. 2003;31:3316–19. doi:10.1093/nar/gkg565.
- Davies AM, Sutton BJ. Human IgG4: a structural perspective. Immunol Rev. 2015;268:139–59. doi:10.1111/imr.12349.
- Handlogten MW, Peng L, Christian EA, Xu W, Lin S, Venkat R, Dall’Acqua W, Ahuja S. Prevention of Fab-arm exchange and antibody reduction via stabilization of the IgG4 hinge region. MAbs. 2020;12:1779974. doi:10.1080/19420862.2020.1779974.
- Panousis C, Rayzman V, Nash A, Wilson M, Schmidbauer S, Nolte M. Inhibitory anti-Factor XII/XIIa monoclonal Antibodies and their uses (Patent Number: EP2548892A1). European Patent Office: CSL Behring GmbH, 2011.
- Worm M, Köhler EC, Panda R, Long A, Butler LM, Stavrou EX, Nickel KF, Fuchs TA, Renné T. The factor XIIa blocking antibody 3F7: a safe anticoagulant with anti-inflammatory activities. Ann Transl Med. 2015;3:247–247. doi:10.3978/j.2305-5839.2015.09.07.
- D’Angelo S, Ferrara F, Naranjo L, Erasmus MF, Hraber P, Bradbury ARM. Many routes to an antibody heavy-chain CDR3: necessary, yet insufficient, for specific binding. Front Immunol. 2018;9. doi:10.3389/fimmu.2018.00395.
- Peng HP, Lee KH, Jian JW, Yang AS. Origins of specificity and affinity in antibody-protein interactions. Proc Natl Acad Sci U S A. 2014;111:E2656–2665. doi:10.1073/pnas.1401131111.
- Keskin O. Binding induced conformational changes of proteins correlate with their intrinsic fluctuations: a case study of antibodies. BMC Struct Biol. 2007;7:31. doi:10.1186/1472-6807-7-31.
- Al Qaraghuli MM, Kubiak-Ossowska K, Ferro VA, Mulheran PA. Antibody-protein binding and conformational changes: identifying allosteric signalling pathways to engineer a better effector response. Sci Rep. 2020;10:13696. doi:10.1038/s41598-020-70680-0.
- Sela-Culang I, Alon S, Ofran Y. A systematic comparison of free and bound antibodies reveals binding-related conformational changes. J Immunol. 2012;189:4890–99. doi:10.4049/jimmunol.1201493.
- Long F, Fong RH, Austin SK, Chen Z, Klose T, Fokine A, Liu Y, Porta J, Sapparapu G, Akahata W, et al. Cryo-EM structures elucidate neutralizing mechanisms of anti-chikungunya human monoclonal antibodies with therapeutic activity. Proc Natl Acad Sci U S A. 2015;112:13898–903. doi:10.1073/pnas.1515558112.
- Punjani A, Rubinstein JL, Fleet DJ, Brubaker MA. cryoSPARC: algorithms for rapid unsupervised cryo-EM structure determination. Nat Methods. 2017;14:290–96. doi:10.1038/nmeth.4169.
- Perspicace S, Banner D, Benz J, Müller F, Schlatter D, Huber W. Fragment-based screening using surface plasmon resonance technology. J Biomol Screen. 2009;14:337–49. doi:10.1177/1087057109332595.
- Masson GR, Burke JE, Ahn NG, Anand GS, Borchers C, Brier S, Bou-Assaf GM, Engen JR, Englander SW, Faber J, et al. Recommendations for performing, interpreting and reporting hydrogen deuterium exchange mass spectrometry (HDX-MS) experiments. Nat Methods. 2019;16:595–602. doi:10.1038/s41592-019-0459-y.
- Walters BT, Ricciuti A, Mayne L, Englander SW. Minimizing back exchange in the hydrogen exchange-mass spectrometry experiment. J Am Soc Mass Spectrom. 2012;23:2132–39. doi:10.1007/s13361-012-0476-x.
- Bern M, Kil YJ, Becker C. Byonic: advanced peptide and protein identification software. Curr Protoc Bioinformatics. 2012;40: Chapter 13:Unit13.20. doi:10.1002/0471250953.bi1320s40.
- Hamuro Y, Coales SJ, Southern MR, Nemeth-Cawley JF, Stranz DD, Griffin PR. Rapid analysis of protein structure and dynamics by hydrogen/deuterium exchange mass spectrometry. J Biomol Tech. 2003;14:171–82.