
 ?Mathematical formulae have been encoded as MathML and are displayed in this HTML version using MathJax in order to improve their display. Uncheck the box to turn MathJax off. This feature requires Javascript. Click on a formula to zoom.
ABSTRACT
Bispecific antibodies, including bispecific IgG, are emerging as an important new class of antibody therapeutics. As a result, we, as well as others, have developed engineering strategies designed to facilitate the efficient production of bispecific IgG for clinical development. For example, we have extensively used knobs-into-holes (KIH) mutations to facilitate the heterodimerization of antibody heavy chains and more recently Fab mutations to promote cognate heavy/light chain pairing for efficient in vivo assembly of bispecific IgG in single host cells. A panel of related monospecific and bispecific IgG1 antibodies was constructed and assessed for immunogenicity risk by comparison with benchmark antibodies with known low (Avastin and Herceptin) or high (bococizumab and ATR-107) clinical incidence of anti-drug antibodies. Assay methods used include dendritic cell internalization, T cell proliferation, and T cell epitope identification by in silico prediction and MHC-associated peptide proteomics. Data from each method were considered independently and then together for an overall integrated immunogenicity risk assessment. In toto, these data suggest that the KIH mutations and in vitro assembly of half antibodies do not represent a major risk for immunogenicity of bispecific IgG1, nor do the Fab mutations used for efficient in vivo assembly of bispecifics in single host cells. Comparable or slightly higher immunogenicity risk assessment data were obtained for research-grade preparations of trastuzumab and bevacizumab versus Herceptin and Avastin, respectively. These data provide experimental support for the common practice of using research-grade preparations of IgG1 as surrogates for immunogenicity risk assessment of their corresponding pharmaceutical counterparts.
Introduction
Bispecific antibodies are coming of age as therapeutics, with 14 bispecifics approved and marketed as of May 2024 for therapeutic settings that include oncology, hematology, ophthalmology, autoimmunity and chronic inflammation.Citation1 Bispecific antibodies are complex proteins and often highly engineered to tailor properties, including antigen-binding specificity, affinity and valency, spatial geometry of binding sites, molecular weight, pharmacokinetics and effector functions.Citation2 We and other groups have commonly adopted IgG-based formats for bispecifics to incorporate Fc-associated functions, including the potential for long serum half-life and immune effector functions, with the additional benefit of permitting protein A affinity chromatography. Several different creative antibody engineering strategies have been developed to facilitate the efficient production of bispecific IgG, including in single-host cells as reviewed elsewhere.Citation3 For example, we and our collaborators have extensively used KIH Fc mutations for facilitating heavy chain (HC) heterodimerization,Citation4–6 in conjunction with in vitro assembly of half antibodiesCitation7 for preparing bispecific IgG for clinical development. In addition to the KIH Fc mutations, we recently used Fab mutations to promote cognate pairing of HC and light chains (LC) for the efficient in vivo assembly of bispecific IgG in single host cells.Citation8
A priori, the sequence complexity of many bispecific antibodies and their novel formats, which are typically not seen in nature, may pose an immunogenicity risk in patients. In practice, the incidence of anti-drug antibodies (ADAs) reported for bispecific antibodies has varied greatly from minimal to occurring in all treated human subjects. The corresponding clinical sequelae have ranged from none to severe. For example, ADAs were observed for all 12 patients treated with the bispecific antibody, LY3415244 (anti-TIM-3/PD-L1), leading to anaphylaxis in two patients and early termination of the clinical study.Citation9 Similarly, all healthy volunteers treated with the bispecific antibody, JNJ-61178104 (anti-TNFα/IL-17A) developed ADAs.Citation10 In contrast, a low incidence of ADAs has been reported for some bispecific antibodies. For example, a 1% and 5.1% incidence of ADAs have been reported for the approved IgG bispecifics amivantamabCitation11 and emicizumab,Citation12 respectively. Such highly variable incidence and clinical consequence of ADAs from bispecific antibodies provide a strong rationale to assess and mitigate immunogenicity risk preclinically as early as during the bispecific antibody design and optimization stages.Citation13,Citation14 Indeed, this was done for emicizumab,Citation15 which may have contributed to the low rate of ADAs for this bispecific IgG4.Citation12
The success with emicizumab notwithstanding, immunogenicity risk assessment remains highly challenging because immunogenicity is influenced by a large number of product-, patient- and treatment-related factors, including disease indication.Citation16 A growing suite of potentially complementary in silico, in vitro and ex vivo experimental methods is being used to model and predict clinical immunogenicity risk of antibody and other protein therapeutics.Citation17–19 These risk assessment methods typically involve head-to-head comparison of therapeutic candidates with multiple benchmark proteins with known incidence of clinical ADAs.Citation20 Many of these methods focus on different aspects of T cell-dependent generation of ADAs, reflecting the key role of T cells in developing a mature antibody response, including variable domain somatic hypermutation and immunoglobulin class-switching.Citation21 Experimental B cell epitope mapping is sometimes possible for ADAs in clinical samples,Citation22 but this approach is feasible only when such samples are available, which was not the case for our study. Alternatively, B cell epitopes can be predicted in silico. However, recent studies have demonstrated that currently available B cell epitope prediction tools perform very poorly,Citation23,Citation24 and so they were not used in this study.
Previously, Cohen et al. characterized the immunogenic responses toward a KIH-containing bispecific IgG4,Citation25 where a high incidence of ADAs had been observed in the clinic.Citation26 This integrated study used a combination of in silico prediction of T cell epitopes, ex vivo assays and an in vivo study in non-human primates. A follow-up study using epitope mapping showed that the ADAs target the complementarity-determining regions (CDRs) from both arms.Citation27 These data in toto suggest that the high observed rate of clinical ADAs relate to the specific Fab arms of the bispecific rather than the KIH mutations per se.
Here, we investigated the immunogenicity risk posed by different bispecific antibody technologies by constructing a panel of monospecific and bispecific IgG1 variants based upon two approved antibodies known to have low incidence of ADAs in patients, namely Avastin (anti-VEGF, 0.6% ADAs)Citation28 and Herceptin (anti-HER2, 7.1–10% ADAs).Citation29,Citation30 Specifically, we studied the impact of KIH mutationsCitation4 and in vitro assembly of half IgG1 antibodies,Citation7 as well as Fab mutationsCitation8 used to facilitate the preferential pairing of cognate HC and LC. The use of low ADA building blocks in constructing the bispecific antibody panel was anticipated to allow for more ready detection of any contribution from the bispecific antibody technologies (see above) to any positive signal observed in the immunogenicity assays.
Additionally, we assessed the risk of immunogenicity for a KIH-containing, one-armed aglycosylated antibody (onartuzumab, anti-MET)Citation31 that had a low incidence of ADAs (14%) in Phase 1 and 2 clinical trials.Citation32,Citation33 Our high ADA benchmark antibodies were: 1) monospecific anti-proprotein convertase subtilisin/kexin type nine (PCSK9) antibody, bococizumab, associated with a high incidence of ADAs (48%) in multiple Phase 3 clinical trials,Citation34 and 2) anti-IL-21 R antibody, ATR-107, with a high incidence of ADAs (76%) in a Phase 1 clinical trial.Citation35
A tacit assumption in the immunogenicity field is that research-grade antibodies are useful surrogates for pharmaceutical preparations for immunogenicity risk assessment. However, there is little if any published data, to our knowledge, to support this assumption. Moreover, the numerous differences in the production, purification, characterization, impurity profile, formulation, and storage of research-grade versus pharmaceutical-grade antibodies might confound this assumption. Here, we directly tested the assumption by direct side-by-side comparisons of pharmaceutical antibody preparations, namely Herceptin and Avastin with their research-grade counterparts, trastuzumab and bevacizumab, respectively.
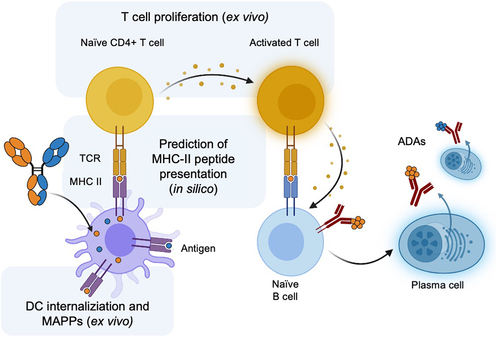
Several different computational and experimental methods were used to assess the immunogenicity risk of the monospecific and bispecific antibody panel related to specific steps in the pathway of antigen-processing through to ADA generation by plasma cells (). The three steps and selected assays are as follows: 1) antigen-presenting cells (APCs) such as dendritic cells (DCs) process the protein therapeutic, which can be interrogated by a DC internalization assay,Citation36 2) APCs present the processed peptides through class II major histocompatibility complex (MHC-II), which can be modeled by in silico prediction of peptide presentation by MHC-IICitation37 and experimentally evaluated by MHC-associated peptide proteomics (MAPPs),Citation38,Citation39 and 3) the MHC-II complex recruits and activates T cells, which can be assessed by ex vivo methods such as T cell activationCitation40 or proliferation.Citation41
Figure 1. Overview of the key steps in the generation of a T cell-dependent ADA response to a protein therapeutic such as a bispecific antibody (shown). Methods used in this study to evaluate the immunogenicity risk of monospecific and bispecific antibodies are highlighted: in silico prediction of peptides presented by MHC-II, DC internalization, T cell proliferation and MAPPs. This figure was adapted from “Anti-drug antibodies (ADA) Immunogenicity Assessment” by BioRender.com (2024). Retrieved from https://app.biorender.com/biorender-templates.
Results
Design of monospecific and bispecific IgG1 panel for immunogenicity risk assessment
A panel of monospecific and bispecific antibodies was designed and generated to assess the immunogenicity risk from different bispecific IgG technologies (, Table S1). We first assessed whether research-grade antibodies might be useful surrogates for their pharmaceutical-grade counterparts for immunogenicity risk assessment. Specifically, bevacizumab and trastuzumab were expressed and purified using two chromatography steps (protein A followed by size-exclusion chromatography (SEC)) and compared to their corresponding pharmaceutical preparations, Avastin and Herceptin, respectively. Next, the KIH mutations (T366W and T366S:L368A:Y407V)Citation4 for efficient HC heterodimerization were assessed in monospecific trastuzumab and bevacizumab variants expressed using two host cellCitation7 and one host cellCitation8 mammalian production methods. This was undertaken to assess the impact of KIH mutations and in vitro or in vivo IgG1 assembly processes on immunogenicity risk assessment. A trastuzumab/bevacizumab (Tras/Bev) KIH bispecific IgG1 was generated using two-cell production and in vitro assembly. Additionally, Tras/Bev IgG1 bispecific antibodies were generated in a one-cell production system using Fab mutationsCitation8 to facilitate cognate HC/LC pairing. All monospecific and bispecific antibody preparations were predominantly (98%) monomeric species as judged by analytical SEC and contained only low levels of endotoxin (≤0.13 endotoxin units/mg) (Table S2).
Table 1. Panel of monospecific and bispecific IgG1 variants of trastuzumab and bevacizumab. n/a, not applicable; –, no mutations; Fc KIH mutations4: knob: T366W; hole: T366S:L368A:Y407V; Fab mutations8: EKKE: VH Q39E CH1 S183K/VL Q38K CL V133E; KEEK: VH Q39K CH1 S183E/VL Q38E CL V133K; Research-grade (R) purified by protein A and SEC; pharmaceutical-grade (P): commercial product.
The panel of monospecific and bispecific antibodies () was assessed for immunogenicity risk using a suite of in silico and ex vivo methods () as described below. The initial set of bispecific antibodies involved pairing two parent antibodies with low immunogenicity. Two additional bispecific antibodies were constructed in order to evaluate pairing the variable domains of a highly immunogenic antibody (ATR-107 or bococizumab) with variable domains from a weakly immunogenic antibody (bevacizumab) to generate ATR-107/Bev and Boco/Bev bispecifics. Additionally, we evaluated onartuzumab, a one-armed monospecific antibody containing KIH mutations with a low incidence of ADAs reported in clinical trials.Citation32,Citation33
DC internalization to assess immunogenicity risk
As a first ex vivo experimental assessment of immunogenicity risk, we used a previously reported DC internalization assay.Citation36 This assay was used to recapitulate an early step in ADA generation, namely, internalization of the protein therapeutic by APCs such as DCs. Previous studies revealed a correlation between a DC internalization index and an increased risk of immunogenicity in a panel of tested antibodies.Citation36
The monospecific and bispecific antibody variants () were evaluated using the same panel of human cell donors (n = 10). Research-grade bevacizumab and trastuzumab had comparable DC internalization indices compared to their pharmaceutical counterparts, Avastin and Herceptin, respectively. All Tras/Bev bispecifics showed significantly lower DC internalization than the high ADA benchmark, bococizumab (p = 0.002). Indeed, DC internalization for the Tras/Bev bispecifics was more similar to Avastin, the benchmark antibody for low immunogenicity ().
Figure 2. DC internalization assay for immunogenicity risk assessment. The DC internalization index was calculated for each sample: median fluorescence intensity (MFI) total stain – MFI external stain. Samples analyzed include (a) monospecific and bispecific Tras/Bev variants, along with their corresponding research-grade or pharmaceutical-grade parental antibodies (10 human donors), (b) bispecific antibodies containing ATR-107 and bococizumab arms paired with bevacizumab (10 human donors), and (c) the clinical-stage one-armed antibody, onartuzumab (11 human donors). Different donors were used in each panel. The median and interquartile range are overlaid on the donor data points (black bars). The P-values (Wilcoxon matched-pairs signed rank test) from pairwise comparisons are shown: ns: not significant, p > 0.05; ** : p ≤0.01; and *** : p ≤0.001.
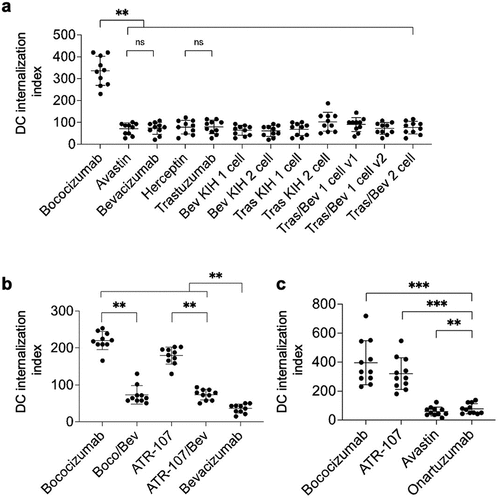
For the second panel of bispecifics, ATR-107/Bev and Boco/Bev showed intermediate DC internalization indices that were significantly different from the high immunogenicity monospecific antibodies, ATR-107 and bococizumab, and the low immunogenicity monospecific parent, bevacizumab (p = 0.002 for all) (). Finally, in the last panel of antibodies, onartuzumab had a low DC internalization index that was significantly lower than the bococizumab (p = 0.001) and ATR-107 (p = 0.001) high ADA benchmarks, although it was also significantly higher than the low ADA benchmark antibody Avastin (p = 0.004) ().
In summary, the test antibodies containing Fc KIH and Fab charge-pair mutations () and the one-armed antibody onartuzumab () have relatively low DC internalization indices that are much closer to the Avastin low ADA benchmark than either the bococizumab or ATR-107 high ADA benchmarks.
T cell proliferation to assess immunogenicity risk
The immunogenicity potential of the monospecific and bispecific antibody panel () was next assessed using a peripheral blood mononuclear cells (PBMC)-based CD4+ T cell proliferation assay. PBMCs from a large panel of healthy donors (n = 72) presenting a diverse set of MHC-II (also known as HLA-II, human leukocyte antigen, class II) encoding alleles (Table S3) with an approximately similar genotype distribution of DRB1 alleles as the world population (Figure S1) were stimulated with the panel of test proteins and controls. CD4+ T cell proliferation was monitored with bromodeoxyuridine (BrdU) incorporation by flow cytometry after 7 d of stimulation. T cell proliferation data are reported here as the stimulation index (SI), as well as the percentage of positive donors relative to the Avastin low ADA benchmark as defined in .
Figure 3. Ex vivo BrdU-based T cell proliferation assay for immunogenicity risk assessment. Human donor-derived PBMCs (n = 72) were co-cultured with (a, b) monospecific and bispecific Tras/Bev antibodies, research-grade or pharmaceutical-grade parental antibodies, (c, d) high ADA monospecific antibodies, ATR-107 and bococizumab, compared to their respective bispecific antibodies with bevacizumab, and (e, f) clinical-grade onartuzumab. (a, c, e) Stimulation index (SI) is defined here as the ratio of the percentage of treated BrdU+CD4+CD3+ T cells to untreated BrdU+CD4+CD3+ T cells. Blue and open circles represent donors that were positive or negative, respectively, in response to KLH, and all donors were used for the following calculations. The median and interquartile range are overlaid on the donor data points (black bars). The P-values from pairwise comparisons (Wilcoxon matched-pairs signed rank test) are shown: ns: not significant, p > 0.05; ** : p ≤0.01; *** : p ≤0.001; and **** : p ≤0.0001. (b, d, f) Shown is the percentage of positive donors out of total number of donors for each sample. A positive response is defined here by using a cut-point value corresponding to the 95% quantile of the SI measurements of Avastin (reference antibody with low incidence of clinical ADAs). Donors with a SI greater than this cut-point are considered positive donors. The P-values (Fisher’s exact test) are shown: ns: not significant and **** : p ≤0.0001.
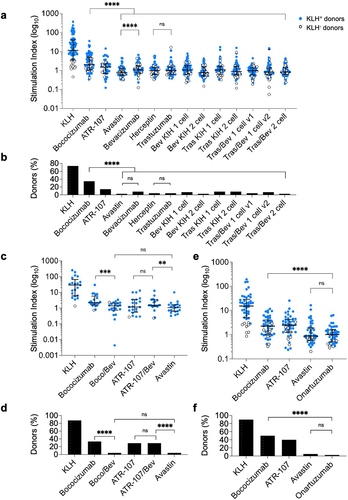
The T cell proliferation response to research-grade bevacizumab was significantly higher than for Avastin (p < 0.0001), yet still low compared to bococizumab and overall interpreted to have low response (), with no significant difference in the percentage of positive donors (). In contrast, research-grade trastuzumab and pharmaceutical-grade Herceptin were both very low and not significantly different in their T cell responses (). The test monospecific and bispecific antibodies were positive in only 2.8–8.3% of donors, whereas bococizumab induced a positive response in 35% of donors (). Additionally, the T cell response for all Tras/Bev bispecific antibodies was significantly lower than bococizumab (p < 0.0001).
For the second panel, the SI for the Boco/Bev bispecific antibody was slightly lower than for bococizumab. Additionally, the Boco/Bev bispecific had a comparable and not significantly different SI to Avastin (). In contrast, the SI for the ATR-107/Bev bispecific was not significantly different to ATR-107, but was significantly higher than for Avastin (p = 0.007). Finally, the clinical stage one-armed KIH antibody, onartuzumab, exhibited a low T cell proliferation SI, which was not significantly different from the Avastin low ADA benchmark ().
Overall, the T cell proliferation data for the antibody panel () is much more similar to the low than high ADA benchmarks.
In silico prediction of T cell epitopes
Next, we attempted to identify T cell epitopes by in silico prediction, experimental determination by MAPPs and then combining these two orthogonal methods. The entire sequences (Table S1) of the antibody panel () were examined in silico using the tool, NetMHCIIpan-4.0.Citation37 Nine-mer peptide-binding cores predicted to be presented on more than one of the nine common HLA-DR alleles (i.e., promiscuous epitopes),Citation37 were selected for further analysis. To identify potential T cell immunogenic epitopes less likely to be subject to self-tolerance, we excluded promiscuous epitopes that were identical to nine-mer peptides derived from the human proteomeCitation42 or were very common in the observed antibody space (OAS) repertoire.Citation43–45 Potential immunogenic T cell epitopes were predicted for each antibody tested ().
Table 2. Prediction of immunogenic T cell epitopes using in silico tools and MAPPs. In silico prediction of potential immunogenic T cell epitopes was undertaken using NetMHCIIpan-4.0.37 The total number of epitopes shown are based on predicted presentation (percentile rank ≤ 10%) to nine common HLA-DR alleles. Promiscuous epitopes that were not found in the human proteome or prevalent in the OAS43, 44 were considered potential immunogenic T cell epitopes. Also shown are the number of predicted T cell epitopes that overlap with MAPPs peptide clusters from .
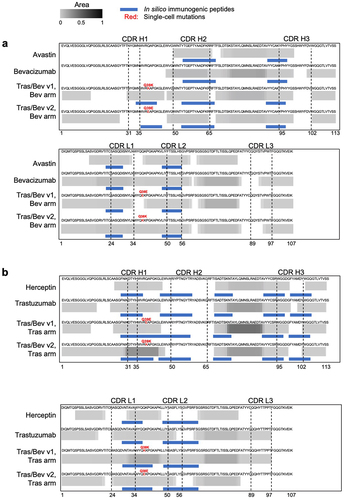
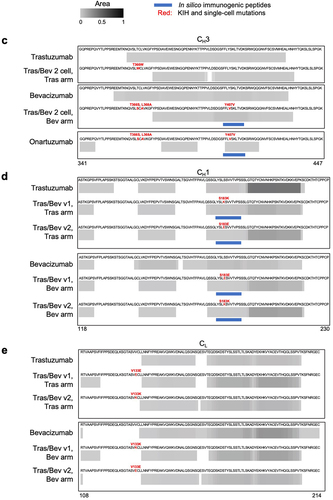
Figure 4. MAPPs peptide spectrum matches (PSMs) and in silico immunogenic predictions for (a) the variable domains of pharmaceutical-grade and research-grade bevacizumab, plus the bevacizumab arm of bispecifics with one-cell mutations, (b) the variable domains of pharmaceutical-grade and research-grade trastuzumab, plus the trastuzumab arm of bispecifics with one-cell mutations, (c) CH3 domain of antibodies including trastuzumab with and without the knob mutation; bevacizumab with and without hole mutations, and onartuzumab with the hole mutations, (d) CH1 domain of trastuzumab and bevacizumab compared to their respective arms with one-cell mutations, and (e) CL domain of trastuzumab and bevacizumab compared to their respective arms with one-cell mutations. Peptide clusters detected across 10 human donors for each antibody by MAPPs were collapsed into a single composite heatmap. The heatmap is scaled by area, which is normalized by dividing it by the maximum area among all antibody therapeutics within the corresponding panel. Solid blue bars represent regions of each molecule identified by NetMHCIIpan 4.0 EL to be immunogenic. The immunogenic regions contain one or more nine-mer peptides that are predicted to bind two or more common HLA-DR alleles (percentile rank ≤ 10%), with no matches in the human proteome, and are observed in < 93% of individuals in the OAS. CDR boundaries are labeled with Kabat numbering.Citation61 the following point mutations are highlighted (red) VL Q38E and Q38K, CL V133E and V133K, VH Q39E and Q39K, CH1 S183E and S183K, and CH3 T366W (knob); plus T366S, L368A and Y407V (hole).
Surprisingly, one of the low ADA benchmark antibodies, Herceptin, was predicted to have almost as many potential T cell epitopes (n = 10) as the much more immunogenic high ADA benchmarks, ATR-107 and bococizumab (n = 11 for both). Most strikingly, all of the different Tras/Bev bispecific antibodies were predicted to have much higher numbers of T cell epitopes (n = 19–28) than their monospecific parental counterparts or the monospecific antibody high ADA benchmarks, bococizumab and ATR-107. This difference likely reflects the presence of greater sequence diversity for the bispecifics versus the monospecifics with four and two different antibody chains, respectively.
In summary, under the conditions tested in silico epitope prediction using NetMHCIIpan-4.0 has limited capacity as a standalone tool to discriminate between low and high ADA benchmarks. Additionally, the in silico tool alone predicts many more epitopes for all bispecifics than seen for even the high ADA monospecific antibody benchmarks.
MAPPs to identify T cell epitopes
Next, we used MAPPs to identify potential immunogenic T cell epitopes for the monospecific and bispecific antibodies (). We focused on peptide clusters presented by HLA-DR, and quantified their signal by mass spectrometry. The objective was to 1) evaluate low and high ADA benchmarks, 2) compare research- and pharmaceutical-grade antibodies, 3) assess potential T cell epitopes resulting from the KIH Fc and Fab one-cell mutations, and 4) evaluate bispecifics combining high and low immunogenic arms.
As expected, fewer peptide clusters were observed for the low ADA benchmark Avastin (n = 16) compared to high ADA benchmarks bococizumab (n = 31) and ATR-107 (n = 28) (Table S4, Figures S2 and S3). In comparisons between research and pharmaceutical-grade proteins, we observed broadly overlapping peptide clusters in the variable domains, but with more peptide spectrum matches (PSM) and greater sequence coverage for the research-grade antibodies (). This increase in the number of PSMs was not due to differences in the levels of amino acid side chain modification (Met oxidation, Asn and Gln deamidation plus Cys carbamidomethylation), which were found to be similar (data not shown). Next, we assessed the constant and variable domains together, and again found more peptide clusters in the research-grade antibodies (Figure S3a-d and Table S4). However, the additional clusters are located mainly in the constant domains and likely tolerized. Moreover, the immunogenicity risk appears to be low, as these additional clusters were observed in only 1 or 2 of the 10 donors tested and solely for the research material.
The KIH mutations were assessed and no MAPPs peptides were identified for the knob mutation (T366W), nor for two of the three hole mutations (T366S and L368A) for the Tras/Bev 2 cell bispecific and onartuzumab (). One of the hole mutations (Y407V) was found in MAPPs peptides for the Tras/Bev 2 cell bispecific antibody, as well as for the low ADA molecule, onartuzumab (). We also used MAPPs to assess potential T cell epitopes resulting from Fab one-cell mutations and assembly. MAPPs of the Tras/Bev bispecifics assembled in two-cell or one-cell ( and Figure S4) showed similar peptide clusters in both the bevacizumab (n = 20–24) and trastuzumab arms (n = 20–23). Overall, Tras/Bev v2 bispecific antibody had fewer peptide clusters and donors encompassing these mutations than the Tras/Bev v1 bispecific antibody.
Figure 4. (Continued).
For the ATR-107/Bev bispecific, a similar number of peptide clusters were detected for both the ATR-107 and bevacizumab arms. Similarly, the Boco/Bev bispecific antibody had a similar number of peptide clusters for bococizumab and bevacizumab arms (Figures S5 and S6, Table S4). Unexpectedly, the arm expected to be more immunogenic (bococizumab and ATR-107) had fewer clusters than bevacizumab, which had more constant domain clusters. Few peptide clusters were detected for the clinical grade onartuzumab, similar to the Avastin low ADA benchmark. Most clusters were observed in the constant domains, which are likely tolerized epitopes as they are self-peptides.Citation21
In summary, research and pharmaceutical-grade antibodies have overlapping MAPPs results, albeit with a higher number of PSMs identified in research-grade antibodies. For the KIH mutations, only one of the hole mutations (Y407V) was present in MAPPs peptides for the Tras/Bev 2 cell bispecific antibody, which was also observed with onartuzumab, a molecule associated with low clinical ADAs.Citation32,Citation33 Thus, the presence of the Y407V mutation does not necessarily lead to high ADA risk. Additionally, we identified clusters that include the one-cell mutations, with fewer found in v2 compared to v1. A significant number of peptide clusters identified by MAPPs, including for Avastin and Herceptin, were found in parental constant domains that do not contain mutations (Figure S3). Such peptides seem unlikely to be major drivers of immunogenicity because of immune tolerance to self-peptides.Citation21
Identification of potential immunogenic T cell epitopes in MAPPs peptide clusters
In silico analysis was applied to all MAPPs peptides to identify those peptides with the highest risk of being immunogenic. Specifically, the MAPPs peptides and donor-specific HLA-DR alleles were used as input into NetMHCIIpan-4.0 to determine the most likely nine-mer peptide-binding core within each MAPPs peptide. To exclude binding cores that would likely be subject to self-tolerance, we removed human nine-mer peptides using the same methods used in the in silico analysis above. We hypothesized that epitopes found both in silico and in MAPPs would have a higher likelihood of being immunogenic, so we calculated the number of overlapping epitopes between the two orthogonal methods ().
Avastin, one of the low ADA benchmarks, had a lower number of overlapping epitopes (n = 5) than the high ADA benchmarks, ATR-107 (n = 9) and bococizumab (n = 11). Herceptin (n = 2) and onartuzumab (n = 1) had the smallest number of predicted overlapping epitopes. This appears consistent with the molecules having relatively low incidences of clinical ADAs. For the comparison of research- and pharmaceutical-grade antibodies, the MAPPs peptide clusters were broadly overlapping, but more extensive for the research-grade antibodies (bevacizumab and trastuzumab) than their pharmaceutical-grade counterparts (Avastin and Herceptin, respectively) (). However, in silico analysis of these MAPPs peptides suggests that predicted immunogenic T cell epitopes () are only marginally higher for bevacizumab (n = 6) than for Avastin (n = 5) and for trastuzumab (n = 3) than for Herceptin (n = 2).
We then compared the epitopes found in the parental monospecific molecules to those found in the arms of their bispecific counterparts. As expected, the monospecific and bispecific antibodies shared many potential T cell epitopes, the majority of which were located in their variable domains (). The bispecific antibodies had many more epitopes than their parental counterparts (), and these epitopes overlapped with the Fab mutations used for single-cell assembly of bispecific IgG1 () and one of the KIH mutations ().
When examining the KIH mutations in the CH3 domains (), the knob mutation (T366W) and two of the three hole mutations (T366S and L368A) were not observed by MAPPs nor predicted to be immunogenic by the in silico model. The third hole mutation (Y407V) was predicted to be immunogenic and overlapped with low-intensity epitopes by MAPPs for both the Bev arm of Tras/Bev 2 cell, as well as onartuzumab. For the one-cell variants, VH Q39K and VL Q38K in both the bevacizumab and trastuzumab arms, and VH Q39E and VL Q38E for the trastuzumab arms were detected by MAPPs and were predicted to be potentially immunogenic by in silico analysis (). In contrast, for the bevacizumab arm, the VH Q39E mutation was not predicted to be immunogenic nor was it detected by MAPPs, and the VL Q38E mutation was predicted by in silico but not detected by MAPPs (). The one-cell mutations located in the CH1 domain overlap with MAPPs observations and also the in silico prediction (). In contrast, the one-cell mutations located in the CL domain overlap with neither the MAPPs data nor the in silico prediction ().
In summary, orthogonal analysis of peptide clusters observed in MAPPs by in silico prediction can help filter and identify potentially immunogenic epitopes. A lower number of overlapping T cell epitopes were observed for proteins with low incidence of ADAs (Avastin, Herceptin, and onartuzumab) by both analyses, whereas more overlapping epitopes were observed for proteins with high incidence of ADAs (bococizumab and ATR-107) (). Analysis of potential immunogenic T cell epitopes in MAPPs peptide clusters suggest only very minor differences between research-grade antibodies and their pharmaceutical-grade counterparts.
Integrated immunogenicity risk assessment
Next, we tried to integrate T cell epitope prediction from the in silico MAPPs output with the results from DC and T cell assays. We hypothesized that such an integrated approach has the potential to provide a more reliable assessment of immunogenicity risk than any single method. We defined criteria for low, intermediate, and high immunogenicity risk for DC internalization and T cell proliferation assays, and T cell epitope prediction based upon the performance of the low (Avastin) and high ADA (bococizumab) benchmarks (Table S5, S6, and see Materials and Methods).
Applying these criteria, we then assigned an overall immunogenicity risk for each molecule that considered scores from each of the three methods (). Onartuzumab scores as low risk overall, which seems consistent with the observed rate of clinical ADAs (14%).Citation32,Citation33 The 1-cell and 2-cell Tras/Bev bispecific antibodies () scored as intermediate and low risk, respectively ().
Table 3. Integrated immunogenicity risk assessment analysis for monospecific, bispecific, and one-armed antibody panel compared to clinical ADA rates. Data for DC internalization, T cell proliferation, and predicted immunogenic T cell epitopes from MAPPs and in silico were tabulated and then binned for low, intermediate, or high immunogenicity risk by comparison with Avastin and bococizumab ADA benchmarks (Table S5 and S6). For example, 5 and 11 immunogenic T cell epitopes were predicted for Avastin and bococizumab MAPPs peptides, respectively (). The thresholds for immunogenicity risk for immunogenic T cell epitopes were set as: low risk (n = 1–6), intermediate risk (n = 7–9) and high risk (n ≥ 10). See Materials and Methods for details of how thresholds were set for the DC and T cell assays. The combined immunogenicity prediction was assigned as follows: low risk if low for ≥2 individual methods with no high risk, intermediate risk if low risk for ≥1 methods and high risk for ≤1 method and high risk if high for ≥2 methods. n/a, not available.
Discussion
Integrated immunogenicity risk assessment
In this study, we conducted an immunogenicity risk assessment of a panel of monospecific and bispecific antibodies () using multiple different methods (): internalization by DCs, induction of T cell proliferation, and T cell epitope identification by in silico prediction in conjunction with MAPPs.
One of the key comparisons made here was between the research-grade antibodies trastuzumab and bevacizumab and the pharmaceutical-grade counterparts, Herceptin and Avastin. Data presented here suggest that research-grade antibodies may give similar or slightly higher signals in some immunogenicity risk assessment assays than their pharmaceutical-grade counterparts (). This provides at least some support for the common practice of using research-grade antibodies as surrogates for their clinical counterparts in immunogenicity risk assessment. Nevertheless, the use of research-grade antibodies may lead to some false-positive immunogenicity risk prediction, albeit with apparently less likelihood of false-negative prediction. More such side-by-side comparisons of research-grade and pharmaceutical-grade proteins are desirable to further test the validity of an assumption upon which immunogenicity risk assessment is built. Ideally, such comparisons would include commonly used formats such as IgG antibodies, as well as more complex formats such as bispecific and multispecific antibodies including ones with high incidence of ADAs. The addition of many more benchmark molecules with low, intermediate, and high ADAs may improve the integrated immunogenicity risk assessment attempted here.
Streamlining immunogenicity risk assessment
As mentioned previously, and extensively reviewed elsewhere,Citation17,Citation19 each method used has inherent limitations that may lead to false-positive or negative predictions. For example, T cell epitopes detected by MAPPs include parental constant domain sequences that seem likely to be tolerized as self-peptides,Citation21 i.e., false positives. Applying in silico T cell epitope prediction to MAPPs peptides may help identify those peptides that are more likely to be immunogenic (). MAPPs and in silico prediction are orthogonal and potentially complementary methods for immunogenic T cell epitope identification that warrant further testing together.
The integrated immunogenicity risk assessment strategy developed here is both time and resource intensive. This begs the question: How can this process be streamlined to facilitate antibody therapeutic identification and optimization? Here, we offer some approaches to addressing this complex question, but we are fully aware that many other options exist. Indeed, the preferred approaches will vary with the methods and resources available to individual drug developers, as well as the panel of the candidate antibody therapeutics to be tested and perhaps the underlying biology of the target.
In silico prediction of T cell epitopes is fast and readily scaled to large numbers of sequences, and requires no protein, albeit with significant risk of over prediction.Citation46 The use of in silico prediction of T cell epitopes at the antibody design phase appears worthy of further exploration. For example, in antibody humanization, T cell epitope prediction might be used to prioritize which humanized variants to generate and characterize.
Efficient internalization of a protein therapeutic by APCs such as DCs may be a necessary but not sufficient step for eliciting a high ADA response in patients. This notion appears consistent with the five antibodies evaluated in this study for which there is clinical ADA data (), plus additional examples given in a previous publication,Citation36 as well as data from Wen et al. from a related DC internalization assay.Citation47 Nevertheless, this hypothesis requires much more extensive testing with a broad range of protein-based therapeutics.
T cell proliferation was undertaken here with a large number of donors (n = 72) to increase confidence in comparisons between different molecules. More typically, 10–40 donors are used for T cell activation or proliferation assays.Citation48 The use of fewer donors represents a significant resource saving and may be sufficient at least for initial screening. Modifications of these T cell assays may be needed for immunogenicity risk assessment of immunomodulators, including T cell-dependent bispecific antibodies.
MAPPsCitation38,Citation39 is the most resource intensive of the methods used here. Application by others will likely require consideration of when and how best to use this powerful technology. Potentially a tiered approach could be taken to immunogenicity risk, starting with in silico tools and relatively high throughput ex vivo assays, such as DC internalizationCitation36 and T cell activationCitation20,Citation40 or proliferation.Citation41 In our experience, therapeutic candidates are sometimes identified at this stage with immunogenicity risk similar to the low ADA benchmarks, indicating that these candidates may be suitable to advance further in preclinical and clinical development. MAPPs is potentially most valuable as a second-tier assay in conjunction with in silico to identify immunogenic T cell epitopes that behave more like high than low ADA benchmarks.Citation39,Citation49–51 This can provide a powerful starting point for a deimmunization strategy in which putative immunogenic T cell epitopes are first identified and then engineered out by site-directed mutagenesis.Citation22
Strategies to reduce the immunogenicity risk of bispecific IgG
Self-aggregation has been found to correlate with immunogenicity through increased DC internalization, processing, and presentation, or even direct activation of B cells.Citation52,Citation53 Engineering of bococizumab to improve its biophysical properties, including less self-aggregation, reduced its immunogenicity risk as judged by preclinical assays.Citation54 Designing bispecific antibodies from monospecific antibodies with favorable developability propertiesCitation55,Citation56 seems desirable, including to potentially attenuate immunogenicity risk.
An alternative and orthogonal strategy to reduce the immunogenicity risk for bispecific IgG is to simplify the design of these complex molecules by reducing or eliminating the number of different antibody chains and obviating the need for mutations to facilitate the desired chain pairings. The efficient in vivo assembly of bispecific IgG1 antibodies was first demonstrated by us over 25 years ago using a common LC in conjunction with KIH mutations for HC heterodimerization.Citation5 A common LC was utilized in the design of emicizumab,Citation15 thereby reducing the number of different component chains from four down to three (two HC and one LC) and obviating the need for Fab mutations to direct cognate HC/LC pairing. The low incidence of ADAs for emicizumab observed in patientsCitation12 may reflect in part the use of a common LC, as well as removal of T cell epitopes during sequence optimization (deimmunization) in the design of emicizumab.Citation15
Bispecific IgGs using only two chains (a single HC/LC pair) have been designed using so-called two-in-one antibodies where the variable domains are extensively engineered using phage display to bind two unrelated antigens.Citation57 Two-in-one antibodies can bind either of the cognate antigens at each site, but not both at the same time, which may be an asset or a limitation depending upon the specific clinical application. An anti-HER3/EGFR two-in-one antibody, duligotuzumab, reached Phase 2 clinical trials in colorectalCitation58 as well as head and neck cancer,Citation58 albeit with limited efficacy. The incidence of ADAs for duligotuzumab was low (2 of 61 evaluable patients, 3.3%) with no impact on pharmacokinetics or safety.Citation59 An additional advantage of such two-in-one bispecific IgG is that they are comparable to monospecific IgG in ease of manufacture. A limitation of two-in-one bispecific IgG is that their design requires extensive variable domain engineering, which has largely unknown developability and immunogenicity risks. Unlike the single-site binding capability of two-in-one antibodies, DutaFabs are Fab fragments that have been engineered to bind to two different targets simultaneously.Citation60 DutaFabs offer an additional route to bispecific IgG that requires only two different chains (a single HC/LC pair), and no additional mutations are needed to facilitate the desired chain assembly.
In summary, data presented here in toto support the notion that research-grade antibodies can be useful surrogates for pharmaceutical-grade antibodies for immunogenicity risk assessment, although more such side-by-side comparisons are needed to test this premise. Additionally, our data suggest that there is low preclinical immunogenicity risk from using KIH mutationsCitation4,Citation6 and low to intermediate preclinical immunogenicity risk for Fab charge-pair mutations,Citation8 as assessed by comparison with low and high ADA benchmark molecules. Nevertheless, we cannot rule out the possibility of KIH or Fab mutations contributing to ADA risk. Simplifying the design of bispecific IgG by reducing the number of different chains to threeCitation15 or even two,Citation57,Citation60 as discussed above, offers an orthogonal way to address immunogenicity risks of bispecific IgG in the clinic. Further nonclinical immunogenicity risk assessment is warranted to support the advancement of alternative bispecific antibody formats into the clinic, including alternative mutations to facilitate cognate HC/LC pairing and HC heterodimerization.
Materials and methods
Monospecific and bispecific antibody generation
Gene synthesis completed by Genscript and GeneWiz was used to generate the DNA encoding antibody HC and LC variable domains of trastuzumab and bevacizumab. Variable domain residues are numbered according to Kabat,Citation61 whereas Eu numberingCitation62 is used for HC constant domains. These gene fragments were then cloned into the mammalian expression vector pRK5J (Genentech) that contains the corresponding HC or κ LC constant domains for human IgG1 knob (T366W), or hole (T366S:L368A:Y407V) mutations.Citation4 The antibodies were expressed by transient transfection of Chinese hamster ovary cells, then purified from the cell culture harvest fluid by protein A affinity chromatography and SEC, which was completed at WuXi Biologics. For all research grade antibodies, the final formulation buffer used was 20 mM histidine acetate, 150 mM NaCl, pH 5.5. The antibodies generated by KIH technologyCitation4,Citation6 were expressed using either two-cellCitation7 or one-cell methods.Citation8 For two-cell expression, half IgG1 antibodies containing knob or hole mutations were expressed and purified separately, then assembled into bispecific (or monospecific) IgG1 as previously described.Citation7 For one-cell expression, additional mutations were introduced to promote efficient pairing of cognate HC and LC (HC Q39E:S183K and LC Q38K:V133E, or HC Q39K:S183E and LC Q38E:V133K).Citation8
The pharmaceutical grade-antibodies, Avastin, Herceptin, and onartuzumab were obtained internally (Genentech, Inc) in their respective formulation buffers (Table S7). High ADA benchmarks used were keyhole limpet hemocyanin (KLH), a highly immunogenic antigen,Citation63 as well as bococizumab and ATR-107. Both antibodies were generated using the gene synthesis, expression, and purification methods described above. Pharmaceutical-grade Avastin was used as the low ADA benchmark in all assays. Two additional KIH IgG1 bispecific antibodies were generated with bevacizumab paired with either ATR-107 or bococizumab. Gene synthesis, two-cell expression, and purification followed the same methods as described above.
In silico T cell epitope prediction
The IEDB prediction tool for HLA‐II was used to predict potential T cell epitopes by using NetMHCIIpan-4.0.Citation37 For each sequence, we evaluated the potential presentation of the core peptide on nine common HLA-DR alleles: HLA-DRB1 × 01:01, HLA-DRB1 × 03:01, HLA-DRB1 × 04:01, HLA-DRB1 × 07:01, HLA-DRB1 × 08:01, HLA-DRB1 × 09:01, HLA-DRB1 × 11:01, HLA-DRB1 × 13:01, and HLA-DRB1 × 15:01. Based on the algorithm ranking, 12–20-mer peptides were considered to be presented on HLA-DR if the relative HLA-II presentation ranking was within the top 10%. Epitopes predicted to be presented on more than one HLA-DR molecule were defined as potential promiscuous epitopes. To identify potential immunogenic T cell epitopes in the Fab region for each molecule, we searched the natural antibody repertoire (OAS) for human-like nine-mer peptides using the BioPhi humanness analysis tool.Citation45 Epitopes found in over 93% of OAS human subjects were removed from further analysis. The 93% threshold was based on previous cross-validation analysis by us (data not shown). Further, using PEPMatch,Citation42 epitopes were excluded if their sequence was identical to nine-mer peptides from the human proteome (UniProt Proteome ID: UP000005640). Of the remaining epitopes, only those predicted to bind to more than one HLA-DR molecule were considered potential immunogenic T cell epitopes.
Ex vivo DC internalization assay
DC generation and loading was conducted following a previously published method.Citation36 In brief, monocytes were isolated from human blood from anonymous healthy volunteers participating in the Genentech blood donor program, after receiving a written, informed consent from the Western Institutional Review Board. Monocytes were differentiated into immature DCs using interleukin-4 and granulocyte-macrophage colony-stimulating factor for 5 d. After incubation with 100 µg/mL of the test antibody and 1 µg/mL of lipopolysaccharide (Sigma) for 24 hr, the DCs were harvested and washed with fluorescence-activated cell sorter (FACS) buffer (phosphate-buffered saline containing 2% fetal bovine serum and 0.02% sodium azide). For external staining, cells were stained with goat F(ab’)2 anti-human IgG F(ab’)2 conjugated to AlexaFluor-647 (Jackson ImmunoResearch Laboratories, catalog # 109-606-097) for 30 min on ice, washed three times with FACS buffer and then fixed with 4% paraformaldehyde for 10 min. The cells were washed and resuspended in the FACS buffer before analysis. For total staining, cells were permeabilized and fixed with Fixation and Permeabilization Solution (BD Biosciences), washed three times with Permeabilization Solution prior to staining with the same goat F(ab’)2 anti-human IgG F(ab’)2 conjugated to AlexaFluor-647 for 30 min on ice. Cells were washed with permeabilization wash buffer and resuspended in FACS buffer before analysis. The cells were analyzed with an Attune NxT flow cytometer (Invitrogen).
The data was analyzed using FlowJo (BD Biosciences, version 10.7.2). The internalization index was calculated by subtracting the fluorescence signal of the median fluorescence intensity (MFI) of externally stained cells from the MFI of the total stained cells. The statistical package in Prism (GraphPad, v10.2.2) was used to calculate P-values for the DC internalization index, via the Wilcoxon matched-pairs signed rank test.
Ex vivo T cell proliferation assay and data analysis
The T cell proliferation assay was modified from a published protocol.Citation41 Cryogenically preserved PBMC samples from healthy donors (n = 72) were thawed at 37°C using Aim-V media (Gibco) with 3% human serum (Sigma-Aldrich). Cells were seeded in a 24-well plate with Lonza X-vivo15 media (Lonza) at concentration of 4 × 10⁶ cells/mL/well. Cells were treated with 50 μg/mL of the test molecules and controls, as well as an additional high ADA benchmark Keyhole limpet hemocyanin (Thermo Imject mcKLH). Cells were cultured for 5 d at 37°C, 5% CO2, and then incubated with BrdU reagent (BD Bioscience) on day 6 for 24 hr. On day 7, cells were harvested and stained with Aqua Live/Dead (Thermo Fisher, catalog # L34957), anti-BV421-CD3 (BD Bioscience, catalog # 562426), anti-PE-Cy-7-CD4 (BD Bioscience, catalog # 557852), anti-APC-CD14 (BD Bioscience, catalog # 555399), anti-APC-CD19 (BD Bioscience, catalog # 555415) and anti-BrdU (BD Bioscience, catalog # 557891) antibodies according to the manufacturing protocols. Flow cytometry was performed using an Attune flow cytometer (190 µL sample volume, 500 µL/min flow rate, and 100,000–200,000 events per sample). T cell proliferation was measured by calculating the BrdU+ frequency of parent for live/CD14−/CD19−/CD3+/CD4+ cells using FlowJo software (BD Bioscience).
The T cell proliferation data analysis was performed in R Studio (2023.03.0 + 386). The stimulation index (SI) was calculated to define the positive response of the test antibodies per donor based on the following equation:
A positive response is defined by using a cut-point corresponding to the 95% quantile of the Avastin stimulation index measurements. Donors with SI greater than this cut-point were considered positive donors. The percentage of positive donors in each group is calculated here as the number of positive donors/total number of donors.
Prism (GraphPad, v10.2.2) was used for statistical analysis. The P-values for the SI values were calculated using the Wilcoxon matched-pairs signed rank test. The P-values for the percentage of positive donors were calculated using Fisher’s exact test.
MAPPs
For the first panel, donors (n = 10) were selected based on matching of the HLA-DRB1 alleles of at least 50% of donors from the T-cell assay and the other 50% donors of randomized selection. For the second panel, different donors (n = 10) using the same donor HLA selection schema were used. Avastin was used as a low ADA benchmark, and bococizumab and ATR-107 were used as high ADA benchmarks.
PBMCs were extracted from leukopaks from healthy human donors. CD14+ monocytes isolated from PBMCs were cultured in RPMI media supplemented with 10% fetal bovine serum, L-glutamine, non-essential amino acids, sodium pyruvate, and gentamicin containing granulocyte-macrophage colony-stimulating factor and interleukin-4. After 5 d of culturing, the monocytes were differentiated into immature DCs. The DCs were treated with 100 μg/mL protein therapeutic and matured with 1 μg/mL lipopolysaccharide for 16 hr. On day 6 the mature DCs were harvested, counted, and washed in phosphate-buffered saline. Cells were flash frozen and stored at −80°C until needed for downstream processing.
Frozen DC pellets (2 ×10⁶ cells/pellet) treated with protein therapeutics were lysed in 300 μL lysis buffer (20 mM Tris-HCl, 3 mM MgCl2, 100 mM NaCl, 0.1% Triton X-100, protease inhibitor (Roche #11836170001), 0.2uM iodoacetamide, and 25 μg/mL DNase (Roche #10104159001)), pH 7.8 for 1 hr at 4°C. Lysates were cleared by centrifugation at 20,000×g for 30 min at 4°C. HLA-DR was then immunoprecipitated from the lysates using L243-antibody covalently cross-linked to protein A 5 μL cartridges (Agilent Technologies). Briefly, using the Agilent Assaymap Bravo (Agilent Technologies) platform, lysates were loaded onto the L243-bound protein A cartridges, washed with 20 mM Tris-HCl buffers containing varying salt concentrations, and eluted with 0.1 M acetic acid/0.1% trifluoroacetic acid.
Immunoprecipitation eluents were desalted with C18 cartridges (Agilent Technologies), subjected to on-cartridge reduction (5 mM dithiothreitol), alkylation (15 mM iodoacetamide) prior to elution with 40% acetonitrile with 0.1% formic acid, lyophilization. Peptides were reconstituted in 10 μL 2% acetonitrile with 0.1% formic acid then injected onto an Aurora Elite Gen3 25 cm × 75 μm, C18 1.7 μm (Ion Opticks) analytical column. Chromatographic separation was performed at a flow rate of 300 nL/min using a Thermo Vanquish Neo LC (ThermoFisher) with a gradient ranging from 2 to 30% solvent B (0.1% formic acid in acetonitrile) over 40 min, 30 to 50% in 5 min, 50 to 90% in 1 min and held at 90% for 5 min. The liquid chromatography was interfaced to a Bruker timsToF SCP mass spectrometer (Bruker) at a spray voltage of 1.5kV. MS1 and MS2 scans were acquired from 100 to 1700 m/z and 1/K0 at 0.7 to 1.3 Vs/cmCitation2 in DDA PASEF mode. Per cycle, ten PASEF ramps were acquired with an accumulation and ramp time of 166 ms. High-sensitivity detection was enabled and precursor target intensity was set to 10,000, with an intensity threshold of 500. Standard polygon placement excluding singly charged ions was adapted for HLA-II peptide analytes. Collision energy was increased in an ion mobility-dependent manner from 20 to 59 eV.
Tandem mass spectral results were submitted for database searching using PEAKS Online X build 1.8.2023–05-12_09322635 (BSI) against a database containing sequences from Swiss-PROT Human proteome and protein therapeutics (concatenated forward and reversed plus common laboratory contaminants). The data was searched with no enzyme specificity, variable modification of oxidation (Met, +15.995 Da), deamidation (Asn and/or Gln, +0.984), carbamidomethylation (Cys, +57.042), 3 maximum variable post-translational modifications per peptide, 10 ppm precursor mass tolerance, and fragment ion tolerance at 0.02 Da. PSMs were filtered using the decoy fusion method to an estimated false discovery rate of 0.1%. For data analysis, the epitopes were filtered to a length range of 11 to 30 amino acids and the number of clusters were counted. A cluster is defined as one or more presented T cell epitopes of varying lengths that share the same MHC-II binding core. The results are represented in a heatmap spanning across the amino acid sequence of the protein therapeutic using the R visualization package, PepAlignViz (). The area of epitope value was determined by the area under the curve of the epitope (i.e., peptide) signal detected by mass spectrometry. The heatmap is colored by the area of epitopes. The area for each cluster was calculated based on summation of the maximum area of each unique sequence in a peptide cluster. The peptides that could not be quantified, including those with sporadic MS1 signals below the noise threshold, were excluded.
Identification of epitopes from MAPPs peptides
To identify potential immunogenic T cell epitopes in MAPPs peptides, we also used NetMHCIIpan-4.0 as was done for in silico epitope prediction. For each donor, we used the MAPPs peptide sequences and donor-specific HLA-DR alleles to identify the most likely nine-mer peptide-binding core. If a donor was heterozygous at the HLA-DR loci and had multiple predicted cores for a peptide, we used the strongest binder (i.e., lowest percentile rank score). We then aligned these binding cores to nine-mer peptides in OAS and human proteome to exclude likely tolerized epitopes. After this filtering process, the remaining nine-mer peptide-binding cores were potential immunogenic epitopes.
Integrated immunogenicity risk assessment
For each assay, a molecule was assigned an immunogenicity risk of low, intermediate, and high. To assign these labels, two thresholds were used, one to distinguish low from intermediate risk molecules and one to distinguish intermediate and high-risk molecules ().
For DC internalization assays in molecules with median DC internalization indices that were less than 2 standard deviations (SD) above Avastin’s median DC internalization index value were predicted as low risk, while those with above bococizumab’s median DC internalization index value subtracted by 2 SDs were classified as high risk. Molecules in between these values were predicted as intermediate risk. Similar methods are applied to , using 1 SD instead of 2 SDs.
For T cell proliferation, the considerable overlap between the distributions of values of the different drugs makes the risk categorization based on SDs less useful. Hence, the thresholds were chosen using the Wilcoxon matched-pairs signed rank test of each molecule compared to Avastin. The thresholds used: low risk (p > 0.05), intermediate risk (*p ≤ 0.05 and **p ≤ 0.01), and high risk (***p ≤ 0.001 and ****p ≤ 0.0001).
For the in silico-MAPPs overlap analysis, the number of immunogenic T cell epitopes predicted for Avastin (n = 5) and bococizumab (n = 11) were considered in establishing binning thresholds. Specifically, molecules with 1–6 overlapping epitopes were predicted as low risk. Molecules with 7–9 overlapping epitopes were predicted to have intermediate risk. Molecules with ≥10 overlapping epitopes were predicted to be at high risk.
Abbreviations
| ADAs | = | Anti-drug antibodies |
| APCs | = | Antigen-presenting cells |
| BrdU | = | Bromodeoxyuridine |
| CDRs | = | Complementarity-determining regions |
| DCs | = | Dendritic cells |
| FACS | = | Fluorescence-activated cell sorter |
| HC | = | Heavy chain |
| HLA-II | = | Human leukocyte antigen, class II |
| KIH | = | Knobs-into-holes |
| KLH | = | Keyhole limpet hemocyanin |
| LC | = | Light chain |
| MAPPs | = | Major histocompatibility complex-associated peptide proteomics |
| MFI | = | Median fluorescence intensity |
| MHC-II | = | Major histocompatibility complex, class II |
| OAS | = | Observed antibody space |
| PBMCs | = | Peripheral blood mononuclear cells |
| PCSK9 | = | Proprotein convertase subtilisin/kexin type nine |
| PSM | = | Peptide spectrum match |
| SD | = | Standard deviation |
| SEC | = | Size-exclusion chromatography |
| SI | = | Stimulation index |
Supplemental Material
Download Zip (2.5 MB)Acknowledgments
We thank our Genentech colleagues: Yongmei Chen for coordination of gene synthesis, and Hong Li for coordination of mammalian cell expression and antibody purification, plus Kristen Nailor and Satpal Singh for their assistance with protein sample management.
Disclosure statement
All authors are current or former Genentech employees which develops and commercializes therapeutics including monospecific and bispecific antibodies.
Supplementary material
Supplemental data for this article can be accessed online at https://doi.org/10.1080/19420862.2024.2362789.
Additional information
Funding
References
- The Antibody Society. Therapeutic monoclonal antibodies approved or in regulatory review. [accessed 2024 May 31]. www.antibodysociety.org/antibody-therapeutics-product-data.
- Labrijn AF, Janmaat ML, Reichert JM, Parren P. Bispecific antibodies: a mechanistic review of the pipeline. Nat Rev Drug Discov. 2019;18(8):585–16. doi:10.1038/s41573-019-0028-1.
- Li Y. A brief introduction of IgG-like bispecific antibody purification: Methods for removing product-related impurities. Protein Expr Purif. 2019;155:112–19. doi:10.1016/j.pep.2018.11.011.
- Atwell S, Ridgway JB, Wells JA, Carter P. Stable heterodimers from remodeling the domain interface of a homodimer using a phage display library. J Mol Biol. 1997;270(1):26–35. doi:10.1006/jmbi.1997.1116.
- Merchant AM, Zhu Z, Yuan JQ, Goddard A, Adams CW, Presta LG, Carter P. An efficient route to human bispecific IgG. Nat Biotechnol. 1998;16(7):677–81. doi:10.1038/nbt0798-677.
- Ridgway JB, Presta LG, Carter P. ‘Knobs-into-holes’ engineering of antibody CH domains for heavy chain heterodimerization. Protein Eng Des Sel. 1996;9(7):617–21. doi:10.1093/protein/9.7.617.
- Spiess C, Merchant M, Huang A, Zheng Z, Yang NY, Peng J, Ellerman D, Shatz W, Reilly D, Yansura DG. et al. Bispecific antibodies with natural architecture produced by co-culture of bacteria expressing two distinct half-antibodies. Nat Biotechnol. 2013;31(8):753–58. doi:10.1038/nbt.2621.
- Dillon M, Yin Y, Zhou J, McCarty L, Ellerman D, Slaga D, Junttila TT, Han G, Sandoval W, Ovacik MA. et al. Efficient production of bispecific IgG of different isotypes and species of origin in single mammalian cells. Mabs-austin. 2017;9(2):213–30. doi:10.1080/19420862.2016.1267089.
- Hellmann MD, Bivi N, Calderon B, Shimizu T, Delafontaine B, Liu ZT, Szpurka AM, Copeland V, Hodi FS, Rottey S. et al. Safety and immunogenicity of LY3415244, a bispecific antibody against TIM-3 and PD-L1, in patients with advanced solid tumors. Clin Cancer Res. 2021;27(10):2773–81. doi:10.1158/1078-0432.Ccr-20-3716.
- Akpalu DE, Frederick B, Nnane IP, Yao Z, Shen F, Ort T, Fink D, Dogmanits S, Raible D, Sharma A. et al. Pharmacokinetics, pharmacodynamics, immunogenicity, safety, and tolerability of JNJ-61178104, a novel tumor necrosis factor-alpha and interleukin-17A bispecific antibody, in healthy subjects. J Clin Pharmacol. 2019;59(7):968–78. doi:10.1002/jcph.1393.
- US Food and Drug Administration. Highlights of prescribing information, RYBREVANT (amivantamab-vmjw) injection, for intravenous use. [accessed 2023 June 8]. https://www.accessdata.fda.gov/drugsatfda_docs/label/2021/761210s000lbl.pdf.
- Schmitt C, Emrich T, Chebon S, Fernandez E, Petry C, Yoneyama K, Kiialainen A, Howard M, Niggli M, Paz-Priel I. et al. Low immunogenicity of emicizumab in persons with haemophilia a. Haemophilia. 2021;27(6):984–92. doi:10.1111/hae.14398.
- Kroenke MA, Milton MN, Kumar S, Bame E, White JT. Immunogenicity risk assessment for multi-specific therapeutics. Aaps J. 2021;23(6):115. doi:10.1208/s12248-021-00642-5.
- Zhou Y, Penny HL, Kroenke MA, Bautista B, Hainline K, Chea LS, Parnes J, Mytych DT. Immunogenicity assessment of bispecific antibody-based immunotherapy in oncology. J Immunother Cancer. 2022;10(4):e004225. doi:10.1136/jitc-2021-004225.
- Sampei Z, Igawa T, Soeda T, Okuyama-Nishida Y, Moriyama C, Wakabayashi T, Tanaka E, Muto A, Kojima T, Kitazawa T. et al. Identification and multidimensional optimization of an asymmetric bispecific IgG antibody mimicking the function of factor VIII cofactor activity. PLoS One. 2013;8(2):e57479. doi:10.1371/journal.pone.0057479.
- Tourdot S, Hickling TP. Nonclinical immunogenicity risk assessment of therapeutic proteins. Bioanal. 2019;11(17):1631–43. doi:10.4155/bio-2018-0246.
- Ducret A, Ackaert C, Bessa J, Bunce C, Hickling T, Jawa V, Kroenke MA, Lamberth K, Manin A, Penny HL. et al. Assay format diversity in pre-clinical immunogenicity risk assessment: Toward a possible harmonization of antigenicity assays. Mabs-austin. 2022;14(1):1993522. doi:10.1080/19420862.2021.1993522.
- Ulitzka M, Carrara S, Grzeschik J, Kornmann H, Hock B, Kolmar H. Engineering therapeutic antibodies for patient safety: tackling the immunogenicity problem. Prot Eng Des Sel. 2020;33. doi:10.1093/protein/gzaa025.
- Harris CT, Cohen S. Reducing immunogenicity by design: approaches to minimize immunogenicity of monoclonal antibodies. BioDrugs. 2024;38(2):205–26. doi:10.1007/s40259-023-00641-2.
- Arata Y, Motoyama S, Yano M, Ikuno T, Ito S, Matsushita T, Takeiri A, Nishito Y, Yabuki N, Mizuno H. et al. Rapid in vitro assessment of the immunogenicity potential of engineered antibody therapeutics through detection of CD4(+) T cell interleukin-2 secretion. Mabs-austin. 2023;15(1):2253570. doi:10.1080/19420862.2023.2253570.
- Abbas AK, Lichtman AH, Pillai S. Cellular and Molecular Immunology. In: Bowes J, editor. Cellular and Molecular Immunology. 10th ed. Philadelphia, PA: Elsevier; 2021. p. 261–285, 337–363.
- Cassotta A, Mikol V, Bertrand T, Pouzieux S, Le Parc J, Ferrari P, Dumas J, Auer M, Deisenhammer F, Gastaldi M. et al. A single T cell epitope drives the neutralizing anti-drug antibody response to natalizumab in multiple sclerosis patients. Nat Med. 2019;25(9):1402–07. doi:10.1038/s41591-019-0568-2.
- Cia G, Pucci F, Rooman M. Critical review of conformational B-cell epitope prediction methods. Brief Bioinform. 2023;24(1). doi:10.1093/bib/bbac567.
- Lin J, Lee SL, Russell AM, Huang RF, Batt MA, Chang SS, Ferrante A, Verdino P, Henry KA. A structure-based engineering approach to abrogate pre-existing antibody binding to biotherapeutics. PLoS One. 2021;16(7):e0254944. doi:10.1371/journal.pone.0254944.
- Cohen S, Chung S, Spiess C, Lundin V, Stefanich E, Laing ST, Clark V, Brumm J, Zhou Y, Huang C. et al. An integrated approach for characterizing immunogenic responses toward a bispecific antibody. Mabs-austin. 2021;13(1):1944017. doi:10.1080/19420862.2021.1944017.
- Peng K, Siradze K, Fischer SK. Characterization of robust immune responses to a bispecific antibody, a novel class of antibody therapeutics. Bioanal. 2021;13(4):239–52. doi:10.4155/bio-2020-0281.
- Schick AJ 3rd, Lundin V, Low J, Peng K, Vandlen R, Wecksler AT. Epitope mapping of anti-drug antibodies to a clinical candidate bispecific antibody. Mabs-austin. 2022;14(1):2028337. doi:10.1080/19420862.2022.2028337.
- US Food and Drug Administration. Highlights of prescribing information, AVASTIN (bevacizumab) injection, for intravenous use. [accessed 2023 Jul 31]. www.accessdata.fda.gov/drugsatfda_docs/label/2017/761083s000lbl.pdf.
- US Food and Drug Administration. Highlights of prescribing information, HERCEPTIN HYLECTA™ (trastuzumab and hyaluronidase-oysk) injection, for subcutaneous use. [accessed 2023 June 8]. www.accessdata.fda.gov/drugsatfda_docs/label/2022/761235s000lbl.pdf.
- Jackisch C, Kim SB, Semiglazov V, Melichar B, Pivot X, Hillenbach C, Stroyakovskiy D, Lum BL, Elliott R, Weber HA. et al. Subcutaneous versus intravenous formulation of trastuzumab for HER2-positive early breast cancer: updated results from the phase III HannaH study. Ann Oncol. 2015;26(2):320–25. doi:10.1093/annonc/mdu524.
- Merchant M, Ma X, Maun HR, Zheng Z, Peng J, Romero M, Huang A, Yang NY, Nishimura M, Greve J. et al. Monovalent antibody design and mechanism of action of onartuzumab, a MET antagonist with anti-tumor activity as a therapeutic agent. Proc Natl Acad Sci U S A. 2013;110(32):E2987–2996. doi:10.1073/pnas.1302725110.
- Salgia R, Patel P, Bothos J, Yu W, Eppler S, Hegde P, Bai S, Kaur S, Nijem I, Catenacci DV. et al. Phase I dose-escalation study of onartuzumab as a single agent and in combination with bevacizumab in patients with advanced solid malignancies. Clin Cancer Res. 2014;20(6):1666–75. doi:10.1158/1078-0432.Ccr-13-2070.
- Xin Y, Jin D, Eppler S, Damico-Beyer LA, Joshi A, Davis JD, Kaur S, Nijem I, Bothos J, Peterson A. et al. Population pharmacokinetic analysis from phase I and phase II studies of the humanized monovalent antibody, onartuzumab (MetMab), in patients with advanced solid tumors. J Clin Pharmacol. 2013;53(11):1103–11. doi:10.1002/jcph.148.
- Ridker PM, Tardif JC, Amarenco P, Duggan W, Glynn RJ, Jukema JW, Kastelein JJP, Kim AM, Koenig W, Nissen S. et al. Lipid-reduction variability and antidrug-antibody formation with bococizumab. N Engl J Med. 2017;376(16):1517–26. doi:10.1056/NEJMoa1614062.
- Hua F, Comer GM, Stockert L, Jin B, Nowak J, Pleasic-Williams S, Wunderlich D, Cheng J, Beebe JS. Anti-IL21 receptor monoclonal antibody (ATR-107): safety, pharmacokinetics, and pharmacodynamic evaluation in healthy volunteers: a phase I, first-in-human study. J Clin Pharmacol. 2014;54(1):14–22. doi:10.1002/jcph.158.
- Melendez R, Ordonia B, Guerrero J, Hassanzadeh A, Tran P, Low J, Wong M, Brumm J, Chung S, Kamen L. Introducing dendritic cell antibody internalization as an immunogenicity risk assessment tool. Bioanal. 2022;14(10):703–13. doi:10.4155/bio-2022-0024.
- Reynisson B, Alvarez B, Paul S, Peters B, Nielsen M. NetMHCpan-4.1 and NetMHCIIpan-4.0: improved predictions of MHC antigen presentation by concurrent motif deconvolution and integration of MS MHC eluted ligand data. Nucleic Acids Res. 2020;48(W1):W449–54. doi:10.1093/nar/gkaa379.
- Quarmby V, Phung QT, Lill JR. MAPPs for the identification of immunogenic hotspots of biotherapeutics; an overview of the technology and its application to the biopharmaceutical arena. Expert Rev Proteomics. 2018;15(9):733–48. doi:10.1080/14789450.2018.1521279.
- Sekiguchi N, Kubo C, Takahashi A, Muraoka K, Takeiri A, Ito S, Yano M, Mimoto F, Maeda A, Iwayanagi Y. et al. MHC-associated peptide proteomics enabling highly sensitive detection of immunogenic sequences for the development of therapeutic antibodies with low immunogenicity. Mabs-austin. 2018;10(8):1168–81. doi:10.1080/19420862.2018.1518888.
- Cohen S, Myneni S, Batt A, Guerrero J, Brumm J, Chung S. Immunogenicity risk assessment for biotherapeutics through in vitro detection of CD134 and CD137 on T helper cells. Mabs-austin. 2021;13(1):1898831. doi:10.1080/19420862.2021.1898831.
- Ito S, Ikuno T, Mishima M, Yano M, Hara T, Kuramochi T, Sampei Z, Wakabayashi T, Tabo M, Chiba S. et al. In vitro human helper T-cell assay to screen antibody drug candidates for immunogenicity. J Immunotoxicol. 2019;16(1):125–32. doi:10.1080/1547691X.2019.1604586.
- Marrama D, Chronister WD, Westernberg L, Vita R, Kosaloglu-Yalcin Z, Sette A, Nielsen M, Greenbaum JA, Peters B. PEPMatch: a tool to identify short peptide sequence matches in large sets of proteins. BMC Bioinf. 2023;24(1):485. doi:10.1186/s12859-023-05606-4.
- Kovaltsuk A, Leem J, Kelm S, Snowden J, Deane CM, Krawczyk K. Observed antibody space: a resource for data mining next-generation sequencing of antibody repertoires. J Immunol. 2018;201(8):2502–09. doi:10.4049/jimmunol.1800708.
- Olsen TH, Boyles F, Deane CM. Observed antibody space: A diverse database of cleaned, annotated, and translated unpaired and paired antibody sequences. Protein Sci. 2022;31(1):141–46. doi:10.1002/pro.4205.
- Prihoda D, Maamary J, Waight A, Juan V, Fayadat-Dilman L, Svozil D, DA B. BioPhi: A platform for antibody design, humanization, and humanness evaluation based on natural antibody repertoires and deep learning. Mabs-austin. 2022;14(1):2020203. doi:10.1080/19420862.2021.2020203.
- Egholm Bruun Jensen E, Reynisson B, Barra C, Nielsen M. New light on the HLA-DR immunopeptidomic landscape. J Leukoc Biol. 2024;115(5):913–25. doi:10.1093/jleuko/qiae007.
- Wen Y, Cahya S, Zeng W, Lin J, Wang X, Liu L, Malherbe L, Siegel R, Ferrante A, Kaliyaperumal A. Development of a FRET-based assay for analysis of mAbs internalization and processing by dendritic cells in preclinical immunogenicity risk assessment. Aaps J. 2020;22(3):68. doi:10.1208/s12248-020-00444-1.
- Gokemeijer J, Wen Y, Jawa V, Mitra-Kaushik S, Chung S, Goggins A, Kumar S, Lamberth K, Liao K, Lill J. et al. Survey outcome on immunogenicity risk assessment tools for biotherapeutics: an insight into consensus on methods, application, and utility in drug development. Aaps J. 2023;25(4):55. doi:10.1208/s12248-023-00820-7.
- Xue L, Hickling T, Song R, Nowak J, Rup B. Contribution of enhanced engagement of antigen presentation machinery to the clinical immunogenicity of a human interleukin (IL)-21 receptor-blocking therapeutic antibody. Clin Exp Immunol. 2016;183(1):102–13. doi:10.1111/cei.12711.
- Spindeldreher S, Karle A, Correia E, Tenon M, Gottlieb S, Huber T, Maillere B, Kolbinger F. T cell epitope mapping of secukinumab and ixekizumab in healthy donors. Mabs-austin. 2020;12(1):1707418. doi:10.1080/19420862.2019.1707418.
- Hartman K, Steiner G, Siegel M, Looney CM, Hickling TP, Bray-French K, Springer S, Marban-Doran C, Ducret A. Expanding the MAPPs assay to accommodate MHC-II pan receptors for improved predictability of potential T cell epitopes. Biology. 2023;12(9):1265. doi:10.3390/biology12091265.
- Moussa EM, Panchal JP, Moorthy BS, Blum JS, Joubert MK, Narhi LO, Topp EM. Immunogenicity of therapeutic protein aggregates. J Pharm Sci. 2016;105(2):417–30. doi:10.1016/j.xphs.2015.11.002.
- Ratanji KD, Derrick JP, Dearman RJ, Kimber I. Immunogenicity of therapeutic proteins: influence of aggregation. J Immunotoxicol. 2014;11(2):99–109. doi:10.3109/1547691X.2013.821564.
- Dyson MR, Masters E, Pazeraitis D, Perera RL, Syrjanen JL, Surade S, Thorsteinson N, Parthiban K, Jones PC, Sattar M. et al. Beyond affinity: selection of antibody variants with optimal biophysical properties and reduced immunogenicity from mammalian display libraries. Mabs-austin. 2020;12(1):1829335. doi:10.1080/19420862.2020.1829335.
- Jain T, Boland T, Lilov A, Burnina I, Brown M, Xu Y, Vasquez M, Valencia A. Prediction of delayed retention of antibodies in hydrophobic interaction chromatography from sequence using machine learning. Bioinformatics. 2017;33(23):3758–66. doi:10.1093/bioinformatics/btx519.
- Jain T, Boland T, Vasquez M. Identifying developability risks for clinical progression of antibodies using high-throughput in vitro and in silico approaches. Mabs-austin. 2023;15(1):2200540. doi:10.1080/19420862.2023.2200540.
- Bostrom J, Yu SF, Kan D, Appleton BA, Lee CV, Billeci K, Man W, Peale F, Ross S, Wiesmann C. et al. Variants of the antibody herceptin that interact with HER2 and VEGF at the antigen binding site. Science. 2009;323(5921):1610–14. doi:10.1126/science.1165480.
- Hill AG, Findlay MP, Burge ME, Jackson C, Alfonso PG, Samuel L, Ganju V, Karthaus M, Amatu A, Jeffery M. et al. Phase II study of the dual EGFR/HER3 inhibitor duligotuzumab (MEHD7945A) versus cetuximab in combination with FOLFIRI in second-line RAS wild-type metastatic colorectal cancer. Clin Cancer Res. 2018;24(10):2276–84. doi:10.1158/1078-0432.CCR-17-0646.
- Fayette J, Wirth L, Oprean C, Udrea A, Jimeno A, Rischin D, Nutting C, Harari PM, Csoszi T, Cernea D. et al. Randomized phase II study of duligotuzumab (MEHD7945A) vs. cetuximab in squamous cell carcinoma of the head and neck (MEHGAN Study). Front Oncol. 2016;6:232. doi:10.3389/fonc.2016.00232.
- Beckmann R, Jensen K, Fenn S, Speck J, Krause K, Meier A, Roth M, Fauser S, Kimbung R, Logan DT. et al. DutaFabs are engineered therapeutic Fab fragments that can bind two targets simultaneously. Nat Commun. 2021;12(1):708. doi:10.1038/s41467-021-20949-3.
- Kabat EA, Wu TT, Perry HM, Gottesman KS, Foeller C. Sequences of proteins of immunological interest. 5th ed. Bethesda (MD): NIH; 1991.
- Edelman GM, Cunningham BA, Gall WE, Gottlieb PD, Rutishauser U, Waxdal MJ. The covalent structure of an entire gammaG immunoglobulin molecule. Proc Natl Acad Sci U S A. 1969;63(1):78–85. doi:10.1073/pnas.63.1.78.
- Swaminathan A, Lucas RM, Dear K, McMichael AJ. Keyhole limpet haemocyanin - a model antigen for human immunotoxicological studies. Br J Clin Pharmacol. 2014;78(5):1135–42. doi:10.1111/bcp.12422.