Abstract
Environmental disputes often encompass both a conflict over the practical issue itself and, more fundamentally, a conflict over environmental worldviews (EWVs). In this study, a new two-dimensional tool has been created for measuring prevailing EWVs in individuals and organizations. Respondent’s place on the horizontal axis shows preference on an institutional scale where environmental issues should be handled. Therefore, the x-axis shows the relationship between social greens (highlighting local communities) and institutionalists (believing in strong global cooperation and institutions). The vertical axis describes focus on sustainability/nature vs. market/economy, thus showing preference between bioenvironmentalists and market liberals. EWVs were measured in Finnish political parties, actors in environmental administration, many non-environmental organizations and public innovation funders. Principal component analysis showed that the two-dimensional analysis fits well to the EWV analysis. Data (n = 1637) approximates symmetrically the bell curve of a normal distribution in both the axes, with neglible linear relation between the axes. A case study of seven Finnish political parties revealed remarkable EWV differences, logically compared to the existing research. Moreover, the respondent’s views on globalization were found to follow a very different logic from the environmental concern. An analytical tool of EWVs fosters harmonious decision-making, facilitating constructive solutions in environmental debate.
1. Introduction
In environmental debates many highly contentious questions arise where various parties claim to be working for the environment but nonetheless cannot reach a compromise. Environmental disputes often encompass both a conflict over the practical issue itself and, more fundamentally, a conflict over the environmental worldviews (EWVs). As a result, stakeholders may be strikingly divided into two camps exhibiting a fundamental conflict over values and EWVs (Durnova Citation2013). Even though differences in EWVs often have a crucial effect on debates, these differing viewpoints are not usually approached analytically. Currently, there is no simple-to-use quantitative tool for illustrating the different EWVs within various parties. This study will introduce such a new tool.
2. Environmental worldview and its relation to human values, attitudes, environmental awareness (EA) and pro-environmental behaviour (PEB)
A worldview is ‘a particular philosophy or conception of the world’ (Oxford English Dictionary, http://www.oed.com/). They underlie discourses, and introduce coherence and explanatory power for discourses. EWV narrows the definition to include only the environmental aspects of one’s particular way of thinking. Thus, EWVs are commonly shared beliefs that give us a sense of how humans should interact with the environment, influencing in how we interact with nature and how we use natural resources. Environmental worldviews are typically intrinsically tied to the political philosophy adopted and to personal foundational beliefs related to the environment. It is quite different a concept from environmental attitudes and human values.
2.1. The most widely used measures of environmental attitudes
Despite the large number of measurements of environmental attitudes available, only three measures have been widely used (Dunlap & Jones Citation2002; Fransson & Gärling Citation1999). These are the Ecology Scale (Maloney et al. Citation1975), the Environmental Concern Scale (Weigel & Weigel Citation1978), and the New Ecological Paradigm (NEP) scale (Dunlap & Jones Citation2002). These three scales assess respondents’ concerns about various environmental issues and multiple expressions of concern, being therefore all multiple-topic/multiple-expression assessment techniques (Dunlap & Jones Citation2002, Citation2003). Both the Ecology Scale and the Environmental Concern Scale include items referring to specific environmental topics that have become dated as new issues emerge (Dunlap & Jones Citation2002).
2.2. The New Ecological Paradigm (NEP) scale and its criticism
The New Ecological Paradigm (NEP) scale measures general beliefs about the relationship of human beings to the environment. Likely because of the universal nature of the beliefs measured, the NEP scale has become the most widely-used measure of environmental thinking (Milfont & Duckitt Citation2010). The original NEP had 12 statements that were meant to represent a single scale of a ‘pro-ecological’ worldview. It was criticized for several shortcomings. Dunlap and colleagues then developed the so-called revised NEP, which is designed to measure the environmental concern of groups of people using a survey constructed of fifteen statements. Respondents are asked to indicate the strength of their agreement or disagreement with 15 statements that determine their measures of environmental concern. The revised NEP scale has faced much criticism, which can be divided to three broad categories.
First criticism is that the revised NEP scale lacks certain elements of a pro-ecological world view and thus is incomplete. It is said that the NEP scale leaves out expressions of a biocentric or ecocentric world view coming from late twentieth-century environmental ethics literature. (Milfont & Duckitt Citation2010) Second, the pro-environmental behaviour has been only weakly linked to the NEP scale, suggesting that the scale fails to measure a worldview accurately (Milfont & Duckitt Citation2010). Third, there is a considerable debate about the one-dimensionality of the revised NEP scale. Dunlap and colleagues argued that the NEP in both of its iterations measures a one-dimensional endorsement of a world view that could be measured simply by adding up the responses. Numerous studies have used statistical techniques (principal components analysis) to test this. This one-dimensionality of the scale is a fundamental limitation that should be addressed. Therefore, a two-dimensional measurement scale is later proposed in this study.
Given its extensive current usage, the NEP scale will continue to be used widely, for at least it gives comparisons across study types, population types, and time (Anderson Citation2012). Milfont and Duckitt (Citation2010) concluded that:
It may also be necessary to develop a more appropriate measure of EA for environmentalists given their tendency to strongly agree with virtually every NEP item, creating a kind of ‘ceiling effect’ (Widegren Citation1998). It would be interesting to see if scales developed specifically for use by environmentalists show higher correlation with pro-environmental behaviour than does the NEP scale.
2.3. Previous two-dimensional models on environmental values or attitudes
Two earlier two-dimensional models exist in the field of environmental attitudes. First, a model called 2-MEV (2 factor model for environmental values) analysis, was introduced by Bogner and Wiseman in Citation1999, and later developed and refined (Bogner & Wiseman Citation1999, Citation2006). The information for it is gathered via a questionnaire specifically targeted to measure two factors of the respondent. Boeve-de Pauw and Van Petegem (Citation2013) further developed and refined the model. The version used by Boeve-de Pauw was built around two dimensions: biocentric and anthropocentric, which are not interdependent but act as separate axes, allowing the respondent to vary their position in one dimension but not the other. In their model Ecological Values are determined by one’s position on two orthogonal dimensions, a biocentric dimension that reflects conservation and protection of the environment (Preservation); and an anthropocentric dimension that reflects the utilization of natural resources (Utilization) (Wiseman & Bogner Citation2003). However, the 2-MEV methodology has three limitations: (1) it is not a universally valid instrument. Thus, it has to be culturally modified to reflect cultural traits or physical environment; (2) it has a complicated, multilevel structure, making the exercises very time-consuming; and (3) it is targeted mainly for students’ use in improving environmental education.
The advantages of the two-dimensional examination of environmental values have been recognized by Milfont and Duckitt (Citation2010), who proposed a promising Environmental Attitudes Inventory measure. It has both horizontal and vertical structure, where (1) at least twelve core dimensions form their horizontal structure; and (2) the vertical structure is comprised by first-order factors loading on a single second-order factor (i.e. Generalized Environmental Attitudes) – or perhaps loading on either one of two correlated second-order factors (i.e. Utilization and Preservation). (Milfont & Duckitt Citation2010). While acknowledging the great scientific value and promise that the Environmental Attitudes Inventory provides in this field, in the light of this study there are, however, two concerns.
The first concern is the complexity of the method. The questionnaire has 10 items per scale, totaling 120 items in its complete form. The short-form of the questionnaire has 6 items per scale, totaling 72 items. In today’s hectic world, a questionnaire with 120 or even 72 items plus lengthy descriptions takes too long to fill out. This ‘overly researchy nature’ of the inventory probably is the main reason why there were only a modest number of respondents answering the performed studies. A brief version of the Environmental Attitudes Inventory was also created with only 24 items (Milfont & Duckitt Citation2010), but unfortunately it has not been tested as rigorously as the 120 and 72 items version.
The second concern about the Environmental Attitudes Inventory is the internal inconsistency of survey contents. Generally, this is common to all attitudes research. Most of the studies in this field are conducted by sociologists trying to identify the level of specific environmental attitudes, or environmental concerns. However, a number of studies have showed inconsistency, or even non-existence, of the relationship between pro-environmental attitude and behaviour (Van Liere & Dunlap Citation1981; Buttel Citation1996; Mainieri et al. Citation1997). Moreover, in previous research few of the environmental concerns have been directly transformed into pro-environmental behaviour (ECLAC Citation2000). In fact, numerous studies have demonstrated empirical results such as: (a) low correlation among environmental behaviours, (b) different levels of specificity in a measure of attitude and behaviour, (c) effects of extraneous variables and (d) lack of measurement reliability and validity (Mainieri et al. Citation1997). The tripartite theory of attitudes (affect, cognition and/or beliefs and behaviour) has been found questionable, since its components are often seen as indistinguishable from each other and they do not separate attitudes from concrete behaviour. These concerns can be observed also when investigating the contents of the Environmental Attitudes Inventory. Therein, of the twelve scales used, one scale indeed fully focuses on PEB. In the next chapter, contrary to the attitudes research, environmental worldviews are clearly defined as being completely separated from human behaviour.
2.4. Environmental worldviews in relation to human values
Human values have been studied in various disciplines, with different approaches. One approach is that values are deeply held beliefs, assumptions, and desires that are often the basis for voluntary (as opposed to involuntary) human actions (Joyner & Payne Citation2002). Knowledge of human values is therefore not only of paramount importance across all the social sciences (Schwartz Citation2012), but in the implementation of sustainable development as well (Janouskova & Hák Citation2013). The EWVs might have an even more crucial role in the implementation of sustainable development than values studies, since EWVs have by definition a particular focus in environmental matters.
2.5. Environmental worldviews in relation to (EA) and (PEB)
Environmental issues are typically multidisciplinary and rich in complexity and usually there is no way to objectively ‘judge’ whose thinking is more ‘environmentally friendly’, since the reasoning and priorities of opposite sides differ so greatly. Thus, EA can have multiple forms, depending largely on the EWV of the individual.
In recent studies, the Comprehensive Action Determination Model (CADM) is a model that has shown promise in explaining the psychology behind environmental action. The first version of the CADM was used in a study of travel-mode choice (Klöckner & Blöbaum Citation2010). This version integrated the principles of the theory of planned behaviour, the norm-activation model, the theoretical concept of habit and the ipsative theory all together. These were all previously independently utilised theories that, however, had their limitations, and tended to perform better in a specific setting. The aim of the CADM was to create a model that would comprehensively explain the path to action in all behavioural situations. Klöckner (Citation2013) developed the CADM further. This new model integrates the theory of planned behaviour, the norm-activation theory, the value-belief-norm-theory and habits.
Because of the absence of the EWVs in in the CADM model, it is necessary here to define conceptually the role of EWVs in relation to EA and PEB. This is conceptualization is called the EAPEB model in Figure (Harju-Autti & Kokkinen Citation2014, developed from Partanen-Hertell et al. Citation1999). When individuals with high EA encounter some external physical stimulus, they may realize that there is a need for some action. If their EWV and values support pro-environmental actions, they are motivated to make environmentally friendly choices. Based on an individual’s knowledge and skills, and according to the existing opportunities to act, this intention may manifest in PEB. This, in turn, leads to an improved state of the environment and higher EA. For example, let’s say a man is walking in a street and sees a piece of litter. Because of his high EA (Figure , Box 1), when seeing the litter (Box 2), an idea occurs to him to consider picking the litter up (Box 3). The idea of picking the litter up to make the street look cleaner is well aligned with his EWV and values (Box 4), so he really wants to pick it up (Box 5). However, there should also be a litter bin nearby (Box 6) to support making his intention to act become a concrete PEB (Box 7). This, in turn, will contribute to the state of the environment, strengthen his EA, and will often give him a satisfying feeling of empowerment (Box 8) (Partanen-Hertell et al. Citation1999; Harju-Autti & Kokkinen Citation2014).
Figure 1. Environmental awareness (EA) leading to pro-environmental behaviour (PEB), called the EAPEB model (Harju-Autti and Kokkinen, Citation2014, developed from Partanen-Hertell et al. Citation1999).
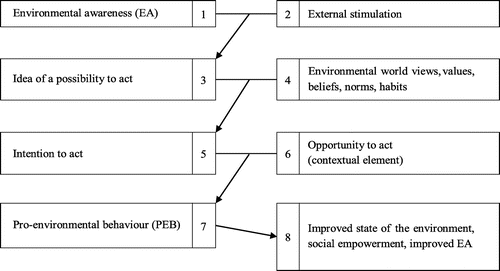
The recent CADM results showed that the strongest predictor of PEB is intentions, followed by habit strength (Klöckner Citation2013). This is well in line with the EAPEB model, since ‘Intention to act’ is very close to PEB (Figure , Box 5) and habits are rather close to intentions (Figure , Box 4).
The values-beliefs-norms (VBN) theory (Stern Citation2000) contains similar elements than the Box 4 in Figure . However, in the VBN theory is not included the ‘Opportunity to act’ (Figure Box 6) taking into account the contextual element such as situational factors. Among others, Steg et al. (Citation2014) has stressed that the situational factors are generally overlooked in environmental behaviour research. For example, distance to a litter bin is a strong predictor of littering behaviour (Schultz Citation2011). Opportunity to act is also included in the CADM model.
The topic of this study, EWVs do not appear in the CADM model. Nevertheless, EWVs do have a noticeable effect on PEB. We could say that high EA leads always to some kind of PEB, but EWVs has an influence on how people behave. If two persons with high EA have very different EWVs, they may both think they exhibit strong PEB even if they act very differently and think that their own life choices are the right way to act. For example, a businessman who has a high EA and a market-liberal worldview has a high chance of becoming interested in corporate social responsibility issues and thus exhibits profound PEB. On the other hand, his schoolmate from economic studies, who has adopted a traditional environmental movement ideology, might find large multinational companies alienating and might choose to work, for example, in a small-scale renewable energy business. Moreover, people’s EWVs are strongly linked to their voting behaviour, which is a central topic later here in the case study.
3. Environmental worldview typology and a new tool for assessing them
3.1. The four environmental worldviews
Clapp and Dauvergne (Citation2011) created a typology of four main worldviews on global environment change. The typology divides EWVs into four categories and serves as an attempt to broaden the academic discussions on environmental theories to also include societal debates about the environment and the political economy. The typology was formed with the intention of having a simple model and to avoid ending up with a plethora of narrowly differentiated categories, meaning that the model is not meant to accurately depict the minute fluctuations of environmental thought but highlight trends that form the typology. The categories were created on the basis of environmental attitudes and worldviews found in the media and literature by thinkers who consider themselves environmentalists.
The four EWVs by Clapp and Dauvergne are bioenvironmentalists, institutionalists, market liberals, and social greens. They are described shortly as follows:
3.1.1. Bioenvironmentalist worldview
Bioenvironmentalism is based on physical science and largely concentrates on the view of planet Earth as an ecosystem, following the principles of the Gaia theory, as presented by James Lovelock (Lovelock Citation2006). Lovelock originally formulated the Gaia theory in the 1960s but he has since updated it. According to him, Earth is a dynamic physiological system that has limited capacity for self-regulation enabling it to maintain suitable conditions on the planet for life. He postulates that Earth is a unified system encompassing both the living and the non-living environment. Earth is an ecosystem, and mankind is dangerously close to exceeding the carrying capacity, if indeed it already has not. Thus, Earth is thought of as a living being that mankind is currently very close to killing. Bioenvironmentalists see increasing human consumption and population growth as the main threats to Earth’s survival. Humans are seen as anthropocentric, selfish beings whose actions need to be restricted. Not all bioenvironmentalists engage directly in discussions on globalization, but those that do tend to view globalisation critically. Globalization is seen as spreading the Western consumerism culture and enabling corporations to move their production to locations with looser environmental standards. Bioenvironmentalists tend to prefer mitigation measures to adaptation. They believe the current issues cannot be controlled without curbs on growth patterns by introducing restricted family planning and economic remodelling. According to this worldview, economic models should be modified to take into account the biophysical limitations of the earth as an ecosystem (Clapp & Dauvergne Citation2011).
3.1.2. Institutionalist worldview
An institutionalist’s view is based on the fields of political science and international relationships, and thus stresses the value of strong global institutions and norms. Institutions are named as the factor controlling the global political economy both at the local and international level. Institutionalists acknowledge the problem of unequal distribution of environmental problems and the means to deal with them, and pinpoint institutions as a necessary source that can bring the solution to the problem, for example, in the sense of providing new technology to poor regions. Institutionalists follow largely market liberals when it comes to globalisation, new technology and sustainable development. However, they argue that globalisation is producing both positive and negative changes for the global environment. A key source of environmental degradation is seen to be the lack of global cooperation. Institutionalists are more concerned with the current state of the globe than market liberals, but remain more positive than bioenvironmentalists. Institutionalists, therefore, are not satisfied with a strictly adaptive strategy but largely support small measures of mitigation. A typical institutionalist believes resolving environmental problems starts with the global transfer of knowledge, financing and technology, and is of the opinion that this can only be accomplished through institutions. Institutionalists do not, however, support all institutions without criticism, but agree that weak and ineffective institutions can be part of the problem, but these should be replaced by a reformed, functioning institution and not demolished (Clapp & Dauvergne Citation2011).
3.1.3. Market liberal worldview
Market liberals are of the opinion that continuous economic growth and increasing per capita income are necessary to reach environmental standards of sustainable development. Market liberals argue that the political will and funds required to improve the state of the environment can only be attained when the population has already achieved a degree of affluence and economic stability. Thus, the poor are not viewed as unconcerned or ignorant, but it is considered unrealistic to hold them to the same environmental standards when their own basic needs have not been met. A recent ideational underpinning of the market liberal worldview posits that we have entered a new geological epoch, Anthropocene, in which the human species is now the dominant Earth-shaping force, radically reconceptualisating the relationship between humanity and nature, reinserting ‘man’ into nature only to re-elevate ‘him’ above it (Baskin Citation2015). Key features differentiating the market liberal view from bioenvironmentalists and social greens is their pro-globalisation attitude. A typical market liberal considers poverty, bad policies, market distortions and lack of economic growth to be the main culprits causing environmental degradation. They believe that the current and future environmental problems can be resolved with the help of ever-improving technology and thus the development of technology should not be hindered by legislative measures. They argue that environmental taxation and pollution trading should be encouraged as incentives for corporations to develop more environmentally friendly technology of their own accord, since, if the economic reality is benevolent towards environmental action, the market itself will drive companies in the right direction. Market liberals tend to be optimistic about the future; some do not acknowledge the existence of an environmental crisis happening now. Market liberal views can be found, for example, in publications of the World Bank and in the Economist (Clapp & Dauvergne Citation2011).
3.1.4. Social greens worldview
Social greens view environmental and social issues as inextricably linked together. Their view contains Marxist features such as considering capitalism to be responsible for spreading social and environmental injustice. Social greens tend to sympathise with the bioenvironmentalist view of biophysical limits and consumption, but do not see population growth as severe a threat as a bioenvironmentalist would. Moreover, the method of family planning suggested by bioenvironmentalists is seen as a violation of human rights and especially as a threat to women’s right to choose for themselves. In contrary to the institutionalist worldview, typically social greens advocate small scale solutions to environmental problems: focusing on local community autonomy to rejuvenate social relations and to restore the natural environment. Globalisation is seen to increase inequality and exploitation, and to further the domination of the rich, as well as Western, patriarchal values. Thus, it is seen as a negative influence. Social greens support the development of self-reliant small-scale economies and stress the value of social aspects, such as a strong sense of community and giving credit to indigenous knowledge systems (Clapp & Dauvergne Citation2011).
3.2. A new tool for assessing environmental worldviews
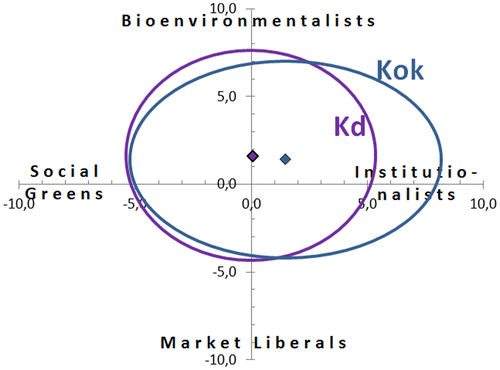
The worldview of an individual seldom has features restricted to just one of the four worldviews described by Clapp and Dauvergne. Instead of just determining which of the four categories fits the individual the best, in this study a two dimensional continuum was invented for the analysis. This continuum is called an Environmental Worldview Graph (EWG), which has two axes that define of individual environmental worldviews.
The exact position of one’s worldview in the two dimensional continuum is calculated from each person’s answers to the survey containing questions that map out the key aspects of the four worldviews (Appendix 1). The questions are, as much as possible, based on the main features of each worldview as determined by Clapp and Dauvergne (Citation2011). The survey has eleven questions (Harju-Autti Citation2012).
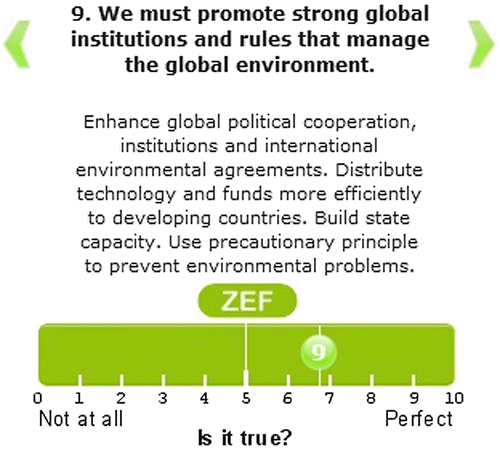
When answering, the respondent had to choose a position on a continuous scale from 0–10, with 0 being ‘Not at all’ and 10 being ‘Yes, definitely/Perfect’. An example question from the survey is shown in Figure . In addition to the eleven questions above, background information on each respondent was collected in the end of the survey.
The respondent’s place on the horizontal axis shows the respondents’ preference on an institutional scale where environmental issues should be handled. Therefore, the x-axis shows the relationship between social greens and institutionalists. Along the plus scale are the institutionalists who believe in strong global cooperation and institutions. Along the minus scale are the social greens, highlighting the importance of local communities and local actors.
The vertical axis describes the respondents’ preferential focus on sustainability/nature over the market/economy. Therefore, the bioenvironmentalists fall on the plus side, whereas market liberals fall within the minus scale (Harju-Autti Citation2012).
In practice, the EWG coordinates were calculated as follows: the location on the x-axis was calculated by adding the values of the institutionalist-specific questions (numbers 3 and 9) and then subtracting the values of the social green-specific questions (numbers 5 and 11). Following the same approach, the placement on the y-axis was calculated by adding the values from the bioenvironmental-specific questions (numbers 4 and 10) and then subtracting the values of the market liberal-specific questions (numbers 2 and 8).
The survey was built on the unique ZEF® survey engine. For popularization and to present the results in a clear, comprehensive manner, at the end of the survey the respondent was shown his/her place in a 2D presentation of worldviews compared to other people.
In addition to determining the respondent’s worldview, the replies to questions 1, 6 and 7 were separately examined to examine the respondent’s views on the existence of an environmental crisis at the moment and views on globalisation.
4. Research environment
4.1. Study groups
Our affiliations to varied political and organizational levels affect our EWVs. For obtaining a large number of data, we assess EWVs not only from Finnish political parties, but also from several organizations, and for some control groups. Therefore, we will be able to put into perspective the results from the Finnish political parties.
EWVs of Finnish political parties were asked from the politicians themselves. Politicians who were approached to take the survey were randomly selected amongst those who had been candidates in the 2012 municipal election, who were members of a municipal government, or who were members of parliament during the 2008–2012 parliamentary term and who had listed their e-mail addresses.
The organizations assessed belong mainly to the public sector actors of the environmental administration and innovation funding in Finland. Organizations in the environmental administration are the Ministry of the Environment (YM), the Finnish Environment Institute (SYKE), and Metsähallitus (MH). Organizations regarding to innovation funding are the Ministry of Employment and the Economy (TEM), the Finnish Funding Agency for Innovation (Tekes), the Finnish Innovation Fund (Sitra), and Finland’s Centres for Economic Development, Transport and the Environment (Regional ELY centres).
In addition, five control groups are assessed: The Finnish Nature League (Luonto-Liitto), Students (University of Oulu), EU Life programme leaders, a French environmental research organization CERTU, and international responses from the Facebook page ‘Environmental Awareness in the World’.
The different EWVs at the political level is presented here as a case study. The context is described in the next chapter.
4.2. A case study Finnish political system
Finland has a parliamentary democracy and therefore has political parties as the channel for political participation. In the 1970s, Giovanni Sartori (Citation1976) developed a typology of party systems that differentiated between four separate systems: the one-party system (e.g. China, the former Soviet Union), the two-party system (e.g. USA), the dominant-party system (e.g. Sweden), and the multi-party system (e.g. Finland) (Paloheimo & Raunio Citation2008). A multi-party system consists of more than two separate parties none of which are singularly dominant over the others and all play a politically consequential role in governing the country. Naturally, every election has a winner, but no party dominates the political reality over extensive periods of time and the government is usually a coalition of two or more parties (Paloheimo & Raunio Citation2008).
In this study we will discuss seven Finnish political parties, presented in Table . The table shows also the number of seats held by each party after the parliamentary election of 2015, and the essential party agenda (Finnish Election Study Portal Citation2014). The Finnish Parliament also includes the Swedish People’s Party, which was excluded from the study, since not enough data on this party was obtained.
Table 1. Parliamentary election 2015 results and party agendas (Finnish Election Study Portal Citation2014).
Regarding the environmental debates in Finland, some of the most acute issues in recent years are:
| • | Should a more environmentally friendly future be targeted even at the cost of economic growth? This includes classical conflicts between the use of natural resources. | ||||
| • | Is climate change mitigation more important than the industrial competivity? | ||||
| • | Should Finland depart from the EU/the ‘Eurozone’? | ||||
| • | How to deal with the global environmental crisis? | ||||
| • | Debate on nuclear power. | ||||
| • | Is globalization good or bad for the environment? This includes debate on Transatlantic Trade and Investment Partnership (TTIP). | ||||
4.3. Earlier environmental worldview studies among politicians
Several studies have focused on politicians’ beliefs and attitudes about environmental issues. Fielding et al. (Citation2012) studied Australian politicians’ beliefs about climate change and how political partisanship affected the politicians’ views. They constructed four different models to predict an individual’s beliefs based on variables such as gender, religious affiliation, education level, location, party affiliation and political ideology. Overall, the left/right placement of a politician’s political ideology was found to be the most important predictor of politicians’ climate change beliefs.
Borick and Rabe (Citation2010) also found that while demographic factors such as age, gender, educational attainment and race did affect an individual’s belief in climate change, by far the most important factor predicting one’s beliefs was political affiliation.
5. Study hypotheses
We form four study hypotheses. The first one is about the adequacy of the methodology:
H1: The EWV methodology produces sound results and pinpoints clearly differences between study groups.
The second hypothesis is formed for our case study:
H2: A politician’s political ideology is a significant predictor of politicians’ EWVs. As a result, clear differences in the two-dimensional worldview space can be distinguished between the political parties. Green League is the most bioenvironmentalist party. The right-wing party National Coalition Party is the among the most Market liberalistic and Institutionalist parties.
The next two hypotheses are based on the descriptions by Clapp and Dauvergne (Citation2011):
H3: Bioenvironmentalists think that there is currently a global environmental crisis. Institutionalists agree more about the global environmental crisis than market liberals but remain more positive than bioenvironmentalists.
H4: Market liberals and institutionalists agree with one another that globalization has positive effects on the environment. Social greens tend to view globalisation critically, and bioenvironmentalists often agree with them.
6. Data gathering
6.1. Determining the respondents
The survey period covered 16 months, from 7 November 2012 to 2 January 2014.
An internet survey was sent out to all selected groups – politicians, organizations, and the control groups. Each respondent group was given an individual email link to identify them from others. The anonymity of all the respondents was guaranteed throughout the process. The responses were collected through an internet survey that did not at any point ask the respondents name.
The number of all responses in the study was 1637. The response percentages of people approached varied between 15 and 35% between different groups targeted. This is a typical result achieved in internet surveys (Heikkilä Citation2004).
7. Results and discussion
7.1. Statistical analysis of all the data
A correlation matrix (Table ) was calculated with the eight questions determining respondents’ EWVs (see Appendix 1). The table included all the data gathered (n = 1637), i.e. both the politicians data (n = 360) and the organizations data (n = 1277).
Table 2. A correlation matrix of all the EWG data (n = 1637). The questions for determining EWGs are numbers 2, 3, 4, 5, 8, 9, 10, and 11 of the survey (Appendix 1).
Questions 2 and 8 had been designed to present market liberal EWVs, questions 3 and 9 for institutionalists, questions 4 and 10 for bioenvironmentalists, and questions 5 and 11 for social greens. Table shows that for each of these question-pairs (see the bolded&underlined numbers), relatively high correlation coefficients were found. The calculated correlation coefficients were between 0.256 and 0.511, which is a promising result. The communalities of the eight variables were rather high (in average 0.34, max. 0.55). Kaiser–Meyer–Olkin measure of sampling adequacy is 0.657 and the Bartlett’s test of sphericity Sig. is 0.000. These results are showing that the data fits well into principal component analysis.
A Principal Component Analysis found two components (Table ) with initial eigenvalues over 1.0. This supports our study premise that two dimensional analysis fits well into the analysis of EWVs.
Table 3. Principal component analysis of all the EWG data (n = 1637).
7.1.1. Extraction method: principal component analysis
Bearing in mind that each of the question-pairs possessed promisingly relatively high correlation coefficients, we create a correlation matrix (Table ) between the four EWVs.
Table 4. A correlation matrix of the four EWVs.
The correlations in the matrix show no significant correlations within p < .0001, except the observed slight negative correlation between the market liberal and bioenvironmentalist EWVs. Therefore, it is adequate to create the 2D axis so that these two slightly negatively correlating EWVs are within one single axis (with bioenvironmentalists on one side of the line and market liberals on the opposite side).
One could say, that the data could have been analyzed by rating perspectives based on their attitudes to economic growth (with market liberals and institutionalists on one side of the line and bioenvironmentalists and social greens on the opposite side). However, this would have been a one-dimensional analysis (a line), i.e. the traditional way of seeing environmentalism. One could also suggest that the analysis and visualization could even have been in 3-D along multiple axes. If the Principal Component Analysis would have found three components with initial eigenvalues over 1.0, the 3D-analysis could have been relevant. But the statistical analysis supports our premise that two dimensional analysis fits well to the analysis of EWVs. The 2D-analysis used in this study has also the strong point that the results are visually easy to present (in an environmental worldview graph).
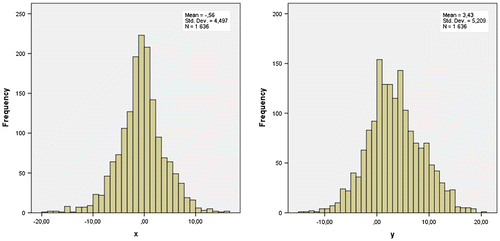
Histograms (Figure ) show the EWG results of all data. They results show that both axes approximate the bell curve of a normal distribution.
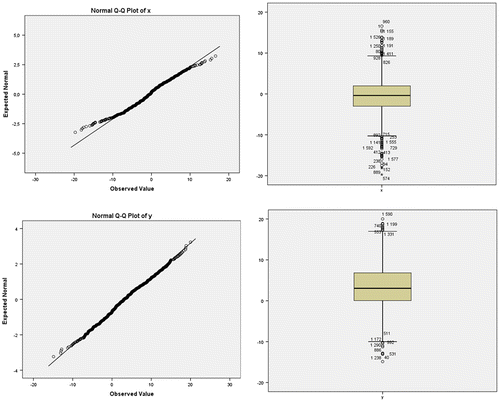
Data descriptives are presented in Appendix 2. Figure shows the QQ plots and box plots of the x and y axis to see whether a data-set is normally distributed. We can see that the data from both the axes is fitting pretty well with a QQ plot trend line, indicating that the original data is roughly normal. Especially the y axis QQ plot results in a very good match with the trend line. Both the box plots show that the data is very symmetric. Thus, the visual inspection of the distribution shows the normality of the data.
Being reminded of what the data basically look like (Figure ), we note that the scatter plot of the data indicates no positive correlation between the two axes. To test whether the two axes x (respondents’ preference on the institutional scale where environmental issues should be handled) and y (respondents’ preferential focus on nature over market forces) are linearly related, a correlation coefficient was calculated. The correlation coefficient –0.255 shows that quite neglible linear relation exists between the two axes (n = 1637).
To sum up, (1) the statistical analysis gave support to that the two-dimensional analysis is fitting well to the analysis of EWVs; (2) neglible linear relation exists between the two EWG axes. These results give support to the H1 that the EWV methodology produces sound results. Next we will analyse the case study results to see if the methodology is able to pinpoint clearly and logically differences between study groups.
7.2. The case study of the politicians’: response percentages, averages and standard deviations
Average scores and standard deviations for each question calculated from all 360 responses from politicians are presented in Table . The results for the questions defining the worldview (2–5 and 8–11) are marked in bold text.
Table 5. Averages and standard deviations of the politicians’ results (n = 360).
The standard deviations have only a small variation, between 1.98 and 2.48. This is a promising result, indicating that the survey has a balanced internal structure.
The respondents’ (n = 1637) average position in the EWG (both the x-axis and y-axis) is calculated by using the equations explained in the Chapter 3.2:
The results show a slight preference for the bioenvironmentalist worldview over the market liberal view.
To put these results into perspective, Appendix 3 shows the results of the respondents’ from several Finnish organizations, and some control groups. When comparing all the data, we see that the findings of the politicians’ results are closely in line with Appendix 3 data.
7.3. Worldviews among the political parties
Results from representatives of political parties (n = 360) are shown in Table . The table shows the average scores and standard deviations for each party. It also shows the minimum and maximum for the EWG ellipses, illustrating the distribution of individual responses from each party. The ellipses have always (1) a centre point, positioned in the average position in both axes; and (2) a minimum and maximum in both axes determined as follows:
Table 6. Averages, standard deviations and ellipse parameters for the political parties.
We analysed the seven political parties’ EWGs in two steps. Firstly, we analysed separately the left-wing parties, right-wing parties and the other parties. Secondly, we compared all the parties with each other and related the findings to the existing research.
From the averages it is clear that the results vary noticeably between different parties. The results on the y-axis vary from 0.8 (the Centre Party – Kesk) to 4.9 (Green League – Vihr). The results on the x-axis vary from −2.1 (Finns Party – PS) to 1.5 (the National Coalition Party – Kok). When looking at the standard deviations, i.e. comparing the sizes of the ellipses, it is noticeable that the Finns Party (PS) has a remarkable higher deviation on both axes than any other party, indicating that the party values have not yet become as solidly established as is the case with the more long-standing parties. On the other end of the deviation scale is the Christian Democrats (KD): standard deviation of this party on both axes is very low. This indicates that members are quite united in their opinions. The ellipse of the Finns Party is 2.4 times larger than the Christian Democrats’ ellipse.
7.3.1. Worldviews of the left-wing parties
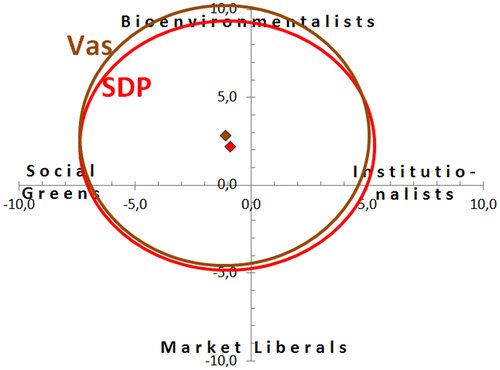
The worldviews of the left-wing parties – the Social Democratic Party of Finland (SDP) and the Left Alliance (Vas) – are presented in Figure . The results between these two parties are very alike. The only difference is that the members of the SDP are slightly more prone towards the institutionalists and market liberal worldview than the members of the Left Alliance. All in all, the EWGs of these two left-wing parties are remarkably close to each other. This is not a surprise, given their similar roots with the leftist movement.
7.3.2. Worldviews of the right-wing parties
In Figure the results for the right wing parties are presented: the National Coalition Party (Kok) and the Christian Democrats of Finland (KD). Compared to the left-wing parties, the right-wing parties are clearly more inclined to favour the institutionalists’ worldview and less prone to that of the bioenvironmentalists. Amongst themselves, on the y-axis, the right-wing parties are very consistent in their results. On the x-axis, however, the EWGs are different: the National Coalition Party favours more the institutionalists’ worldview.
7.3.3. Worldviews of the other parties
The results from the Green League (Vihr), the Centre Party (Kesk) and the Finns Party (PS) are shown in Figure . These three parties’ EWGs all differ noticeably from both the left-wing and right-wing parties. Moreover, they are also very different from each other. This is a natural outcome, since all three parties have very distinct features.
Figure 7. EWGs of the parties other than the left-wing and right-wing parties: Green League, Centre Party and Finns Party.
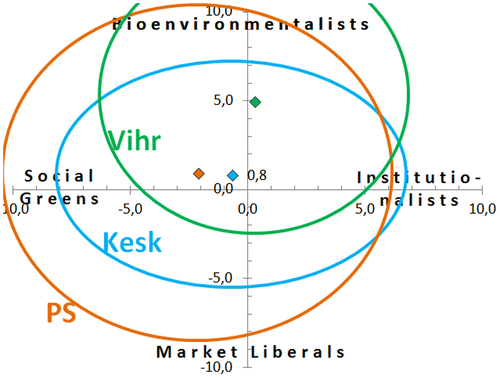
The results of the Centre Party are as expected – in the centre of the coordinate system.
The Green League sets itself apart from any other political party by significantly favouring the bioenvironmentalist view on the y-axis. On the x-axis the results for the Green League are rather closer to zero, with a slight inclination towards the institutionalists’ worldview. Why are the Green League’s results not closer to the Social Greens, i.e. more to the left on the EWG? This will be discussed later when analysing the x-axis results from all parties.
The results for the Finns Party are differentiated from all the other parties’ results by the remarkable size of the ellipse. This means that within the party there are huge differences in worldviews, as exhibited on both axes. Most likely this is because the party is relatively new, and has a recent history of being a protest party (mainly criticism against existing immigration policy). Therefore, it naturally has a wider spectrum of worldviews among its supporters than the older political parties.
7.4. Comparison on the bioenvironmentalist vs. market liberal scale (y-axis)
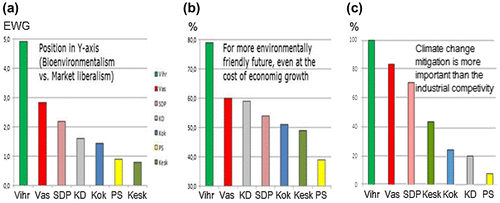
When comparing the parties within the bioenvironmentalist vs. market liberal scale, i.e. the y-axis, we get the results presented in Figure (a). The bioenvironmentalist worldview typically wishes to reduce consumption and encourages economic growth within the limits of sustainability. Therefore, it was expected in the H2 that the Green League shows clearly the strongest support for this view. The Left Alliance (Vas) is also well known to criticise the market liberal worldview, so its position as the next closest to the bioenvironmentalist worldview is not a surprise. The results are compared in Figure (b), to the survey of the national election study consortium (Grönlund & Westinen Citation2012), which asked about ‘the importance of a more environmentally friendly future, even at the cost of economic growth’. These results were gathered from 1300 Finnish voters shortly after the last parliamentary elections in 2011. The results are very similar. Figure (c) shows the parliamentary election candidates’ (2015) average agreement (%) with the statement ‘Climate change mitigation is more important than industrial competence’, indicating bioenvironmental worldview. Again, the order of the political parties is almost the same, showing high consistency of results.
Figure 8. Party politicians’ average positions in the y axis of the EWG (a) compared to the party voters’ (2011) average agreement (%) with a statement indicating bioenvironmental worldview (b); parliamentary election candidates’ (2015) average agreement (%) with a statement indicating bioenvironmental worldview (c).
7.5. Comparison on the institutionalist vs. social green scale (x-axis)
EWG positions of the political parties within the x-axis, i.e. the institutionalist worldview vs. the social greens, are presented in Figure (a). The results show that the National Coalition Party (Kok) mostly favours the institutionalist worldview, which tends to emphasise the role of international cooperation and strong international institutions. Given their conservative, right-leaning agenda, this is a very natural position, responding to the H2. Surprisingly, the position of the Green League (Vihr) is the second closest to the institutionalist view. Why isn’t their worldview closer to the social green worldview, emphasizing local decision-making in communities, as one might expect? To understand this, the above-mentioned study of the national election study consortium which gathered data on 1300 Finnish voters (Grönlund & Westinen Citation2012) provides some answers. In that study, two relevant questions regarding the attitudes towards locality vs. institutions/internationality were found: (1) ‘Members of Parliament detach quickly from the daily problems of ordinary citizens’, and (2) ‘Finland should depart from the EU’. Regarding both of these questions, we get exactly the same results (Figures (b) and (c) as in the worldview study: the Green League (Vihr) is consistently in the second position. These results indicate strongly that the Finnish Green League is actually a very international party by nature. In today’s world, where environmental problems are transnational, this is a relevant position for a modern green party.
Figure 9. Party politicians’ average positions on the EWG x axis, i.e. institutionalist vs. social green scale (a), compared to the average of party voters’ answers on the matter (b and c).
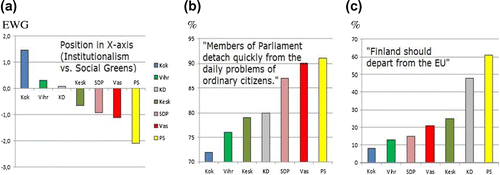
The results show that the Finns Party always favour local decision-making the most. This is not surprising, since as a protest party in Finland they have loudly criticised politicians in general, and the Finnish position in the European Union. The position of the Centre Party on the EWG was somewhat surprising, for it was the most market liberal of the parties.
To sum up, the results show that the EWG pinpoints clearly differences between study groups, responding to the latter part of the H1. To respond to the H2, the results show strong support for the view that the practical results from the voters are well in line with the location of the political parties in the EWG.
7.6. Environmental concern by political party and by environmental worldviews
Environmental concern was characterized with a question ‘Is there currently a global environmental crisis?’. The results are presented in Figure , by political party. Comparing the results to the y-axis results (Figure (a)), we see that bioenvironmentalists are typically of the opinion that there is an environmental crisis.
Figure 10. Answers to the question ‘Is there a global environmental crisis now?’, on a scale from 0 (no crisis at all) to 100 (definitely a crisis) by the political party.
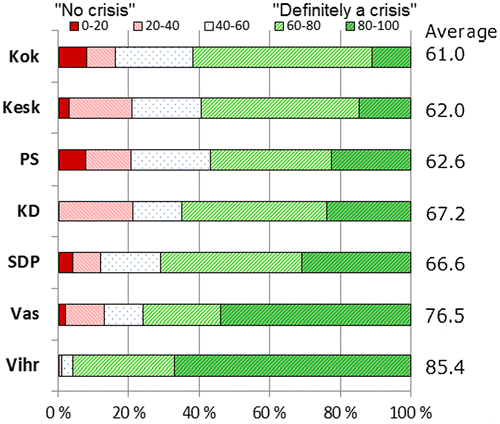
The results show that 96% of the Green League (Vihr) respondents were of the opinion that there is a global environmental crisis at the moment while only 1% disagreed with this statement. After the Green League, the left-leaning parties, i.e. the Social Democratic Party (SDP) and Left Alliance (Vas) agree most that there is a global environmental crisis. The Left Alliance (Vas) respondents have a higher rate of agreement with this question.
The right-leaning parties, i.e. the National Coalition Party (Kok) and the Christian Democrats (KD), agree less in the existence of a global environmental crisis. The National Coalition Party (Kok) has the smallest number of people (11%) that strongly agree on a crisis. However, most of the National Coalition Party respondents (61%) agree somewhat that there is a crisis. The Centre Party (Kesk) and Finns Party (PS) have rather similar results, with almost 60% agreeing somewhat that there is a crisis.
For the question on global environmental crisis, the average answers vary among the political parties from 61.0 (Kok) to 85.4 (Vihr).
Instead of comparing the parties, if we compare the answers with the individuals’ position on the EWG, we see striking differences. Bioenvironmentalists (average: 82.9) and social greens 79.9) agree strongly that there is a global environmental crisis. On the other end of the y-axis, market liberals remain most optimistic (average: 59.0). Institutionalists are in the middle (average: 74.0).These results are exactly as expected in our H3. Bioenvironmentalists think that there is currently a global environmental crisis. Institutionalists agree more about the global environmental crisis than market liberals but remain more positive than bioenvironmentalists.
7.7. Views on globalisation by political party and by environmental worldviews
Globalisation is the process by which all people and communities around the world come to experience an increasingly common economic, social and cultural environment. The rapid global changes in the environment are complex and of a magnitude that significantly affect the planet and how it functions. The degradation of the natural environment calls for effective multilateral cooperation and policy measures which humanity needs to work on together. Globalization, industrial development, and the exploitation of natural resources have had profound environmental and social impacts (Giddings et al. Citation2002; IFSW 2015).
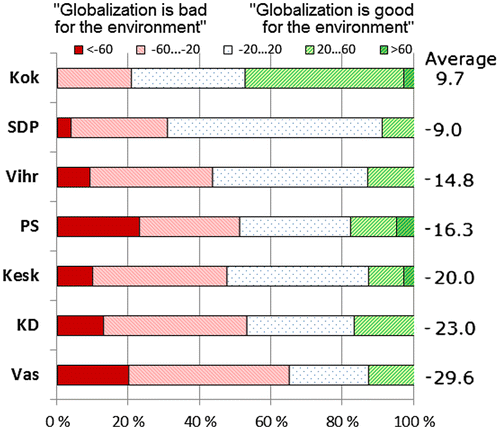
In the survey two questions were related to globalisation. Question 6 (a positive view on globalisation) and question 7 (a negative view) were compared to each other. Therefore, we get values from −100 to +100 with the plus scale scores representing the respondents who view globalisation as good for the environment. The results by party are presented in Figure .
The results show that the views on globalisation are rather mixed from the political parties’ perspective. No significant correlation was found between the views on globalisation and any left- or right-wing party.
In Figure (a), for the right-wing parties, the results for the National Coalition Party (Kok) are as expected, with the highest number of positive views on globalisation (48%) and a third of respondents remaining neutral. On the other hand, the results of the other right-wing party, the Christian Democrats (KD), show that the attitudes of this party are generally negative, with the second highest number of negative views on globalisation (53%).
For the left-wing parties, the Left Alliance (Vas) respondents’ clearly had the most negative point of view (65% of respondents) on globalization. On the other hand, the results of the other left-wing party, the Social Democratic Party (SDP), show that the attitudes of this party are surprisingly neutral, with the second smallest number of negative views on globalisation (31%). A staggering 60% of the SDP politicians do not have a strong view on globalisation. The same number for the Left Alliance was indeed the lowest, only 22%. This shows that the left-wing parties also have very different views on globalisation.
For the Green League (Vihr), the results in Figure (a), show that the responses from this party also have a very high percentage in the neutral zone and only 43% are more conscious of the negative aspects of globalisation. The responses for the Finns Party (PS) and the Centre Party (Kesk) are similar to each other, having no extreme views on globalisation.
When analysing the data from the point of view of individual EWVs, we see in the results (Figure (b)) that the position on the x-axis on EWG shows a striking effect on the attitudes towards globalisation. Social greens tend to view globalisation critically (average: –45.8), and bioenvironmentalists often agree with them (average: –32.4). Market liberals (average: 9.4) and institutionalists (average: 10.6) agree with one another that globalization has positive effects on the environment. These were exactly as stated in the H4.
The EWG results show that the views on globalization follow a different logic from the environmental concern. The opinions on the global environmental crisis were predominantly affected by the position on y-axis, whereas the x-axis predominantly affects the environmental concern. This difference would not have been possible to detect with only a one-dimensional measurement scale (such as NEP) on environmentalism.
8. Conclusion
Conflicts between different organisations or political parties are often caused by enormous differences in their EWVs. While these barriers can be fundamental, better understanding of them can facilitate more harmonious cooperation. In this study a methodology was constructed for an easy-to-use, universally valid online tool for two-dimensional assessment of EWV of any adults. The EWV analysis offers a quick and easy-to-use methodology for measuring individual or group worldviews. There the vertical axis depicts the relationship between market liberals and bioenvironmentalists, and the horizontal axis shows the relationship between social greens and institutionalists. The group to be assessed can be any kind of body, for example, a corporation, an NGO, a community or a political party. The quantitative EWV assessment of different groups can be done ‘on-the-go’, for example in a collaborative seminar, since the survey takes only 3–5 min to answer and the group results can be analysed real-time.
Four hypotheses were formed. EWVs were measured in Finnish political parties, actors in environmental administration, many non-environmental organizations and public innovation funders. After constructing the model, a statistical analysis of the data (n = 1637) was carried out. The statistical analysis showed that (1) the two-dimensional analysis is fitting well to the analysis of EWVs; (2) neglible linear relation exists between the two EWG axes. These results give support to the first hypothesis that the EWV methodology produces sound results and is able to pinpoint clearly differences between study groups.
As a case study, the EWGs of politicians from seven Finnish political parties were analysed. Clear differences in the two-dimensional EWV space were distinguished between the political parties. Green League was found to be the most bioenvironmentalist party. The right-wing party National Coalition Party is among the most Market liberalistic and Institutionalist parties. This was as stated in the Hypothesis 2.
The respondents were also asked about their views on (1) the ongoing global environmental crisis and (2) the effects of globalisation. The respondents’ views towards the global environmental crisis were in line with their political inclination. Moreover, these opinions matched well with the position on the vertical axis of the EWG. Bioenvironmentalists think more than market liberals that there is currently a global environmental crisis. This outcome responded well to the Hypothesis 3.
Finally, the respondents were asked about their views on the effects of globalisation. The results showed clear differences between the political parties. However, no correlation was found between the views on globalization and left/right wing position of the political parties. The views on globalization were also analysed from the point of view of individual EWVs. The results showed that the views on globalization follow a very different logic from the opinions on the existence of a global environmental crisis. The opinions on the global environmental crisis were predominantly affected by the position on y-axis (bioenvironmentalists – market liberals), whereas the x-axis (social greens – institutionalists) predominantly affects the views on globalization. These differences would not have been possible to detect with only a one-dimensional measurement scale (such as NEP) on environmentalism. Thus, social greens usually perceive globalization critically, with bioenvironmentalists often agreeing with them. Market liberals and institutionalists agree with one another that globalization has positive effects on the environment. These were as stated in the Hypothesis 4.
EWV assessment was found to be a universally measurable, easy-to use tool with great potential for individual and organizational analysis. Since the conflicts between different organisations or political parties are often caused by fundamental differences in EWVs, understanding them may foster more constructive decision-making.
Disclosure statement
No potential conflict of interest was reported by the authors.
Funding
This work was supported by the Maa ja Vesitekniikan tuki ry [grant number 29012013]; Oulu University Apteekin Säätiö [grant number 19112013]; and Tauno Tönningin Säätiö [grant number 01042014].
References
- Anderson MW. 2012. New Ecological Paradigm (NEP) Scale. The Berkshire encyclopedia of sustainability. Available from: www.berkshirepublishing.com
- Baskin J. (2015). Paradigm dressed as epoch: the ideology of the anthropocene. Environ Value. 24:9–29.
- Boeve-de Pauw J, Van Petegem P. 2013. A cross-cultural study of environmental values and their effect on the environmental behavior of children. Environ Behav. 45:551–583. 10.1177/0013916511429819.
- Bogner FX, Wiseman M. 1999. Toward measuring adolescent environmental perception. Euro Psychol. 4:139–151.10.1027//1016-9040.4.3.139
- Bogner FX, Wiseman M. 2006. Adolescents’ attitudes towards nature and environment: quantifying the 2-MEV model. Environmentalist. 26:247–254.10.1007/s10669-006-8660-9
- Borick CP, Rabe BG. 2010. A reason to believe: examining the factors that determine individual views on global warming. Soc Sci Quart. 91:777–800.10.1111/(ISSN)1540-6237
- Buttel F. 1996. Environmental and resource sociology: theoretical issues and opportunities for synthesis. Rural Soc. 61:56–76.
- Clapp J, Dauvergne, P. 2011. Paths to a green world: the political economy of the global environment. 2nd ed. Cambridge (MA): The MIT Press; p.354, ISBN 978-0-262-51582-5.
- Dunlap R, Jones R. 2002. Environmental concern: conceptual and measurement issues. In: Dunlap RE, Michelson W, editors. The handbook of environmental sociology. Westport (CT): Greenwood Press; p. 482–524. ISBN 0313268088.
- Dunlap RE, Jones RE. 2003. Environmental attitudes and values. In: Ferna′ndez-Ballesteros R, editor. Encyclopedia of psychological assessment. Vol. 1 . London: Sage; p. 364–369.
- Durnova A. 2013. A tale of ‘Fat Cats’ and ‘Stupid Activists’: contested values, governance and reflexivity in the Brno railway station controversy. J Environ Policy Plan. 1–17. 10.1080/1523908X.2013.829749
- ECLAC. 2000. Role of environmental awareness in achieving sustainable development. Economic Commission for Latin America and the Caribbean. Distr. Restricted. LC/R.1961.
- Fielding KS, et al. 2012. Australian politicians’ beliefs about climate change: political partisanship and political ideology. Environ Polit. 21:712–733.10.1080/09644016.2012.698887
- Finnish Election Study Portal. 2014. Available from: http://www.vaalitutkimus.fi/en/
- Fransson N, Gärling T. 1999. Environmental concern: conceptual definitions, measurement methods, and research findings. J Environ Psychol. 19:369–382.10.1006/jevp.1999.0141
- Giddings B, Hopwood B, O’Brien G. 2002. Environment, economy and society: fitting them together into sustainable development. Sustain Dev. 10:187–196.10.1002/(ISSN)1099-1719
- Grönlund K, Westinen J. 2012. Puoluevalinta, in the publication Muutosvaalit 2011 by Oikeusministeriö. Available from: http://www.oikeusministerio.fi/fi/index/julkaisut/julkaisuarkisto/162012muutosvaalit2011/Files/OMSO_16_2012_Muutosvaalit_2011_352_s.pdf
- Harju-Autti P. 2012. A free online survey for measuring & illustrating individual environmental world views. Available from: http://player.zef.fi/zef2011/ajax/?q=3981-6ebdcd6z
- Harju-Autti P, Kokkinen E. 2014. A novel Environmental Awareness Index, measured cross-nationally for 57 countries. Univ J Environ Res Technol. 3:544–554.
- Heikkilä T. 2004. Tilastollinen tutkimus [Statistical research]. 5th ed. Helsinki: Edita Prima Oy. ISBN 951-37-4135-4.
- Janoušková S, Hák T. 2013. Values and sustainable development: reflection on selected Czech policy documents 1988–2010. J Environ Policy Plan. 15:371–386. 10.1080/1523908X.2013.766577
- Joyner BE, Payne D. 2002. Evolution and implementation: a study of values, business ethics, and corporate social responsibility. J Business Ethics. 41:297–311.10.1023/A:1021237420663
- Klöckner C. 2013. A comprehensive model of the psychology of environmental behaviour—a meta-analysis. Global Environ Change. 23:1028–1038.10.1016/j.gloenvcha.2013.05.014
- Klöckner C, Blöbaum A. 2010. A comprehensive action determination model: toward a broader understanding of ecological behaviour using the example of travel mode choice. J Environ Psychol. 30:574–586.10.1016/j.jenvp.2010.03.001
- Lovelock J. 2006. The revenge of Gaia: why the earth is fighting back – and how we can still save humanity. Santa Barbara (CA): Allen Lane. ISBN 0-7139-9914-4.
- Mainieri T et al. 1997. Green buying: the influence of environmental concern on consumer behaviour. J Soc Psychol. 137.
- Maloney MP, Ward MP, Braucht GN. 1975. A revised scale for the measurement of ecological attitudes and knowledge. Am Psychol. 30:787–790. 10.1037/h008439410.1037/h0084394
- Milfont TL, Duckitt J. 2010. The environmental attitudes inventory: a valid and reliable measure to assess the structure of environmental attitudes. J Environ Psychol. 30:80–94.10.1016/j.jenvp.2009.09.001
- Paloheimo H, Raunio T. 2008. Puolueiden rooli ja tehtävät demokratiassa [Roles and duties of political parties in a democracy]. In: Paloheimo H, Raunio T, editors. Suomen puolueet ja puoluejärjestelmä. 1st ed. Helsinki: WSOY Oppimateriaalit Oy; p. 7–25. ISBN 978-951-0-33188-0.
- Partanen-Hertell M, Harju-Autti P, Kreft-Burman K, Pemberton D. 1999. Raising environmental awareness in the Baltic Sea area. Finnish Environment Institute, FE327, ISBN 952-11-1734-6 (pdf), Available as a pdf from: https://helda.helsinki.fi/handle/10138/36461/browse?value=Partanen-Hertell%2C+Marjut&type=author
- Sartori G. 1976. Parties and party systems: a framework for analysis. Cambridge: Cambridge University Press; p. 3–36.
- Schultz P. 2011. Littering in context: personal and environmental predictors of littering behavior. Environ Behav. 1–25. 10.1177/0013916511412179
- Schwartz S. 2012. An overview of the Schwartz theory of basic values. Online Readings Psychol Cult. 2. 10.9707/2307-0919.1116
- Steg, et al. 2014. An integrated framework for encouraging pro-environmental behaviour: the role of values, situational factors and goals. J Environ Psychol. 38:104–115.10.1016/j.jenvp.2014.01.002
- Stern PC. 2000. Toward a coherent theory of environmentally significant behavior. J Soc Issues. 56:407–424.
- Van Liere K, Dunlap R. 1981. Environmental concern: does it make a difference how it’s measured? Environ Behav.
- Weigel R, Weigel J. 1978. Environmental concern: the development of a measure. Environ Behav. 10:3–15. 10.1177/0013916578101001
- Wiidegren O. 1998. The new environmental paradigm and personal norms. Environ Behav. 30:75–100.10.1177/0013916598301004
- Wiseman M, Bogner FX. 2003. A higher-order model of ecological values and its relationship to personality. Pers Indiv Differ. 34:783–794.10.1016/S0191-8869(02)00071-5
Appendix 1. Internet survey for assessing respondents’ EWVs (Harju-Autti Citation2012)
Appendix 2. Descriptives of the EWG data in x and y axis, all respondents (n = 1637)
Appendix 3. Environmental worldview results of the respondents’ from several Finnish organizations, and some control groups
The organizations in the environmental administration:
| • | Finland’s Centres for Economic Development, Transport and the Environment, Environmental unit (Ely-ENV); | ||||
| • | the Finnish Environment Institute (SYKE); | ||||
| • | Metsähallitus (MH); and | ||||
| • | the Ministry of the Environment (YM). | ||||
Organizations regarding to innovation funding in Finland:
| • | Finland’s Centres for Economic Development, Transport and the Environment, non- Environmental unit (Ely-Others); | ||||
| • | the Finnish Innovation Fund (SITRA); | ||||
| • | the Finnish Funding Agency for Innovation (TEKES); and | ||||
| • | the Ministry of Employment and the Economy (TEM). | ||||
Control groups:
| • | International responses from the Facebook page ‘Environmental Awareness in the World’; | ||||
| • | French environmental research organization CERTU; | ||||
| • | EU Life programme leaders (Life); | ||||
| • | The Finnish Nature League (NGO); | ||||
| • | Students in the University of Oulu; and | ||||
| • | European Environmental experts in the EEA and in the EU Green Week. | ||||

