
Abstract
A chemometric class modelling strategy (unequal dispersed classes – UNEQ) was applied for the first time as a possible screening method to monitor the abuse of growth promoters in veal calves. Five serum biomarkers, known to reflect the exposure to classes of compounds illegally used as growth promoters, were determined from 50 untreated animals in order to design a model of controls, representing veal calves reared under good, safe and highly standardised breeding conditions. The class modelling was applied to 421 commercially bred veal calves to separate them into ‘compliant’ and ‘non-compliant’ with respect to the modelled controls. Part of the non-compliant animals underwent further histological and chemical examinations to confirm the presence of either alterations in target tissues or traces of illegal substances commonly administered for growth-promoting purposes. Overall, the congruence between the histological or chemical methods and the UNEQ non-compliant outcomes was approximately 58%, likely underestimated due to the blindness nature of this examination. Further research is needed to confirm the validity of the UNEQ model in terms of sensitivity in recognising untreated animals as compliant to the controls, and specificity in revealing deviations from ideal breeding conditions, for example due to the abuse of growth promoters.
Introduction
Council Directive 96/22/EC, as amended by Directives 2003/74/EC and 2008/97/EC, stipulates that all use of steroids, β-agonists or other substances for the chemical manipulation of animal growth is strictly banned in the European Union (EU). Accordingly, a National Residue Control Plan (NRCP) is drawn up each year by member states to monitor the abuse of growth promoters, involving sampling both on live animals at farm level and on carcasses at slaughterhouses and the subsequent chemical analysis performed by recognised laboratories. Based on the official results of samples taken for analysis by member states during the period 2005–10, a low incidence (around 0.2%) of non-compliances for illegal growth promoters has been reported (EFSA Citation2013). However, the wide availability of anabolic substances on the black market, the seizures of growth-promoting preparations by veterinary officers or the police, and the results of histological screenings of target organs would point to a more widespread use of anabolic agents in meat cattle production than that emerging from the official figures (Courtheyn et al. Citation2002; Cacciatore et al. Citation2009; Stephany Citation2010; Imbimbo et al. Citation2012). Such a discrepancy may be explained by the use of cocktails of different active principles, each at very low dosage, or of drugs retaining the growth-promoting effects of a given class (e.g. steroids) but not included in the list of the molecules subjected to chemical monitoring in the frame of NRCPs (Mooney et al. Citation2009). The issue of designing a battery of screening tests based on the countless biological effects of growth promoters – mainly gonadal steroids, corticosteroids and β-agonists – to target the chemical analyses has been raised by several researchers (for a review, see Nebbia et al. Citation2011) and also by EFSA in a recent opinion on meat inspection of bovine animals (EFSA Citation2013).
Aside from the histological screening, which is routinely applied in the frame of the Italian NRCP, a number of assays have been developed at slaughterhouse level. Changes in the expression of specific genes (Carraro et al. Citation2009; Divari et al. Citation2011; Cannizzo et al. Citation2013) or proteins (Gardini et al. Citation2006) in different target tissues (e.g. muscles, thymus, liver, gonads) have been proposed as indirect biological markers that may be suggestive of the exposure to a number of anabolic substances. A parallel approach involves the investigation of blood-based biomarkers, which have the advantage of being less invasive and theoretically more fit for purpose than the tissue-based ones in that they may be applied over the entire animal breeding cycle and are potentially suitable to high-throughput screening (Mooney et al. Citation2008).
Several serum/plasma components have been proposed as indicators of the exposure to a number of anabolic agents in veal calves, used either alone or in combination. The application of a growth-promoting protocol comprising 17β-oestradiol, clenbuterol and dexamethasone (DEX) resulted in a marked lowering of the serum antioxidant capacity (SAC) in sampling corresponding to the administration of the oestrogen and the β-agonist (Nebbia et al. Citation2003); a superimposing SAC response was observed in veal calves exhibiting serum 17β-oestradiol concentrations above the legal limits (Brambilla et al. Citation2003). By contrast, DEX administration to veal calves according to a growth-promoting schedule caused SAC to increase slightly over both the controls and the pre-treatment values (Carletti et al. Citation2007). A decrease in the circulating levels of cortisol, resulting from the known interference of glucocorticoids (GCs) with the hypothalamic-pituitary axis, has been reported as one of the most reliable indicators of the prolonged exposure to ‘anabolic’ dosages of such hormones, especially in conjunction with other biological tests like the histological screening of thymuses (Vascellari et al. Citation2008, Citation2012). Osteocalcin, a small protein preferentially expressed in bone matrix, closely reflects osteoblast activity (for a review, see Neve et al. Citation2013). Consequently, the detrimental effects of GCs on bone formation and strength are associated with a notable decrease in circulating osteocalcin in humans (O’Brien et al. Citation2004) or in DEX-treated veal calves (Cacciatore et al. Citation2009). Gonadal peptide hormones called inhibins, belonging to the transforming growth factor-β superfamily that regulates the pituitary follicle-stimulating hormone (FSH) secretion, have been proposed as further biomarkers based on their involvement in both gonadal function and in the regulation of bone mass (Suresh et al. Citation2011). A consistent fall in the circulating levels of ir-inhibin, representing the pool of different inhibins reacting with specific antibodies, has been detected in bulls subjected to either oestrogen or androgen treatments (Godfrey et al. Citation1992) or administered with oestrogens and androgens followed by DEX (Cacciatore et al. Citation2009). Finally, decreased serum urea levels are indicative of the exposure to anabolic agents in cattle (Preston et al. Citation1995), in line with their positive effects on body nitrogen balance.
In view of a possible application under field conditions for screening purposes, however, it should be noted that the reliability of all the indirect serum biomarkers mentioned above has been proven under experimental conditions by comparison with matched controls. To provide reference profiles, a database should therefore be established and based on surely untreated veal calves raised under controlled conditions reproducing the current European animal management and breeding standards. In addition, there is increasing evidence that rather than looking at deviations from the ‘normal’ range values of a single biomarker, the combination of multiple biomarkers and the application of multivariate class modelling or discriminant classification techniques may improve the diagnostic potential of screening assays. Either approach has been successfully applied not only in humans for doping detection (Pottgiesser & Schumacher Citation2013), alcohol abuse (Oliveri & Downey Citation2012; Pirro et al. Citation2013), or food origin control (Marini, Bucci, et al. Citation2006; Marini, Magrì, et al. Citation2006), but also in cattle to predict misuse of growth-promoting hormones (Cunningham et al. Citation2009). Among the supervised pattern recognition methods, multivariate class modelling represents a suitable mean for data analysis, whenever a class of interest (i.e., untreated veal calves) has to be mathematically described, for example, on the basis of several biomarkers’ values and with no bias from any other classes in the computation of the model. Compliance of other unknown samples (i.e., objects) to the modelled class can be investigated in decision-making processes (Oliveri & Downey Citation2012; Pirro et al. Citation2013). These techniques differ to the more widely used discriminant classification methods. A detailed description of their respective features in a decision-making process is beyond the aim of this article and can be found elsewhere (Oliveri et al. Citation2010; Oliveri & Downey Citation2012; Marini Citation2013; Pirro et al. Citation2013).
A wide portfolio of class modelling methods is available as tools for data analysis (Forina et al. Citation2008; Oliveri & Downey Citation2012; Marini Citation2013). Among them, the unequal dispersed classes (UNEQ) model offers the advantage of working directly on the original variables (i.e., serum biomarkers) and building simple models (Oliveri & Downey Citation2012; Pirro et al. Citation2013). Its simplicity and straightforwardness in the interpretation of the outcomes directly translate in robustness (Seasholtz & Kowalski Citation1993) and ease of introduction in complex interdisciplinary contexts such as that of food safety.
The present study describes the application of the UNEQ class model to define the class of untreated veal calves on the basis of five serum biomarkers (SAC, osteocalcin, urea, cortisol and ir-inhibin) that could be used as an alternative, biologically based, screening strategy for the evaluation of potential growth-promoter abuse.
Materials and methods
Animals and study protocol
The study was performed on two groups of 6–7-month-old male Holstein-Friesian calves. The first group of untreated animals (controls, C) was composed of 50 animals enrolled in the study at 1–2 months of age and reared according to standard programmes of veal production following European Commission Directive 91/629, under controlled conditions, for 5 months. Calves were housed in groups of five and bucket fed with a milk replacer for 10 weeks; the diet was then gradually modified with the addition of a concentrated feed (composed by milk serum and fat) and with the introduction of a fibrous quota (a mixture of cereals in form of flakes). The means ± standard deviations (SD) of animal weight were 51 ± 10.9 and 208 ± 24.5 kg at the beginning and at the end of the study, respectively. Animals were vaccinated against the main viral diseases (IBR, Parainfluenza 3, BRSV and BVDV) (CATTLEMASTER® Pfizer Animal Health, New York, NY, USA). Blood sampling was performed from each animal after 22 weeks of controlled rearing, corresponding to the age of 6–7 months. A second group (unknown, U) was included in the study, consisting of 421 veal calves of the same sex and breed, coming from commercial EU breeding units. Blood samples were taken at the same age intervals as for the controls.
Blood and urine collection
Blood and urine sampling was performed 3–4 weeks before slaughtering, which took place in EU-certified abattoirs. Blood was collected in the morning (09.00–11.00 hours) using 10 ml tubes (Venosafe®, TERUMO) from the jugular vein. After clotting, serum was separated by centrifugation at 1272g for 15 min at RT, divided into aliquots, immediately frozen in liquid nitrogen and then stored at −80°C until analysis. When appropriate, urine samples were concurrently collected after spontaneous micturition, divided into aliquots, immediately frozen in liquid nitrogen and stored at −20°C pending analysis. Particular care was taken at avoiding faecal contamination. Sampling was conducted in the frame of routine controls by licensed veterinarians, avoiding any possible physical pain or stress condition, in accordance with the EU current legislation on animal welfare.
Biomarker assays
Serum levels of osteocalcin, cortisol, ir-inhibin, urea and SAC were evaluated using commercially available kits, adapted for bovine serum, and namely N-MID® Osteocalcin Elisa (IDS, Frankfurt, Germany), Cortisol EIA kit® (Arbor Assays, Ann Arbor, MI, USA), Inhibin Alpha-Subunit (1–32) (Porcine) EIA kit® (Phoenix Pharmaceuticals, Inc., Karlsruhe, Germany), respectively. All analyses were performed as recommended by the manufacturers’ protocols. Osteocalcin, cortisol and ir-inhibin levels were measured by interpolation of the standard curve of log standard concentrations versus normalised absorbances. Serum samples were appropriately diluted with kit buffers for cortisol and ir-inhibin assays to fall within the concentration range of the standard curve. The sensitivity of the osteocalcin assay was 0.5 ng ml−1, whereas that of the inhibin and cortisol assays were 0.04 ng ml−1, and 45.4 pg ml−1, respectively.
Urea concentrations were measured by an enzymatic ultraviolet (UV) method validated for bovine serum (IL TestTM Urea®) using an ILAB Aries spectrophotometer (Instrumentation Laboratory, Bedford, MA, USA). Briefly, urea is hydrolysed enzymatically by urease to yield ammonia and carbon dioxide. The ammonia and α-oxoglutarate are converted to glutamate in a reaction catalysed by L-glutamate dehydrogenase. The rate of NADH disappearance at 340 nm is proportional to the urea concentration in the sample. The sensitivity of the test is 1.7 mg urea dl−1.
The OXY-Adsorbent test was employed to evaluate SAC. The test measures the ability of a serum sample to prevent the oxidative insult induced by a solution of hypochlorous acid. The sensitivity of the OXY-Adsorbent Test amounts to 25 µmol HClO ml−1.
UNEQ class modelling technique
UNEQ is a probabilistic class modelling technique that originated in the work of Hotelling in 1947 (Hotelling Citation1947) and which was introduced into chemometrics by Derde and Massart (Citation1986). It is based on the hypothesis of a multivariate normal distribution in each category and on the use of Hotelling’s T2-statistics to define a class space. Given a real matrix, the class model is defined as the centroid (i.e., the row vector containing the mean values of each variable for the samples of the category being modelled). A closed class space is calculated around the model. The class space is an ellipse in the case of two variables, an ellipsoid in the case of three variables and a hyper-ellipsoid in the case of more than three variables. The eccentricity and the orientation of the ellipse depend on the correlation between the variables and on their dispersion (Oliveri & Downey Citation2012). The equation of the boundary represents a formulation of the squared Mahalanobis distance, which takes into account the correlation among variables for its computation (De Maesschalck et al. Citation2000). The space boundaries – used for the decision-making strategy on unknown samples – are defined by the critical value of T2-statistics, at a predetermined confidence level (p = 1 – 2α) (Forina et al. Citation1995). Whenever the squared Mahalanobis distance of a specific sample is smaller than the critical value (a sample that falls inside the closed boundary), the sample is recognised as ‘compliant’ with the class model, at a selected confidence probability. Conversely, if its squared Mahalanobis distance is larger than the critical value, the sample is rejected by the model (samples falling outside the boundary).
The UNEQ class model of the present study was developed by in-house Matlab (The MathWorks, Inc., Natick, MA, USA) routines.
Model preliminary confirmation analyses
pecimens of thymus, prostate and bulbourethral glands were collected at the abattoir from a representative number of Group U animals, classified as ‘non-compliant’ based on the UNEQ class modelling set-up in this study. Samples were immediately fixed in 10% neutral buffered formalin and stored at RT until paraffin embedding according to standard protocols. Representative sections (4 µm) were stained with haematoxylin and eosin for histological examination, which was performed by certified pathologists. Tissues were classified as ‘negative’, ‘uncertain’ or ‘suspect’ based on the absence or presence of specific histological lesions, in accordance with NRCP recommendations (PNR Citation2013). In particular, the morphology of the thymus parenchyma was evaluated for light or severe adipose tissue infiltration and consequent cortical atrophy. As for prostate and bulbourethral glands, hyperplasia and light or severe metaplasia were considered.
Urine and serum samples from a representative number of Group U animals, classified as ‘non-compliant’ on the basis of the UNEQ class modelling, were submitted for chemical analysis to an ISO 17025-accredited laboratory using methods validated according to Regulation 2002/657/EC. Serum samples were analysed for the presence of natural sexual steroids by gas-chromatography-high-resolution mass spectrometry (GC-HRMS), while the presence of synthetic steroids and GCs in urine samples was detected through LC-MS/MS. A list of the searched analytes and their respective LOD and LOQ values is reported in .
Table 1. Investigated analytes in serum and urines from veal calves (n = 24) of the ‘unknown’ group.
Results and discussion
The descriptive statistical data for the five examined biomarkers (SAC, osteocalcin, urea, cortisol, ir-inhibin) of group C (n = 50) are reported in . As far as SAC, urea, cortisol and ir-inhibin are concerned, average values from the present study comply with those already documented for the bovine species (Matsuzaki et al. Citation2001; Carletti et al. Citation2007; Mooney et al. Citation2008; Mosher et al. Citation2013). The range of serum osteocalcin levels in calves has been reported as relatively wide (Cacciatore et al. Citation2009; Matsuo et al. Citation2014). Such heterogeneity, reported also for humans, is attributable both to biological variability (e.g. age, diurnal and seasonal variation) and, principally, to the specificity of the commercial assays (Lee et al. Citation2000). Indeed, osteocalcin exhibits a quite short half-life due to the proteolysis in fragments of various molecular weight and stability that gives reason for the divergent results from assays characterised by different immuno-recognition. Nevertheless, the average values found in the control calves are in line with those obtained in bull calves using a commercial kit detecting the same N-terminal mid fragment of osteocalcin as in our study (Matsuo et al. Citation2014). depicts the descriptive statistical data for the examined biomarkers of veal calves from Group U (n = 421).
Table 2. Serum biomarker values from veal calves in the control group (n = 50).
Table 3. Serum biomarker values from veal calves in the unknown group (n = 421).
The UNEQ class modelling technique has been used to study the class of controls (untreated veal calves, C, n = 50) and to define them according to the values of the serum biomarkers mentioned above. Then the UNEQ model was utilised to verify the compatibility of the U samples with the features of the C calves. By this class modelling approach, the decision regarding sample conformity is completely independent from the nature of ‘non-compliant’ samples (e.g. possibly growth-promoter-treated veal calves), and therefore suitable for use in applications where the representativeness of the class of ‘non-compliant’ samples is hardly definable. Indeed, the class of ‘treated calves’ is inherently inhomogeneous because of the various illegal treatments that can be perpetrated involving different classes of compounds (e.g. sexual steroids, GCs, β-agonists, etc.) and administration conditions (e.g. dosages, duration, schedules, combination of active principles) (Courtheyn et al. Citation2002). On the contrary, the class of controls can be defined clearly as veal calves reared under good, safe and highly standardised breeding conditions following European guidelines (EC Directive 91/629), and this is the only class of samples affecting the decision-making process according to the adopted approach.
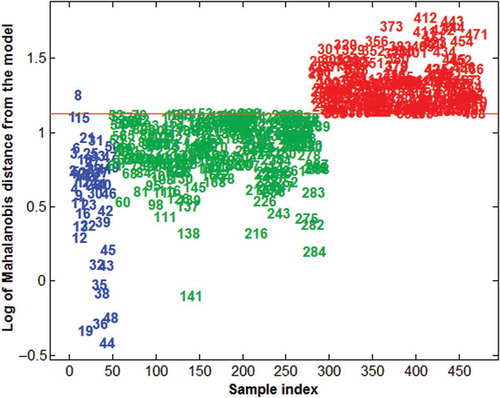
shows the Mahalanobis distance (log scale) of all the controls (C, blue symbols) and the unknowns (U group). The horizontal red line defines the critical distance (based on the T2-statistics) used to discriminate between ‘compliant’ and ‘non-compliant’ samples at a fixed confidence level for the class space (95% of sensitivity). The samples above the line are rejected from the model and identified as different from the controls (182 samples, 43.2% of the total unknown), while the samples with a smaller distance (below the line) are accepted and recognised as ‘compliant’ (239 samples, 56.8% of the total unknowns). In , the order of the unknowns has been arranged so that all the ‘compliant’ cases are grouped together and colour labelled in green, while all ‘non-compliant’ cases are grouped sideways and colour labelled in red.
Figure 1. Distribution of the Mahalanobis distance (log values) for Group C and Group U animals. Blue figures = Group C; green figures = Group U, compliant animals; and red figures = Group U, non-compliant animals.
Whenever models are built for decision-making processes, even if confined at a screening level as in our case, validation of the prediction performances of those models is of great importance in order to provide information about their actual validity and usefulness in relation to the studied problem (Forina et al. Citation2008). In this specific study, no further controlled trials have been performed, in that no surely untreated and treated veal calves – outside the training sample set (control calves, Group C) – were available to estimate model sensitivity and specificity, respectively (Forina et al. Citation2008; Oliveri & Downey Citation2012). Nevertheless, a rough estimation of model specificity was indirectly and tentatively estimated by further independent techniques (i.e., chemical and histological examinations) described in the Materials and methods section. In more detail, 52 out of the 182 calves classified as ‘non-compliant’ by the model based on the examined serum biomarkers were selected randomly from farms showing percentages of non-compliance higher than 60% and the corresponding tissue samples submitted to histological examination. Furthermore, 24 serum and urine samples taken randomly from the same calf group (n = 52) were submitted to chemical analysis (). The overall results of both the target tissue histological evaluation and the analytical investigations are depicted in . In veal calves, thymic lesions are typically associated with the prolonged exposure to synthetic halogenated GCs, such as DEX, even at low dosages (Biolatti et al. Citation2005; Cannizzo et al. Citation2008). By contrast, the fraudulent administration of oestrogens alone or associated with other sexual steroids entails the onset of a various degree of epithelial metaplasia in the accessory sex glands (Groot et al. Citation1990, Citation1998; Schilt et al. Citation1998). In our study, 24 samples out of the 52 (46%) investigated calves exhibited lesions in at least one of the examined tissues, and were therefore classified as ‘uncertain’ or ‘suspect’. The large majority of the histological alterations (n = 21) occurred in the thymus, while the prostate (n = 7) and the bulbourethral glands (n = 1) were affected to a lesser extent. Lesions simultaneously involving different target tissues (i.e. thymus and prostate or bulbourethral glands) were observed in five animals. A similar quali-quantitative pattern was reported in two different histological screening surveys conducted in northern and southern Italy, respectively (Regione Piemonte Citation2009; Imbimbo et al. Citation2012). As regards the results of the chemical analyses, none of the 24 serum and urine samples was certified as legally ‘non-compliant’ with respect to any of the investigated analytes. However, amounts of 17β-boldenone and/or prednisolone higher than the respective LODs but lower than the respective LOQs were detected in urine samples from six calves, which did not exhibit histological changes in the examined target tissues. Although scientific evidences suggest that 17β-boldenone and prednisolone may have an endogenous origin in cattle (Scarth et al. Citation2009; Ferranti et al. Citation2013), it should be noted that a relative high incidence of non-compliances for either compound in bovines has been reported in the results from NRCPs performed by EU member states in the 2005–10 period (EFSA Citation2013). The trace urinary levels found in our study might be consistent with the use of very low doses of hormonal active principles for growth-promoting purposes, which is known to be the strategy currently adopted by dishonest breeders (Nebbia et al. Citation2011). Moreover, 17β-boldenone has rapid excretion kinetics, meaning that concentrations below the established LOQ value can be reached in about 36 h, after a single oral administration (Draisci et al. Citation2007). On the other hand, prednisolone undergoes an extensive biotransformation, resulting in most cases in urinary GC levels below the LOD, even during treatment with a growth-promoting schedule (Cannizzo et al. Citation2011). Interestingly, none of the six calves in which trace levels of either analyte (both in one case) could be demonstrated displayed appreciable histological changes in target tissues. Aside from the kinetic characteristics of 17β-boldenone and prednisolone detailed above and the likely use of very low dosages, the lack of correspondence between the histological and the analytical results in such calves might be explained by the peculiar effects of either active principle on target tissues. Furthermore, in calves treated with 17β-boldenone, the epithelial cells of sex accessory glands were characterised by a picture of hypersecretion rather than by epithelial hyperplasia or metaplasia (Groot & Biolatti Citation2004). On the other hand, the administration of prednisolone to beef cattle for growth-promoting purposes did not elicit the lymphocyte depletion and thymus atrophy (Cannizzo et al. Citation2013), as typically observed upon prolonged exposure to other synthetic GCs such as DEX (Vascellari et al. Citation2008).
Figure 2. (colour online) Flow chart of the study.
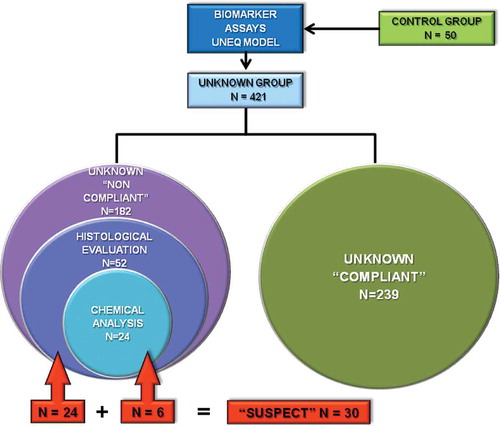
Table 4. Results of the histological evaluation (n = 52) and chemical analysis (n = 24) of selected samples from the ‘unknown veal calves’ group classified as ‘non-compliant’ with respect to the UNEQ class model based on the levels of five serum biomarkers.
Conclusions
In the present study, we have elaborated a multivariate UNEQ analysis on 50 veal calves bred under standard conditions, based on the levels of five serum biomarkers known to reflect the exposure to the main classes of compounds illegally used as growth promoters in veal calves. In the official screening methods, the relatively low sensitivity and specificity of the applied techniques are critical factors in determining the compliance of a given sample. Our model could represent a biologically based alternative screening test in which the unknown samples are rejected (i.e. are considered ‘non-compliant’) based on their distance from a centroid (i.e. the Mahalanobis distance) which takes into account both the absolute biomarkers’ values and their inter-correlations. The application of our statistical approach to 421 commercially bred veal calves resulted in the identification of 182 ‘non-compliant’ individuals, part of which (n = 52) were selected for further histological (n = 52/52) and chemical (n = 24/52) investigations. Our findings indicate that 24 out of the selected 52 calves exhibited histological changes in target tissues (thymus, prostate or bulbourethral glands), and hence classified as uncertain or suspect cases. In addition, trace amounts (< LOQ) of 17β-boldenone or prednisolone were found in urine samples from six calves, which did not show any histological lesions. Overall, the congruence between the histological and chemical methods and the proposed multivariate UNEQ analysis based on serum levels of five selected biomarkers was approximately 58% (30/52). Such a percentage of congruence is likely to be underestimated. Indeed, in our study, blood samplings for biomarker assays were collected 3–4 weeks before slaughter and subsequent tissue collection, a period that closely approaches the duration of the histological signature in cattle thymus (Cannizzo et al. Citation2011) or in bovine male accessory sex glands (Duffour & Grandmontagne Citation1990). As a further line of evidence, routine histological screening tests alone are unsuitable to detect exposure to another class of widely used illicit growth promoters like β-agonists, and only partially able to detect lesions in target tissues from low-dosage sexual steroid-treated calves, unless they are integrated with specific immunohistochemical assays (Cannizzo et al. Citation2007; Pezzolato et al. Citation2013). More to the point, as already outlined in the previous sections, the rapid excretion kinetics of many anabolic compounds in the bovine species as well as the use of different active principle combinations, often at low dosages and/or of unknown structure, greatly limit the general reliability of the chemical analysis. Finally, the list of the analytes used for analytical investigations in the present study did not include β-agonists, which are still used as illegal growth promoters and are able to affect the serum levels of the measured biomarkers (Nebbia et al. Citation2011).
This study only presented a preliminary estimation of method validation. Further experiments are warranted to verify both experimental sensitivity, by analysing other certainly untreated animals, and experimental specificity, by analysing animals that will be purposely treated with growth-promoting substances. Over time, the application of the model on a higher number of samples analysed under diverse conditions will provide a broaden overview of the general applicability of this methodology. The possibility to understand to which extent an illicit treatment can be reflected in a significant variation of the examined serum biomarkers is of interest, as well as the role played by potential confounding factors, for example, stress conditions, diseases or medications, that might alter the panel of biomarkers. Indeed, there is scant information about the effects of physio-pathological events (e.g. stress or diseases) or allowed therapeutic treatments (that should be officially declared) on the levels of the selected biomarkers. However, it should be noted that any such conditions that could alter the biomarker profile and be identified by our model would potentially represent a deviation from a picture representing good, safe and highly standardised breeding conditions. Therefore, the multivariate approach elaborated in this study could be potentially used as a part of quality control programmes in the veal calf industry.
Acknowledgements
The authors wish to thank Mrs Immacolata Carfora for technical assistance and Dr Paolo Oliveri (Department of Pharmacy, University of Genoa, Italy) for contributing to the development of the in-house Matlab routines for data analysis.
Additional information
Funding
References
- Biolatti B, Bollo E, Cannizzo FT, Zancanaro G, Tarantola M, Dacasto M, Cantiello M, Carletti M, Biolatti PG, Barbarino G. 2005. Effects of low-dose dexamethasone on thymus morphology and immunological parameters in veal calves. J Vet Med A Physiol Pathol Clin Med. 52:202–208.
- Brambilla G, Ballerini A, Civitareale C, Fiori M, Neri B, Cavallina R, Nardoni A, Giannetti L. 2003. Oxidative stress as a bio-marker of estrogen exposure in healthy veal calves. Anal Chim Acta. 483:281–288.
- Cacciatore G, Eisenberg SWF, Situ C, Mooney MH, Delahaut P, Klarenbeek S, Huet AC, Bergwerff AA, Elliott CT. 2009. Effect of growth-promoting 17β-estradiol, 19-nortestosterone and dexamethasone on circulating levels of nine potential biomarker candidates in veal calves. Anal Chim Acta. 637:351–359.
- Cannizzo FT, Capra P, Divari S, Ciccotelli V, Biolatti B, Vincenti M. 2011. Effects of low-dose dexamethasone and prednisolone long term administration in beef calf: chemical and morphological investigation. Anal Chim Acta. 700:95–104.
- Cannizzo FT, Miniscalco B, Riondato F, Bollo E, Barbarino G, Giorgi P, Mazzini C, Biolatti B. 2008. Effects of anabolic and therapeutic doses of dexamethasone on thymus morphology and apoptosis in veal calves. Vet Rec. 163:448–452.
- Cannizzo FT, Pegolo S, Cucuzza LS, Bargelloni L, Divari S, Franch R, Castagnaro M, Biolatti B. 2013. Gene expression profiling of thymus in beef cattle treated with prednisolone. Res Vet Sci. 95:540–547.
- Cannizzo FT, Zancanaro G, Spada F, Mulasso C, Biolatti B. 2007. Pathology of the testicle and sex accessory glands following the administration of boldenone and boldione as growth promoters in veal calves. J Vet Med Sci. 69:1109–1116.
- Carletti M, Cantiello M, Giantin M, Nebbia C, Cannizzo FT, Bollo E, Dacasto M. 2007. Serum antioxidant enzyme activities and oxidative stress parameters as possible biomarkers of exposure in veal calves illegally treated with dexamethasone. Toxicol In Vitro. 21:277–283.
- Carraro L, Ferraresso S, Cardazzo B, Romualdi C, Montesissa C, Gottardo F, Patarnello T, Castagnaro M, Bargelloni L. 2009. Expression profiling of skeletal muscle in young bulls treated with steroidal growth promoters. Physiol Genomics. 38:138–148.
- Courtheyn D, Le Bizec B, Brambilla G, De Brabander HF, Cobbaert E, De Wiele AV, Vercammen J, De Wasch K. 2002. Recent developments in the use and abuse of growth promoters. Anal Chim Acta. 473:71–82.
- Cunningham RT, Mooney MH, Xia X-L, Crooks S, Matthews D, O’Keeffe M, Li K, Elliott CT. 2009. Feasibility of a clinical chemical analysis approach to predict misuse of growth promoting hormones in cattle. Anal Chem. 81:977–983.
- De Maesschalck R, Jouan-Rimbaud D, Massart DL. 2000. The Mahalanobis distance. Chemometr Intell Lab Syst. 50:1–18.
- Derde MP, Massart DL. 1986. UNEQ – A class modeling supervised pattern-recognition technique. Mikrochim Acta. 2:139–152.
- Divari S, Mulasso C, Uslenghi F, Cannizzo FT, Spada F, De Maria R, Brina N, Biolatti B. 2011. Progesterone receptor up-regulation: a diagnostic tool for the illicit use of oestrogens in adult beef cattle. Food Addit Contam Part A Chem Anal Control Expo Risk Assess. 28:1677–1686.
- Draisci R, Montesissa C, Santamaria B, D’Ambrosio C, Ferretti G, Merlanti R, Ferranti C, De Liguoro M, Cartoni C, Pistarino E, et al. 2007. Integrated analytical approach in veal calves administered the anabolic androgenic steroids boldenone and boldione: urine and plasma kinetic profile and changes in plasma protein expression. Proteomics. 7:3184–3193.
- Duffour CC, Grandmontagne C. 1990. Evolution of prostate histological pictures after use of new molecules in calf breeding. Rev Med Vet. 141:187–194.
- EFSA. 2013. Scientific Opinion on the public health hazards to be covered by inspection of meat (bovine animals). EFSA J. 11:261.
- Ferranti C, Famele M, Palleschi L, Bozzetta E, Pezzolato M, Draisci R. 2013. Excretion profile of corticosteroids in bovine urine compared with tissue residues after therapeutic and growth-promoting administration of dexamethasone. Steroids. 78:803–812.
- Forina M, Lanteri S, Sarabia L. 1995. Distance and class space in the uneq class-modeling technique. J Chemom. 9:69–89.
- Forina M, Oliveri P, Lanteri S, Casale M. 2008. Class-modeling techniques, classic and new, for old and new problems. Chemometr Intell Lab Syst. 93:132–148.
- Gardini G, Del Boccio P, Colombatto S, Testore G, Corpillo D, Di Ilio C, Urbani A, Nebbia C. 2006. Proteomic investigation in the detection of the illicit treatment of calves with growth-promoting agents. Proteomics. 6:2813–2822.
- Godfrey RW, Lunstra DD, Schanbacher BD. 1992. Effect of implanting bull calves with testosterone propionate, dihydrotestosterone propionate or oestradiol-17 prepubertally on the pituitary-testicular axis and on postpubertal social and sexual behaviour. J Reprod Fertil. 94:57–69.
- Groot MJ, Biolatti B. 2004. Histopathological effects of boldenone in cattle. J Vet Med A Physiol Pathol Clin Med. 51:58–63.
- Groot MJ, Denhartog JMP, Arts CJM, Ossenkoppele JS, Gruys E. 1990. Histological-changes in the prostate of veal calves after the administration of natural hormones. Arch Lebensmittelhyg. 41:37–42.
- Groot MJ, Schilt R, Ossenkoppele JS, Berende PLM, Haasnoot W. 1998. Combinations of growth promoters in veal calves: consequences for screening and confirmation methods. J Vet Med A Physiol Pathol Clin Med. 45:425–440.
- Hotelling H. 1947. Multivariate quality control. In: Eisenhart C., Mw H., Wa W., editors. Techniques of statistical analysis. New York (NY): McGraw-Hill; p. 111–184.
- Imbimbo P, Castigliego L, Armani A, Biolatti B, Cannizzo FT, Gianfaldoni D, Guidi A. 2012. A histologic study on growth promoter target organs of slaughtered beef in Molise region (Italy). J Vet Med Sci. 74:1253–1259.
- Lee AJ, Hodges S, Eastell R. 2000. Measurement of osteocalcin. Ann Clin Biochem. 37:432–446.
- Marini F. 2013. Chemometrics in food chemistry. In: Marini F., editor. Data handling in science and technology. Cambridge (UK): Elsevier; p. 1–512.
- Marini F, Bucci R, Magrì AL, Magrì AD. 2006. Authentication of Italian CDO wines by class-modeling techniques. Chemometr Intell Lab Syst. 84:164–171.
- Marini F, Magrì AL, Bucci R, Balestrieri F, Marini D. 2006. Class-modeling techniques in the authentication of Italian oils from Sicily with a Protected Denomination of Origin (PDO). Chemometr Intell Lab Syst. 80:140–149.
- Matsuo A, Togashi A, Sasaki K, Devkota B, Hirata T-I, Yamagishi N. 2014. Diurnal Variation of Plasma Bone Markers in Japanese Black Calves. J Vet Med Sci. 76:1029–1032.
- Matsuzaki S, Uenoyama Y, Okuda K, Watanabe G, Kitamura N, Taya K, Cruzana MBC, Yamada J. 2001. Prepubertal changes in immunoreactive inhibin concentration in blood serum and testicular tissue in Holstein bull calves. J Vet Med Sci. 63:1303–1307.
- Mooney MH, Le Bizec B, Elliott CT. 2009. Combining biomarker screening and mass-spectrometric analysis to detect hormone abuse in cattle. Trends Analyt Chem. 28:665–675.
- Mooney MH, Situ C, Cacciatore G, Hutchinson T, Elliott C, Bergwerff AA. 2008. Plasma biomarker profiling in the detection of growth promoter use in calves. Biomarkers. 13:246–256.
- Mosher RA, Wang C, Allen PS, Coetzee JF. 2013. Comparative effects of castration and dehorning in series or concurrent castration and dehorning procedures on stress responses and production in Holstein calves. J Anim Sci. 91:4133–4145.
- Nebbia C, Cantiello M, Giuliano Albo A, Gusson F, Dacasto M, Bellino C, Gardini G. 2003. Serum antioxidant status and oxidative stress parameters as biomarkers for illicit treatments with growth promoting agents in veal calves. J Vet Pharmacol Ther. 26:1.
- Nebbia C, Urbani A, Carletti M, Gardini G, Balbo A, Bertarelli D, Girolami F. 2011. Novel strategies for tracing the exposure of meat cattle to illegal growth-promoters. Vet J. 189:34–42.
- Neve A, Corrado A, Cantatore FP. 2013. Osteocalcin: Skeletal and extra-skeletal effects. J Cell Physiol. 228:1149–1153.
- O’Brien CA, Jia D, Plotkin LI, Bellido T, Powers CC, Stewart SA, Manolagas SC, Weinstein RS. 2004. Glucocorticoids act directly on osteoblasts and osteocytes to induce their apoptosis and reduce bone formation and strength. Endocrinology. 145:1835–1841.
- Oliveri P, Casolino MC, Forina M. 2010. Chemometric brains for artificial tongues. Adv Food Nutr Res. 61:57–117.
- Oliveri P, Downey G. 2012. Multivariate class modeling for the verification of food-authenticity claims. Trends Analyt Chem. 35:74–86.
- Pezzolato M, Richelmi GB, Maurella C, Pitardi D, Varello K, Caramelli M, Bozzetta E. 2013. Histopathology as a simple and reliable method to detect 17β-oestradiol illegal treatment in male calves. Food Addit Contam Part A Chem Anal Control Expo Risk Assess. 30:1096–1099.
- Pirro V, Oliveri P, Sciutteri B, Salvo R, Salomone A, Lanteri S, Vincenti M. 2013. Multivariate strategies for screening evaluation of harmful drinking. Bioanalysis. 5:687–699.
- PNR. 2013. [Internet]. [cited 2014 Aug 11]. Available from: http://www.regione.calabria.it/sanita/allegati/dpgr_2013/dpgr_2013/all._dpgr_n._5_-_pnr_2013.pdf.
- Pottgiesser T, Schumacher YO. 2013. Current strategies of blood doping detection. Anal Bioanal Chem. 405:9625–9639.
- Preston RL, Bartle SJ, Kasser TR, Day JW, Veenhuizen JJ, Baile CA. 1995. Comparative effectiveness of somatotropin and anabolic-steroids in feedlot steers. J Anim Sci. 73:1038–1047.
- Regione Piemonte. 2009. [Internet]. [cited 2014 September 16] Available from: http://www.regione.piemonte.it/sanita/cms2/documentazione/category/97-2010?download=978:area-c-piano-regionale-di-controllo-dei-residui-indesiderati-nelle-carni-e-negli-animali-allevati-pdf-180.49-kb
- Scarth J, Akre C, Van Ginkel L, Le Bizec B, De Brabander H, Korth W, Points J, Teale P, Kay J. 2009. Presence and metabolism of endogenous androgenic-anabolic steroid hormones in meat-producing animals: a review. Food Addit Contam Part A Chem Anal Control Expo Risk Assess. 26:640–671.
- Schilt R, Groot MJ, Berende PLM, Ramazza V, Ossenkoppele JS, Haasnoot W, Van Bennekom EO, Brouwer L, Hooijerink H. 1998. Pour on application of growth promoters in veal calves: analytical and histological results. Analyst. 123:2665–2670.
- Seasholtz MB, Kowalski B. 1993. The parsimony principle applied to multivariate calibration. Anal Chim Acta. 277:165–177.
- Stephany RW. 2010. Hormonal growth promoting agents in food producing animals. Handb Exp Pharmacol. 2010:355–367.
- Suresh PS, Rajan T, Tsutsumi R. 2011. New targets for old hormones: inhibins clinical role revisited [Review]. Endocr J. 58:223–235.
- Vascellari M, Capello K, Stefani A, Biancotto G, Moro L, Stella R, Pozza G, Mutinelli F. 2012. Evaluation of thymus morphology and serum cortisol concentration as indirect biomarkers to detect low-dose dexamethasone illegal treatment in beef cattle. BMC Vet Res. 8:129.
- Vascellari M, Pozza G, Poppi L, Capello K, Angeletti R, Ravarotto L, Andrighetto I, Mutinelli F. 2008. Evaluation of indirect biomarkers for detecting corticosteroids used as illegal growth promoters in beef cattle. Vet Rec. 163:147–152.