
ABSTRACT
European manufacturers’ data on acrylamide in potato crisps from 2002 to 2016 were analysed. A previous study showed a 53% reduction in mean acrylamide levels from 763 ng g−1 in 2002 to 358 ng g−1 in 2011. Analysis of data from the longer period showed that since 2011 there has been a levelling off, with the mean level for 2016 being 412 ng g−1 (still a 46% reduction from 2002), suggesting that the most effective acrylamide reduction measures had been devised and implemented by 2011. There were similar trends in the 90th and 95th quantile values, with the 90th quantile values being below 1000 ng g−1 (the European Commission’s current ‘Indicative Value’ for acrylamide in potato crisps) since 2010. The proportion of samples with acrylamide above 2000 ng g−1 fell from 4.8% in 2002 to 0.6% in 2016. Acrylamide levels showed marked seasonal variability, being highest in the first half of the year when potatoes were being used from storage, and lowest from July to September when potatoes were being harvested. Acrylamide levels were higher in thicker types of crisp in the early years of the study, but this difference disappeared in the later years, suggesting that manufacturers had acted to reduce acrylamide formation in these products. Higher values for acrylamide were recorded in north and east Europe than in the south and west up to 2013. Levels in the north and east declined in recent years, but remained higher in the north than in the other regions. The manufacturers’ data were compared with a much smaller dataset provided by the European Food Safety Authority (EFSA). Levels of acrylamide in the EFSA dataset were consistently higher than in the manufacturers’ data, possibly due to uneven sampling through the year and the seasonality of acrylamide levels.
Introduction
Acrylamide (C3H5NO) is a processing contaminant produced predominantly in the Maillard reaction at the high temperatures generated by frying, baking, roasting or high-temperature processing (Nursten Citation2005; Mottram Citation2007; Halford et al. Citation2011). It is classified as a Group 2A, ‘probably carcinogenic to humans’, carcinogen and the latest report from the European Food Safety Authority (EFSA) Expert Panel on Contaminants in the Food Chain (CONTAM) stated that the margins of exposure for dietary acrylamide indicated a concern for neoplastic effects based on animal evidence (EFSA Panel on Contaminants in the Food Chain (CONTAM) Citation2015). Potato, coffee and cereal products are the major contributors to dietary acrylamide intake. For potato products, the majority of surveys conducted in Europe have found potato crisps to account for 0 – 5% of dietary acrylamide intake for adults and the elderly, and 0 – 5% or 5 – 10% for children and adolescents, depending on the survey, while French fries account for 10 – 25% or 25 – 50% of dietary intake for all age groups, with one survey putting the figure higher than 50% for adolescents (EFSA Panel on Contaminants in the Food Chain (CONTAM) Citation2015).
The European Commission issued ‘Indicative Values’ for the presence of acrylamide in food in 2011, based on results reported to EFSA (European Food Safety Authority Citation2011), and revised them downwards for many product types in 2013 (European Commission Citation2013). Indicative Values are not regulatory limits or safety thresholds, but if a product is found to exceed the Indicative Value the relevant food safety authority should take action to ensure that the manufacturer addresses the problem. Currently the Indicative Values for potato crisps and French fries are 1000 and 600 ng g−1, respectively. Furthermore, at the time of writing the European Commission has just opened a public consultation on strengthened risk management measures including compulsory Codes of Practice and the renaming of Indicative Values as Benchmark Levels, with reduced Benchmark Levels of 750 ng g−1 for potato crisps and 500 ng g−1 for French fries (European Commission Citation2017).
Acrylamide forms principally via the deamination and decarboxylation of asparagine (Mottram et al. Citation2002; Stadler et al. Citation2002; Zyzak et al. Citation2003): free asparagine and reducing sugars can therefore be regarded as its precursors (in fact the carbon skeleton is derived entirely from asparagine). In the case of potato tubers, fructose and glucose account for almost all the reducing sugar content, with almost no maltose present. The relationship between precursor concentration and acrylamide formation in potato is complex, with reducing sugars being the major determinants of acrylamide-forming potential in most datasets but free asparagine contributing to the variance in some (Amrein et al. Citation2003, Citation2004; Becalski et al. Citation2004; De Wilde et al. Citation2005; Elmore et al. Citation2007, Citation2010; Shepherd et al. Citation2010; Halford et al. Citation2012b; Muttucumaru et al. Citation2013, Citation2014). Free asparagine concentration has more influence in French fry rather than crisping varieties, probably because French fry varieties contain higher concentrations of sugars (Halford et al. Citation2012b; Muttucumaru et al. Citation2014), and modelling of the relationship between the ratio of free asparagine to reducing sugars in potatoes with unusually low concentrations of free asparagine from a U.K. field trial identified a ratio of free asparagine to reducing sugars of 2.257 ± 0.149 as a tipping point below which free asparagine concentration could affect acrylamide formation (Muttucumaru et al. Citation2017). Another study modelled the kinetics of acrylamide formation in French fry production and concluded that both the fructose/glucose ratio and the ratio of asparagine to total free amino acids could affect acrylamide formation (Parker et al. Citation2012).
Melanoidin pigments and complex mixtures of compounds that impart the flavours and aromas that are associated with fried, baked and roasted foods, also form within the Maillard reaction. This makes acrylamide reduction more problematic because any measures that are taken are likely to affect the characteristics that define products and brands, and are demanded by consumers, as well as the concentration of acrylamide. Nevertheless, the food industry has devised many strategies for reducing acrylamide formation by modifying food processing and these have been compiled in a ‘Toolbox’ produced by FoodDrinkEurope, the latest update of which was published in 2013 (FoodDrinkEurope Citation2013) (this update did not include major changes to the advice on potato crisps). The success of this approach was demonstrated in an analysis of manufacturers’ data on acrylamide levels in potato crisps in Europe from 2002 to 2011, which showed a statistically significant downward trend for mean levels of acrylamide from 763 (±91.1) ng g−1 in 2002 to 358 (± 2.5) ng g−1 in 2011, a decrease of 53% (Powers et al. Citation2013). That study also showed the effect of seasonality arising from the influence of potato storage on acrylamide levels, with acrylamide in the first six months of the year being higher (528 ± 3.2 ng g−1) than in the second six months (372 ± 2.2 ng g−1) (Powers et al. Citation2013). This was consistent with the results of several studies showing an effect of storage on the concentration of reducing sugars and potential for acrylamide formation (De Wilde et al. Citation2005; Halford et al. Citation2012b; Muttucumaru et al. Citation2014; Elmore et al. Citation2015). These studies led to advice being issued that potatoes should only be used for crisping, frying and roasting within their recommended storage window (Halford et al. Citation2012a), and highlighted the challenge faced by the food industry in processing such a variable raw material to give a level of acrylamide in the end-product that consistently complies with Indicative Values.
In the present paper, we analyse manufacturers’ data from 2012 to 2016, together with the 2002 to 2011 data, to enable the trends over the whole period from 2002 to 2016 to be considered.
Materials and methods
Acrylamide determinations
Data on acrylamide levels in samples of potato crisps were supplied by the European Snacks Association, having been collected from European manufacturers over 15 years from 2002 to 2016, inclusive. The samples from 2002 to 2011 that had been analysed previously by Powers et al. (Citation2013) were included to enable trends in the data to be considered for the full period since the presence of acrylamide in food was first reported (Tareke et al. Citation2002). All analyses were carried out using procedures based on liquid chromatography-tandem mass spectrometry (LC-MS/MS) or gas chromatography mass spectrometry (GC-MS) and all the laboratories that conducted the analyses had carried out validations on the methods used. The methods were compatible with the Comité Européen de Normalisation (European Committee for Standardisation) (CEN) standard methods, EN 16618:2015 (Food analysis – Determination of acrylamide in food by liquid chromatography tandem mass spectrometry (LC-ESI-MS/MS)), or FprCEN/TS 17083 (Foodstuffs – Determination of acrylamide in food and coffee by gas chromatography-mass spectrometry (GC-MS) (draft)).
Statistical analyses
For 2012–16 there were 25,986 observations for LC-MS/MS and 7422 for GC-MS. Together with the 40,455 observations which all used LC-MS/MS for 2002–11, this gave 73,863 observations in total for 2002–16. Plots of the data as means, standard errors, 90% and 95% upper percentiles (quantiles) (Q90 and Q95) were produced to give a summary of the differences between years. Further graphical inspection of the data was undertaken to check on seasonal trends by considering monthly means as a time series over the 15 years and monthly means taken over all years. To assess the overall trends over years, analysis of variance (ANOVA) was applied to the natural log (to base e) of the acrylamide data to test for an overall change in mean acrylamide over years (F-test) and then to allow specific comparison of years using the least significant difference (LSD) value at the 5% level of significance (p = 0.05). The data on the loge scale were found to be distributed as Normal and analysis of residuals showed reasonable conformation to the assumptions of ANOVA (Normal distribution, constant variance across factor levels and additivity of effects) (not shown). Further summary statistics were calculated and ANOVA applied to consider the differences between types of product (standard, thick cut and ridge/wave crisps), and between assigned geographical regions (north, south, east and west) from which samples derived, over years. Proportions of observations greater than 1000 and 2000 ng g−1 according to the different factors of interest were also calculated and graphed.
The GenStat (2015, 18th edition, © VSN International Ltd, Hemel Hempstead, UK) statistical package was used for all analyses. The SigmaPlot (version 13, © Systat Software Inc., San Jose, California, US) was used for graphs. Excel (2016, © Microsoft Corporation, US) was used to store the data.
Results
Acrylamide levels in potato crisps from 2002 to 2016
European manufacturers’ data on acrylamide levels in potato crisps was provided for the period 2002 to 2016. For the purposes of the study, a potato crisp is defined as a thin slice of potato (Solanum tuberosum) tuber which has been fried to impart a desirable colour, ‘crisp’ texture and taste via the absorption of hot oils into the potato base and the reduction of moisture content to a specified level. The dataset included observations from every European Union country apart from Estonia, Luxembourg, Malta and Slovenia, as well as observations from Switzerland and Norway.
The data are compiled in Supplementary File S1. For 2012–16 there were 25,986 observations for LC-MS/MS and 7422 for GC-MS. Together with the 40,455 observations which all used LC-MS/MS for 2002–11, this gave 73,863 observations in total for 2002–16, comprising 66,441 that had been quantified by LC-MS/MS and 7422 by GC-MS. Since there was no scientific reason for differentiating between the LC-MS/MS and GC-MS methods, the full dataset of 73,863 observations was analysed.
Analysis of variance (ANOVA) was applied to the data and the means on the log (to base e) scale are given in . The least significant difference (LSD) values at the 5% level of significance, on 73,848 degrees of freedom (), can be used to compare means of interest () to see if there are statistically significant differences between them. Pairs of means on the loge scale that differ by more than the corresponding LSD are significantly different at the 5% (p < 0.05) level. This analysis revealed significant (p < 0.001, F-test) differences between years. As reported previously (Powers et al. Citation2013), the first statistically significant (p < 0.05, LSD) year-to-year reduction in acrylamide was for 2005–2006, but this may in part be due to the low sample number in years 2002–2005, and the lack of samples from early 2002. There were also significant (p < 0.05, LSD) year-to-year reductions for 2007–2008, 2009–2010 and 2010–2011. Since then there has been a levelling off. Indeed, the mean acrylamide level for 2012 was significantly different (p < 0.05, LSD) and greater than that for 2011. The mean values in the following years, 2013 and 2014, were not significantly different (p > 0.05, LSD) from each other, but remained significantly different (p < 0.05, LSD) and greater than the mean in 2011. Finally, the mean in 2015 was marginally significantly different (p < 0.05, LSD) and greater than the means in 2014 and 2016, but with the means in all three years (2014–2016) also being significantly different (p < 0.05, LSD) and greater than the mean in 2011. Therefore, the year when the lowest levels of acrylamide were achieved was 2011.
The raw mean, standard error of the mean, number of observations, 90% and 95% quantiles (Q90 and Q95), and maximum levels of acrylamide for each year, as well as the proportion of samples with greater than 1000 or 2000 ng g−1 are given in , while the means, standard errors, Q90 and Q95 are plotted in . The overall, significant (p < 0.05, LSD) reduction in mean acrylamide achieved between 2002 and 2011 was 53% (±13.5), from 763 (± 91.1) ng g−1 in 2002 to 358 (± 2.5) ng g−1 in 2011 (; Powers et al. Citation2013), and while the mean in 2016 was higher at 412 (± 3.8) ng g−1, it still represented a 46% reduction from 2002.
Table 1. Analysis of variance of acrylamide data for samples of potato crisps from Europe 2002 to 2016 to show differences between years.
Table 2. Acrylamide in samples of potato crisps from 2002 to 2016: Mean (ng g−1), standard error of mean (SE), number of observations (n), 90% and 95% quantiles (Q90 and Q95), maximum levels, and proportion (%) of samples containing greater than 1000 or 2000 ng g−1..
Figure 1. Overall mean acrylamide levels (ng g−1) in samples of potato crisps shown over years from 2002–2016, with standard errors and with trend in 90% and 95% quantiles.
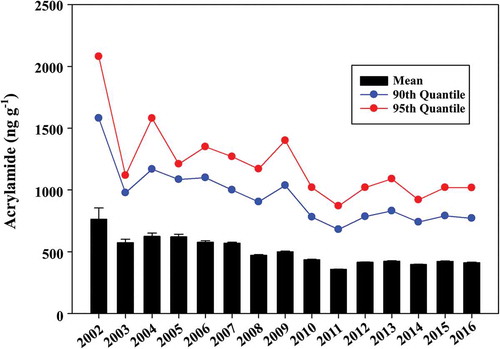
The trends in the Q90 and Q95 values were also downward from 2002 to 2011, followed by a levelling off to 2016 ( and ). The Q90 values have been below 1000 ng g−1, the Indicative Value set for potato crisps by the European Commission in 2011 and reaffirmed in 2013 (European Commission Citation2013), since 2010, while the Q95 was below 1000 ng g−1 in 2011 (870 ng g−1) but marginally above that mark in subsequent years, except for 2014 (920 ng g−1). The proportion of samples containing more than 1000 ng g−1 acrylamide in each year is shown graphically in . Almost a quarter of the samples for 2002 exceeded this level, but the proportion fell to 5.2% by 2010. The highest proportion in the years since then was 6.2% in 2013, while the lowest was 3.2% in 2011. The proportion in 2016 was 5.6%. The proportion of samples having very high acrylamide, above 2000 ng g−1, or twice the Indicative Value, also fell dramatically, from 4.8% in 2002 to 1% in 2010 and below 1% after that ( and ). Indeed, the proportion of samples over 2000 ng g−1 from 2011 to 2015 was at most only three in a thousand, although the proportion in 2016 was slightly higher, at six in a thousand. There was also one year, 2005, when no samples were found to contain over 2000 ng g−1 acrylamide, and another, 2014, with just a single sample over 2000 ng g−1 acrylamide.
Figure 2. Proportion (%) of samples of potato crisps in each year from 2002 to 2016 containing more than 1000 (top) or 2000 ng g−1 (bottom) acrylamide.
Seasonality
The seasonality of acrylamide levels in potato crisps was evident in the study of the 2002–2011 data (Powers et al. Citation2013). The larger dataset available to the present study was analysed in the same way, and the number of observations, mean, standard error of the mean, as well as Q90 and Q95 values for acrylamide for each month are given in . The mean and SE are plotted monthly for 2002–2016 in , and the means with standard errors together with the Q90 and Q95 for each month are displayed separately.
Table 3. Number of observations (n), mean (ng g−1), standard error of mean (SE), 90% and 95% quantile (Q90 and Q95) values for acrylamide in samples of potato crisps from Europe for each month using data from 2002 to 2016. The Q90 and Q95 values are also given for the period from 2011 to 2016. Values other than n are shown in bold where they are greater than 1000 ng g−1..
Figure 3. Seasonality in acrylamide levels in samples of potato crisps from 2002–2016.
Top panel: mean acrylamide levels over time (2002–2016) with standard errors, plotted monthly. Bottom panel: mean acrylamide levels per month over all years with standard errors and with trend in 90% and 95% quantiles.
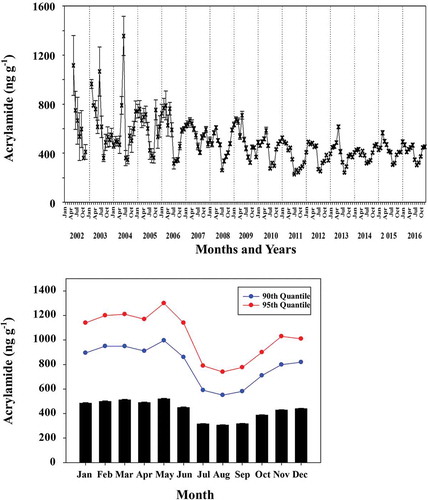
The analysis showed that the trend that was evident in the 2002–2011 data of higher acrylamide levels in the first half of the year continued from 2012 to 2016, despite the lower overall yearly values for acrylamide. Acrylamide levels were at their lowest from July to September each year, before increasing again through October to December. Taking the data for all years together, the Q90 and Q95 also showed clear seasonality, with the Q95 above 1000 ng g−1 and the Q90 above 750 ng g−1 for the whole of the January to June period. This remained the case even for the years from 2011 to 2016 (), i.e. the period when overall acrylamide levels had flattened out.
Crisp types
The dataset was subdivided according to product type; something that had not been attempted in the previous study (Powers et al. Citation2013). This was based on three broad design descriptors: standard, thick cut, and ridge/wave. The standard type had been produced from a slice of potato with a flat or straight surface on both sides (the two largest surface areas) of the slice. Slice thickness was typically greater than 0.127 cm and no more than 0.165 cm across the potato web. The thick cut type was the same except that the slice thickness was equal to or greater than 0.165 cm and typically no more than 0.216 cm across the potato web. The ridge/wave type had been produced from a slice of potato with a ridge/wave or crinkle-cut design on one or both sides (the two largest surface areas) of the slice. Slices were typically greater than 0.165 cm and typically no more than 0.216 cm thick across the potato web, i.e. the same thickness as the thick cut type (while it is possible to produce thinner ridge/wave potato crisps, such products are relatively uncommon as they tend to be more fragile and subject to increased breakage after frying).
There were 58,794 samples of standard crisps, 3574 of the thick cut type and 11,495 of the ridge/wave type, and the means, standard errors, numbers of values, means on the loge scale, Q90, Q95 and maximum values of acrylamide by type and year are given in . ANOVA revealed a significant interaction between type and years (p < 0.001, F-test), indicating that the fluctuation in acrylamide over time was not consistent for the three types. The main effects of types and years were also highly significant (p < 0.001, F-test). The means on the loge and raw scales, with average LSD (5%) for comparisons and standard error, are shown graphically in .
Table 4. Mean (ng g−1), standard error of mean (SE), number of values (n), mean of loge data, Q90, Q95 and maximum values of acrylamide by type and year in samples of potato crisps from Europe 2002 to 2016. Means are shown in bold where they are greater than 1000 ng g−1..
Figure 4. Overall mean acrylamide levels (ng g−1) in samples of potato crisps of different types (standard, thick cut and ridge/wave) shown over years from 2002–2016, on the loge scale showing the average LSD (5%) on 73,822 degrees of freedom (top) and on the raw scale with standard errors (bottom).
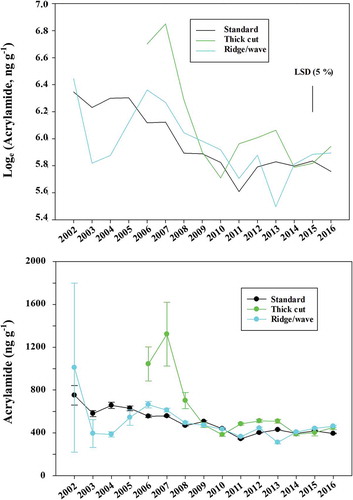
Notably, the mean acrylamide level for the thick cut type was 1044 ng g−1 in 2006, the first year for which data for that type were available, compared with 555 ng g−1 for the standard type, a difference of 88%. It was even higher in 2007 at 1322 ng g−1, more than twice the mean for the standard type of 558 ng g−1. By 2008 it was still approximately 50% higher than for the standard type, but by 2009 it had fallen to the point where there was no significant (p < 0.05, LSD) difference between the two types. The mean acrylamide level for the ridge/wave type, on the other hand, was higher than the standard type in 2002 but lower from 2003 to 2005, albeit with very low sample numbers in those years. In 2006 it was again higher than in the standard type, but as with the thick cut type the difference with the standard type declined in subsequent years. Since 2009 the levels of acrylamide for all three types have come together.
Regions
The dataset was also sub-divided according to the region of Europe (north, south, east or west) from which the samples originated (). Statistical analysis of the full set of data on the loge scale using ANOVA to test the main effects and interactions between regions and years revealed a significant (p < 0.001, F-test) interaction between these factors. The means on the loge scale and the average LSD (5%) on 73,813 degrees of freedom are given in and plotted in , as are the raw means with standard errors. The values of acrylamide in the north and east were generally higher than in the south and west. However, from 2006 onwards in the east and 2013 onwards in the north, acrylamide levels moved progressively towards those in the south and west, although levels in the north remained higher than in the other regions right up to 2016.
Table 5. Grouping of 25 European countries into geographic regions (north, south, east and west) that formed the basis of the regional analysis of acrylamide levels. Note that there were no observations from Estonia, Luxembourg, Malta or Slovenia in the dataset.
Figure 5. Overall mean acrylamide levels (ng g−1) in samples of potato crisps from different regions of Europe (north, south, east and west: ), shown over years from 2002–2016, on the loge scale showing the LSD (5%) on 73,813 degrees of freedom (top) and on the raw scale with standard errors (bottom).
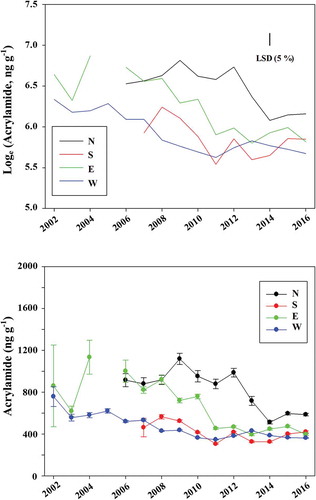
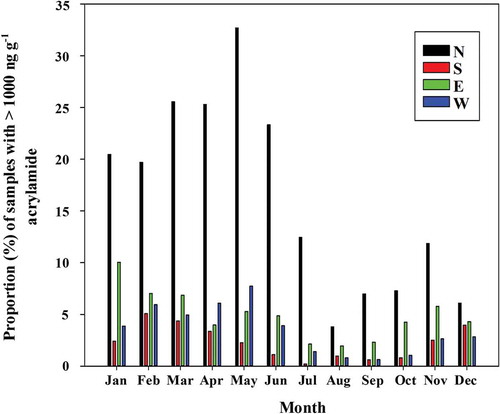
The north not only had higher means than the other regions but also much higher proportions of samples that exceeded the 1000 ng g−1 mark (). Even as late as 2012, the proportion of samples exceeding this level was 39.15%, or almost two in five, and in 2016 it was still 12.41%, or approximately one in eight. This was exacerbated by seasonality, and the proportion of samples exceeding 1000 ng g−1 in each month for the period 2011 to 2016 (the plateau period) is shown graphically in . The problem for the north region in the first half of the year is clearly evident from the graph, with, for example, almost a third (32.67%) of samples for May exceeding 1000 ng g−1 during that period.
Table 6. Mean (ng g−1), standard error of mean (SE), number of values (n), proportion (%) of samples with more than 1000 ng g−1 and mean of loge data for acrylamide by region and year in samples of potato crisps from Europe, 2002 to 2016. Mean values are shown in bold where they are greater than 1000 ng g−1..
Figure 6. Proportion (%) of samples with more than 1000 ng g−1 acrylamide for each month over the period 2011–2016 for geographic regions.
Comparisons with EFSA data
Data from EFSA’s acrylamide monitoring programme for the years 2011 to 2015 were obtained through a public access to documents request and are given in Supplementary File S2. There were 1506 entries in the dataset that were not already included in the manufacturers’ dataset. Of these 1506 entries, 181 had no analytical method recorded, 109 had been obtained using a non-standard analytical method, 45 appeared to be duplicated and three were apparently from unprocessed material (the ‘Data Removed’ tab of Supplementary File S2 details those observations that were excluded). This left 1168 observations for analysis (the ‘Data Analysed’ tab of Supplementary File S2), including 44 cases where the acrylamide value was missing due to it being below the limit of quantification (LOQ) or limit of detection (LOD) values. These were appropriately set at the LOQ or LOD values to avoid exclusion of such important data.
The dataset was a fraction of the size of the manufacturers’ dataset used for the major part of the study. In addition, while the dataset included samples from every month, it was heavily weighted towards March and November because Member States are encouraged to sample in those months, with only 179 of the 1168 samples (15%) coming from the three months of July, August and September, when levels would be expected to be at their lowest. It also contained observations from Estonia, Luxembourg, Malta and Slovenia, which were not represented in the manufacturers’ dataset, but no observations from Bulgaria, Switzerland, Czech Republic, Latvia, the Netherlands, Portugal or Romania.
The means (ng g−1) of the EFSA data were 621 ± 49 for 2011, 600 ± 39 for 2012, 521 ± 37 for 2013, 575 ± 31 for 2014, and 743 ± 47 for 2015, while the proportion (%) of samples exceeding the current Indicative Value of 1000 ng g−1 was 17.5 in 2011, 14.0 in 2012, 14.5 in 2013, 15.9 in 2014 and 22.4 in 2015. Thus, as with the manufacturers’ data, there was little difference between the years. Seasonality (not shown) broadly followed the same trend as shown in for the manufacturers’ data, although there were too few samples in some months to make the analysis meaningful (there were only 11 observations for December in total over all five years, for example). Notably the values were considerably higher than those for the manufacturers’ data: the mean for 2015, for example, was 76% higher than that for the manufacturers’ data for that year (743 compared with 422 ng g−1), with more than four times the proportion of samples exceeding the 1000 ng g−1 level (22.4% compared with 5.2%).
Discussion
We have previously shown (Powers et al. Citation2013) a clear downward trend in manufacturers’ data on acrylamide in potato crisps in Europe between 2002, the year in which the presence of acrylamide in food was first reported (Tareke et al. Citation2002), and 2011. The decrease from 763 ng g−1 in 2002 to 358 ng g−1 in 2011 represented an overall significant (p < 0.05, LSD) reduction of 53%. In the present study, we have shown that acrylamide levels levelled off in subsequent years, with the 2016 figure of 412 ng g−1 actually being higher than that for 2011, although it still represented a 46% reduction from 2002. This suggests that the most effective acrylamide reduction measures had been developed and implemented by 2011, and that 2011 was a particularly good year with respect to low acrylamide-forming potential of the crop. The measures that were implemented included improved control of cooking temperature and duration, monitoring of moisture levels in the finished product, post-frying quality control based on colour, switching to very low-sugar potato varieties, used only within their optimum storage window, and the careful control of storage temperature and conditions. Manufacturers have also introduced checks on potato sugar concentration at time of harvest, during storage and at the factory gate. Selection of potato lots has been prioritised based upon quality of the raw materials and the intended finished product design. It is important that manufacturers continue to monitor latest research and trial new tools as they become available. Possible additional tools that are already available but not widely applied include blanching, vacuum frying or par vacuum frying, and the application of pulsed electric field technology, all of which may be effective in some product types but also impact product cost and quality. Even with additional processing measures, further substantial reductions may not be achievable without a step change in the acrylamide-forming potential of the raw material; in other words, the breeding of potato varieties with much lower concentrations of reducing sugars and/or free asparagine, together with improved stability during cold storage.
Potato varieties with greatly reduced acrylamide-forming potential have been developed and marketed in the U.S.A. by the Simplot Company, using RNA interference (RNAi) to reduce the expression of a tuber-specific asparagine synthetase gene, ASN1 (Rommens et al. Citation2008; Chawla et al. Citation2012). The varieties, called Innate® and Innate® Gen. 2, also have reduced activity of two genes encoding enzymes of starch breakdown, phosphorylase L (PhL) and starch-associated R1 (R1), as well as a gene (PPO5) encoding polyphenol oxidase, an enzyme involved in bruising and, in the case of Innate® Gen. 2, resistance to late blight. However, there is currently no prospect of these or any other genetically modified varieties being grown in Europe. It is possible that similar improvements could be made using a non-GM, genome editing technique such as CRISPR (Song et al. Citation2016). However, the application of that technology to potato is still in development, and there is continued uncertainty over how it will be regulated in Europe. In the meantime, European manufacturers and consumers will have to wait for progress to be made by conventional breeding techniques, which is likely to be relatively slow and limited.
The fact that this study shows acrylamide levels in potato crisps in Europe to have levelled off in recent years is particularly important given that the European Commission has recently opened the public consultation process for its revised risk management measures for acrylamide in food (European Commission Citation2017). The proposals include renaming Indicative Values as Benchmark Levels and reducing the Benchmark Level for potato crisps to 750 ng g−1 (note that the Q90 in our dataset exceeded 750 ng g−1 for half the year, from January to June, even in the plateau period from 2011 to 2016). The proposals also state that the setting of Maximum Levels (MLs) for acrylamide in certain foods should be considered in the future. Indeed, the possibility of MLs being imposed on sectors of the food industry that do not show sufficient progress in reducing acrylamide levels has already been discussed by the European Parliament’s Environment, Public Health and Food Safety Committee (31 January 2017:
http://www.emeeting.europarl.europa.eu/committees/agenda/201701/ENVI/ENVI(2017)0130_1/sitt-3826045). The results of this study suggest that while impressive reductions in acrylamide levels were achieved in potato crisps in the first decade after acrylamide was identified as a problem, further progress, including compensating for differences across the seasons and between regions, may be difficult to achieve.
One factor that might be expected to affect acrylamide in crisps is the design or type of crisp, and that was investigated in this study, with the dataset subdivided according to three broad design descriptors: standard, thick cut, and ridge/wave. Both the thick cut and ridge/wave types were produced from thicker potato slices than the standard type, meaning that the surface area to volume ratio would be lower. However, the study provided no evidence that a thicker cut could reduce acrylamide formation on a per weight basis, suggesting that acrylamide forms throughout the crisp. Indeed, acrylamide levels were higher in the thicker types of crisp in the early years of the study, although this difference had disappeared by the later years, suggesting that there may be more potential for acrylamide to form in thicker crisps but that manufacturers devised and applied measures to counterbalance this. These measures may include the selection of batches of potatoes with the lowest reducing sugar content for products in which the risk of acrylamide formation is high, and/or adaptations to production and design processes.
Another factor that was shown to have an effect on acrylamide levels was the region from which the sample originated, with samples from the north (comprising Denmark, Finland, Lithuania, Latvia, Norway and Sweden), in particular, having higher levels of acrylamide than samples from the other regions, and a much higher proportion of samples exceeding the 1000 ng g−1 mark, particularly in the first six months of the year. There is anecdotal evidence that this is due to environmental rather than varietal effects, with potatoes of the same variety having higher acrylamide-forming potential when grown in the north than they do when grown in other regions. This needs to be confirmed in a scientific study, and research carried out to find an explanation. Lower temperature is one possible cause, but low temperatures would also be experienced by plants growing further south but at higher elevations. Differences in day length may therefore be a more likely explanation: the origins of European potatoes appear to be in equatorial Colombia, with adaptation to the changing day length of higher latitudes a feature of potato’s adoption as a European crop. The striking and enduring seasonality of the proportion of samples with more than 1000 ng g−1 acrylamide in the north also raises questions about the stability of sugar concentrations in potatoes in storage in that region.
The reductions in acrylamide levels in potato crisps that have been achieved in Europe since 2002 represent a clear vindication of the approach taken by the European Commission and industry. Nevertheless, future decisions must be informed by reliable data. The previous study of acrylamide levels in crisps from 2002 to 2011 (Powers et al. Citation2013) discussed the fact that the levels of acrylamide reported by EFSA were consistently higher than those reported by manufacturers (EFSA reported a mean of 675 ng g−1 for 2010, for example, while the mean for the much larger manufacturers’ dataset for 2010 was 435 ng g−1). Comparing the manufacturers’ and EFSA data for 2011 to 2015 (the most recent data provided to us by EFSA) in the present study showed the same trend, with the EFSA data consistently showing higher means and proportions of samples above the current Indicative Value of 1000 ng g−1.
The manufacturers’ data were supplied entirely by companies that are members of the European Snacks Association (ESA), representing approximately 40–50% of potato crisp volume sold across Europe. Awareness of the FoodDrinkEurope Toolbox measures among those companies is high, and the lower acrylamide levels in that dataset could reflect the fact that their products have been subjected to a higher level of acrylamide mitigation measures than perhaps is the case for products produced by non-ESA members. On the other hand, the EFSA dataset may have shown statistical bias because it was comparatively very small and samples were not analysed evenly throughout the year, with relatively few samples coming from July to September, when acrylamide levels would be expected to be at their lowest. Furthermore, many of the acrylamide measurements supplied to EFSA by Member States had to be excluded from our analysis because the analytical method used was not reported, or the values were not quantitated using mass spectrometry, or they were apparent duplicates. This illustrates the need to compile and analyse large and representative datasets, acquired using standardised methods, to produce an accurate picture of the current situation and trends across time and regions that can inform decision-making.
Supplementary_File_S2_revised.xlsx
Download MS Excel (59.9 KB)Supplementary_File_S1.xlsx
Download MS Excel (3.2 MB)Acknowledgements
Rothamsted Research receives grant-aided support from the Biotechnology and Biological Sciences Research Council (BBSRC) of the United Kingdom. The European Snacks Association (ESA) is a trade association representing the European savoury snacks industry on behalf of member snack manufacturers and suppliers into the industry. ESA is guided by a board of directors drawn from member companies. The data presented in this report was provided anonymously by member companies via the ESA Secretariat. ESA member companies had no influence over the data analysis and the views expressed in the paper do not necessarily reflect the views of those ESA member companies.
Disclosure statement
No potential conflict of interest was reported by the authors.
Related Research Data
References
- Amrein TM, Bachmann S, Noti A, Biedermann M, Barbosa MF, Biedermann-Brem S, Grob K, Keiser A, Realini P, Escher F, et al. 2003. Potential of acrylamide formation, sugars, and free asparagine in potatoes: A comparison of cultivars and farming systems. J Agric Food Chem. 51:5556–5560.
- Amrein TM, Schönbächler B, Rohner F, Lukac H, Schneider H, Keiser A, Escher F, Amadò R. 2004. Potential for acrylamide formation in potatoes: data from the 2003 harvest. Eur Food Res Technol. 219:572–578.
- Becalski A, Lau BP-Y, Lewis D, Seaman SW, Hayward S, Sahagian M, Ramesh M, Leclerc Y. 2004. Acrylamide in French fries: influence of free amino acids and sugars. J Agric Food Chem. 52:3801–3806.
- Chawla R, Shakya R, Rommens CM. 2012. Tuber-specific silencing of asparagine synthetase-1 reduces the acrylamide-forming potential of potatoes grown in the field without affecting tuber shape and yield. Plant Biotech J. 10:913–924.
- De Wilde T, De Meulenaer B, Mestdagh F, Govaert Y, Vandeburie S, Ooghe W, Fraselle S, Demeulemeester K, van Peteghem C, Calus A, et al. 2005. Influence of storage practices on acrylamide formation during potato frying. J Agric Food Chem. 53:6550–6557.
- EFSA Panel on Contaminants in the Food Chain (CONTAM). 2015. Scientific opinion on acrylamide in food. EFSA J. 13:4104.
- Elmore JS, Briddon A, Dodson AT, Muttucumaru N, Halford NG, Mottram DS. 2015. Acrylamide in potato crisps prepared from 20 UK-grown varieties: effects of variety and tuber storage time. Food Chem. 182:1–8.
- Elmore JS, Dodson AT, Briddon A, Halford NG, Mottram DS. 2010. The effects of storage on the formation of aroma and acrylamide in heated potato. In: Mottram DS, Taylor AJ, editors. Controlling Maillard pathways to generate flavors. Washington (DC): American Chemical Society; p. 95–109.
- Elmore JS, Mottram DS, Muttucumaru N, Dodson AT, Parry MA, Halford NG. 2007. Changes in free amino acids and sugars in potatoes due to sulfate fertilization, and the effect on acrylamide formation. J Agric Food Chem. 55:5363–5366.
- European Commission. 2013. Commission recommendation of 8 November 2013 on investigations into the levels of acrylamide in food. Brussels: European Commission.
- European Commission. 2017. Establishing mitigation measures and benchmark levels for the reduction of the presence of acrylamide in food. Brussels: European Commission.
- European Food Safety Authority. 2011. Results on acrylamide levels in food from monitoring years 2007-2009 and exposure assessment. EFSA J. 9:2133.
- FoodDrinkEurope. 2013. Acrylamide toolbox 2013. Brussels: FoodDrinkEurope.
- Halford NG, Curtis TY, Muttucumaru N, Postles J, Elmore JS, Mottram DS. 2012a. The acrylamide problem: a plant and agronomic science issue. J Exp Bot. 63:2841–2851.
- Halford NG, Curtis TY, Muttucumaru N, Postles J, Mottram DS. 2011. Sugars in crop plants. Ann Applied Biol. 158:1–25.
- Halford NG, Muttucumaru N, Powers SJ, Gillatt PN, Hartley S, Elmore JS, Mottram DS. 2012b. Concentrations of free amino acids and sugars in nine potato varieties: effects of storage and relationship with acrylamide formation. J Agric Food Chem. 60:12044–12055.
- Mottram DS. 2007. The Maillard reaction: source of flavor in thermally processed foods. In: Berger RG, editor. Flavors and Fragrances: chemistry, bioprocessing and sustainability. Berlin: Springer-Verlag; p. 269–284.
- Mottram DS, Wedzicha BL, Dodson AT. 2002. Acrylamide is formed in the Maillard reaction. Nature. 419:448–449.
- Muttucumaru N, Powers SJ, Briddon A, Elmore JS, Mottram DS, Halford NG. 2014. Evidence for the complex relationship between the concentrations of free amino acids, sugars and acrylamide-forming potential in potato. Ann Applied Biol. 164:286–300.
- Muttucumaru N, Powers SJ, Elmore JS, Dodson A, Briddon A, Mottram DS, Halford NG. 2017. Acrylamide-forming potential of potatoes grown at different locations, and the ratio of free asparagine to reducing sugars at which free asparagine becomes a limiting factor for acrylamide formation. Food Chem. 220:76–86.
- Muttucumaru N, Powers SJ, Elmore JS, Mottram DS, Halford NG. 2013. Effects of nitrogen and sulfur fertilization on free amino acids, sugars and acrylamide-forming potential in potato. J Agric Food Chem. 61:6734–6742.
- Nursten HE. 2005. The Maillard Reaction. Cambridge: Royal Society of Chemistry.
- Parker JK, Balagiannis DP, Higley J, Smith G, Wedzicha BL, Mottram DS. 2012. Kinetic model for the formation of acrylamide during the finish-frying of commercial French fries. J Agric Food Chem. 60:9321–9331.
- Powers SJ, Mottram DS, Curtis A, Halford NG. 2013. Acrylamide concentrations in potato crisps in Europe from 2002 to 2011. Food Addit Contam Part. 30:1493–1500.
- Rommens CM, Yan H, Swords K, Richael C, Ye J. 2008. Low-acrylamide French fries and potato chips. Plant Biotech J. 6:843–853.
- Shepherd LVT, Bradshaw JE, Dale MFB, McNicol JW, Pont SDA, Mottram DS, Davies HV. 2010. Variation in acrylamide producing potential in potato: segregation of the trait in a breeding population. Food Chem. 123:568–573.
- Song G, Jia M, Chen K, Kong X, Khattak B, Xie C, Li A, Mao L. 2016. CRISPR/Cas9: A powerful tool for crop genome editing. Crop J. 4:75–82.
- Stadler RH, Blank I, Varga N, Robert F, Hau J, Guy PA, Robert M-C, Riediker S. 2002. Acrylamide from Maillard reaction products. Nature. 419:449–450.
- Tareke E, Rydberg P, Karlsson P, Eriksson S, Törnqvist M. 2002. Analysis of acrylamide, a carcinogen formed in heated foodstuffs. J Agric Food Chem. 50:4998–5006.
- Zyzak DV, Sanders RA, Stojanovic M, Tallmadge DH, Eberhart BL, Ewald DK, Gruber DC, Morsch TR, Strothers MA, Rizzi GP, et al. 2003. Acrylamide formation mechanism in heated foods. J Agric Food Chem. 51:4782–4787.