
ABSTRACT
Whereas the dramatic environmental impact of plastic waste rightfully receives considerable attention by scientists, policy makers and public in general, the human health impact of micro- and nanoplastics contamination of our food and beverages remains largely unknown. Indeed, most studies aim at understanding the environmental impact rather than the human health impact of a possible exposure to micro- and nanoplastics. In addition, these papers generally lack a methodological, standardised approach. Furthermore, some studies focus on the damage to and contamination level of animal species collected from the wild environment, and others investigate the rate and biology of microplastic uptake of animals fed with microplastics in laboratory. This review aims at understanding human exposure. Since there is, with few exceptions, no evidence available on the presence of micro- and nanoplastics in a normal diet, this study takes an indirect approach and analyses peer-reviewed publications since 2010 that document the presence of micro- and nanoplastics in those animals (more than 200 species) and food products that are part of the human food chain and that may thus contribute directly or indirectly to the uptake of micro- and nanoplastics via the human diet. It also addresses the question of the definitions, the methodologies and the quality criteria applied to obtain the reported results. This review suggests that, beyond a few estimations and comparisons, precise data to assess the exact exposure of humans to micro- and nanoplastics through their diet cannot be produced until standardised methods and definitions are available.
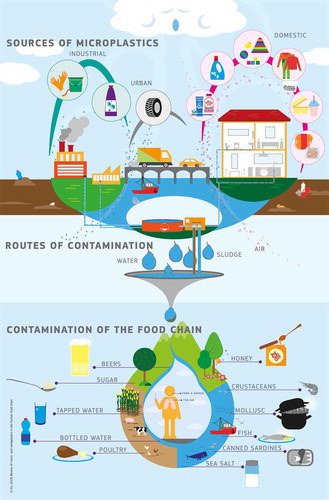
Graphical Abstract
Introduction
Some 300 million tonnes of plastics were produced globally in 2013 (Worldwatch Institute Citation2015). According to the same report, this represents an increase of 4% over the previous year. In Europe, 26% of the plastic produced in 2012 for consumer use was recycled, 36% was incinerated for energy generation and the remaining 38% was disposed of in landfills. The same authors estimate that approximately 10 to 20 million tonnes of plastics finally find their way into the oceans.
Plastic pollution is of critical concern due not only to the increased production and disposal of plastic debris and products but also because of their low biodegradability. Most plastic debris persists in the environment for centuries and may be transported far away from their source. The first priority and fundamental problem to be tackled is undoubtedly the human consumption, use and disposal of plastics (Rist et al. Citation2018).
The appalling example is the Great Pacific Garbage Patch (Moore and Phillips Citation2012; Lebreton et al. Citation2018), also named the 7th continent, in the Pacific Ocean. It is a 1.6 million square kilometres of 79 thousand tonnes of floating plastic garbage (more than three times the size of Spain). Microplastics constitute 94% of the patch in terms of pieces number.
Microplastics, whose definition will be discussed in this paper, are usually considered as debris with sizes below 5 mm (Weinstein et al. Citation2016). They result from the fragmentation of larger plastic objects (secondary microplastics) and from the direct release of small plastic particles from human activities (primary microplastics). Similarly, nanoplastics, with size between 1 and 100 nm (EFSA Citation2016), can be produced by degradation of microplastics or might be released directly from domestic and industrial sources.
Today, micro- and nanoplastics are ubiquitous in the environment. They can be found in indoor and outdoor air, in water and sediments and in terrestrial and aquatic organisms. Their main sources vary but come largely from single-use plastics and fishing gear to clothing and cosmetics, agricultural textiles and runoff, paints, tyres, urban dust. They can pass through wastewater treatment plants that are not specifically designed to retain them. Consequently, they build up at larger population densities (Browne et al. Citation2011) and their distribution is influenced by water and air movements, such as sea currents and winds, and particle density (Engler Citation2012). In particular, oceans accumulate plastics being a natural and final reservoir and consequently ocean flora and fauna are exposed (Li et al. Citation2016).
Whereas the ecological impact of plastic litter is evident clear, there is so far no indisputable evidence of the effects of micro- and nanoplastics on human health. A hypothetical threat to human health from microplastics can occur by the intake of microplastics through the food chain. Food can be contaminated by microplastics either by direct exposure in the environment, or by trophic transfer of microplastics between predators and preys in edible species.
The impact on human health can derive from the chemo-physical nature of the micro- and nanoplastics and the potential tissue damage they can cause, but also from the fact that they might be carriers of potentially toxic chemicals (Mato et al. Citation2001; Rios et al. Citation2007; Teuten et al. Citation2009; Hirai et al. Citation2011; Wegner et al. Citation2012; Rochman Citation2016; Wilkinson et al. Citation2017; Hahladakis et al. Citation2018) and microorganisms (Oberbeckman et al., Citation2015). However, an effective risk assessment can only be done in when conclusive human exposure data become available.
Unfortunately, few data are available on the presence of micro- and nanoplastics in the human diet. Therefore, we took a broad, indirect approach and we performed a critical analysis of peer-reviewed papers on micro- and nanoplastic contaminations in food and in edible animal species since 2010. We retrieved more than 4 200 papers by querying Scopus (Elsevier’s Scopus). The query1 was derived from the ones described in the overview on the presence of microplastics and nanoplastics in food, with a particular focus on seafood as done by the European Food Safety Authority (EFSA Citation2016). By using an in-house developed knowledge management system that categorises papers by assigning keywords, about 500 documents were selected for further reading as they have been categorised as food-related, out of which around 200 papers contained data that could be used in this review. Some of the other papers either did not report data or reported data that were too approximate for our scope. In total, we collected data regarding the microplastic contamination of 201 edible animal species (164 sea fish, 23 molluscs, 7 crustaceans, 2 birds, 2 sweet water fish, 2 turtles, chicken), some food products (canned sardines and sprats, sea salt, sugar and honey), as well as beer and water.
Such an approach should reach a double goal: 1. It should give an overview of the levels of microplastic contamination in the human food chain; 2. It should illustrate the analytical methodologies generally applied and, where gaps are found, should allow the identification of mitigation measures (e.g. development of validated methods and/or (certified) reference materials).
In a recently published paper (Antão Barboza et al. Citation2018), an approach to highlight possible food contamination similar to the one proposed in the present paper was discussed. The authors make a distinction between contamination with microplastics of marine species (they reported studies for about 90 species) that can be part of the human diet and contamination of processed foods and beverages (as 7 different ‘food items’) that are already intended for human consumption and they compiled a list of contaminated organisms. The present paper elaborates the issues further by enlarging the number of species and by reviewing the analytical methodologies used to obtain these contamination levels and the quality assurance measures applied (cross-contamination prevention, blank analysis).
From our review, it is evident that there are two main challenges to assess the human exposure to micro- and nanoplastic in food: 1. The absence of an internationally agreed definition of micro- and nanoplastics; 2. the heterogeneity of the methodologies and experimental designs applied, hampering the reproducibility of the data and therefore not allowing any scientific conclusions to be drawn. For this reason, this paper provides a detailed description of all the aspects to be considered in a proper definition (i.e. particle size, shape and composition) and it reviews the state of the art of the methods available for the detection and characterisation of microplastic particles and the need for standardisation. Furthermore, after defining microplastics and developing standard methodologies, this paper recommends that evaluation of the average consumption levels of all potentially contaminated food products per year per capita, in different regions of the world, would be very useful for the exact assessment of the human exposure to microplastics through the diet.
Routes of contamination
Microplastics are present in all compartments of the environment (Dris et al. Citation2016). Therefore, understanding the microplastics contamination routes of our foods and beverages is a key element towards the evaluation of the extent of food contamination.
The supplementary figure Fig. S1 illustrates both the different sources of microplastic particles (domestic, industrial, agricultural and fishing use/production/waste of products containing plastic particles) and the possible routes by which these particles are released into the environment and eventually may enter the food chain (mostly through water and air). It also reveals the potential spread of microparticles through the environment and their impact on food products and beverages. However, we recognise that the supplementary figure Fig. S1 is simplifying the issue and can only be indicative because microplastics present in an environmental matrix do not per se end up in food products. Instead, typically only very small numbers of plastic particles are found in the food products. Also, a typical food chain is composed of many different intermediate food processing/treatment/distribution steps and each step could potentially cause contamination by microplastics.
Nevertheless, in an attempt to understand the potential human food chain contamination and based on studies described in literature, many of the routes are postulated: contamination of seawater (Buchanan Citation1971; Carpenter and Smith Citation1972; Lusher Citation2015), contamination of soil, waste water and sludge (Zubris and Brian, Citation2005; Browne et al. Citation2011; Mason et al. Citation2016; Steinmetz et al. Citation2016, Citation2016; De Souza Machado et al. Citation2017; Horton et al. Citation2017; Weithmann et al. Citation2018) and contamination of surface and groundwater (Heberer Citation2002; Barnes et al. Citation2008; Díaz-Cruz et al., Citation2008; Loos et al. Citation2010; Faure et al. Citation2012; Eriksen et al. Citation2013; Eerkes-Medrano et al. Citation2015; Zentner et al. Citation2015). Unfortunately, validated and standardised analytical methods providing reproducible and internationally comparable data are often lacking.
Drinking water primarily comes from the depuration and treatment of groundwater and surface water, such as lakes and rivers. However, the contamination of lakes and rivers with microplastics has been demonstrated by several studies and is a well-known problem (Faure et al. Citation2012; Eriksen et al. Citation2013; Eerkes-Medrano et al. Citation2015).
Hence, it is plausible to assume that together with the other contaminants, plastic particles and fibres might also end up in groundwater. However, at this time, only one study was performed on groundwater (Mintening et al. Citation2019, accepted paper). This study reports the analysis of 40 m3 of groundwater in North-West Germany, which is used as drinking water for an area of 7 500 km2. Several samples of water were analysed, both before and after the purification plants. An average of 0.7 microplastic pieces per m3 were detected. This result indicates that the contamination is extremely low at that place. However, with only one study available, the contamination of groundwater remains one of the many knowledge gaps in quantifying the extent of the contamination of our environment by microplastics.
Another route for microplastic contamination of the human food chain is the air. Textile fibres, including microplastics (33%), are present in atmospheric fallout from outdoor and indoor air in concentrations ranging from 0.3 to 1.5 fibres/m3 and from 1.0 to 60.0 fibres/m3 respectively (Dris et al. Citation2017). Regarding the impact on humans, in 1998, Pauly et al. reported that 87% of examined human lungs contained plant (e.g. cotton) and plastic fibres. The inhalation of these fibres is more likely with the decreasing of their size and they can penetrate and persist in lungs (Correia Prata., Citation2018; Gasperi et al. Citation2018). Bigger fibres that cannot be inhaled, though, can deposit within dust, with a deposition rate in indoor environments ranging from 1 586 to 11 130 fibres/day/m2 that represent 190–670 fibres/mg in settled dust. In particular, certain areas show higher risks of microplastics exposure via the air (urban street, industrial workspaces) (Dehghani et al. Citation2017), the presence of plastic fibres released from textiles (Carr Citation2017) or microbeads (e.g. from cosmetic products). Therefore, it cannot be excluded that microplastic fibres can be ingested just by staying for a while, speaking and moving in such an environment, and not only by eating and exposing food to air dust (Dris et al. Citation2017).
Presence of micro- and nanoplastics in food and food products
Micro- and nanoplastics contamination of animals entering the human food chain
Description of the reported studies
illustrates the relative number of studies published since 2010 on different edible and non-edible animal species contaminated by micro- and/or nanoplastics. The majority of the studies available concerns fishes and sea mammals. Bivalves such as mussels, oysters and scallops are the second most studied group. Some edible seabirds have also been studied, but only one report concerns microplastic contamination in meat, in this case chicken gizzards (Huerta Lwanga et al. Citation2017).
Table 1. Number of published studies on microplastic contamination in different animal species, identified by authors since 2010.
Besides the number of published studies, the number of different species contaminated by microplastics is surprisingly high with more than 690 marine species (edible and non-edible) reported to be contaminated (Carbery et al. Citation2018).
As non-edible organisms do not normally enter the human food chain, their direct contribution to microplastic human exposure by food is negligible; hence, they are not discussed further in this review. Typical examples are seabirds (e.g. albatross, auklet, cormorant, fulmar, gull, murre, petrel, puffin, prion, skua, shearwater, tern and phalarope), some marine mammals (e.g. common dolphin, sea lions, seals) but also some small fishes (e.g. dragonet, stellifer), krill, trematode and mosquitos.
Until now, we found 201 edible species – 200 marine species and 1 terrestrial species – reported as ‘affected by the presence of micro- and/or nanoplastics’. The vast majority of marine species can be explained by the main focus on marine pollution.
The only study on a terrestrial animal concerned chicken. In this study, chicken gizzards, that are cooked and eaten by Mexican local populations, were reported to contain microplastics (Huerta Lwanga et al. Citation2017). However, the study was carried out in a particular Mexican village, on chickens living in gardens extensively polluted with plastic wastes and which would have eaten plastic particles as they were exploring the ground for food. The study, based on a very small sample, is not sufficiently representative of a real meat contamination issue. More studies with larger sample amounts should be performed on various farming animals aimed at human consumption to draw any conclusion on meat contamination.
Concerning the marine species, the contamination by microplastic is explained by direct ingestion and by trophic transfer. Microplastics suspended in seawater can be readily ingested by many marine species as their size range coincides with the size of fish eggs and plankton (Browne et al. Citation2008; Boerger et al. Citation2010). Boerger and coworkers found up to centimetre scale plastic fragments in the stomach of 35% of plankton-eating fish caught in the North Pacific Gyre. An average of 2.1 fragments per fish was found. Similar findings were reported in Brazilian estuaries where 18% to 33% of collected catfish were found with plastic particles in their stomachs (Possatto et al. Citation2011). Microplastics can also accumulate in sea sediment (Thompson et al. Citation2004) and be ingested by species living in the benthic zone, the ecological region at the lowest level of the ocean, including the sediment surface and some sub-surface layers. The benthic invertebrate community includes crustaceans and polychaetes. As they are persistent, trophic transfer between species can lead to biological accumulation, the upper trophic level having higher concentrations than the lower (Hollman et al. Citation2013).
Microplastic particles reach the edible marine species either via direct ingestion or trophic transfer. Indeed, microplastics have been detected in the gastrointestinal tract of fish, bivalves, crustaceans and turtles.
In the cases of bony fishes, microplastics that are mostly found in the stomach and guts, are normally removed together with the gastrointestinal tract before consumption. Therefore, they should not have a significant impact on the human exposure to microplastics.
However, the use of fish guts for the preparation of animal feed (e.g. poultry production and pigs rearing) (Bouwmeester et al. Citation2015) could be of concern. Only 40% of fish-derived products are used for human consumption (Malaweera and Wijesundara Citation2014.). The fish and shellfish processing industry produce over 60% by-products as waste. These by-products are fish heads, bones, skin and viscera. They represent a huge amount of nutrients (proteins and minerals). Instead of being disposed, these products can be processed into high-protein feed ingredients for animal feed processing. Feed represents 40–50% of production costs in animal husbandry or farming so that secure, cheap and nutritious feedstuffs are necessary. Fish meal is mixed with other ingredients so that a contamination of animal feed by micro- and nanoplastics cannot be excluded. However, there are no studies on farm animals’ contamination through feeding, neither on the impact on animal health or on meat quality for human consumption. Therefore, it is not possible to report any evidence on that.
On the contrary, animals such as bivalves or small fishes are consumed entirely and can be a source of microplastic contamination in the human diet. In 2016, the European Food Safety Authority (EFSA) published an overview on the presence of microplastics and nanoplastics in food, with a particular focus on seafood (EFSA Citation2016). The EFSA report indicates that the common mussel (M. edulis), cultivated for human consumption, can ingest microplastic particles with sizes ranging from 2 µm to 10 µm. The report also describes that microplastics in bivalves, shrimps and fish can reach average concentrations of 0.2 to 4 microparticles/g, 0.75 particles/g and 1–7 particles/g, respectively. Indeed, Browne and coworkers had already shown the accumulation of polystyrene microspheres (3 and 10 µm) in the gut of M. edulis and their translocation to the circulatory system (Browne et al. Citation2008).
In a more recent study than the EFSA report, Li and coworkers also described the presence of microplastics in mussels along the United Kingdom coasts and in UK supermarkets (Li et al. Citation2018). They found microplastics in all the samples in 8 locations and the 6 supermarkets investigated (0.7 to 2.9 items/g). These results are in the same range as in the EFSA report. In addition, they showed higher contamination levels for wild coastal mussels than for farmed mussels sold in supermarkets. Li et al. hypothesise that there could be a depuration at the end of the farming that would lower the contamination levels. Interestingly, they also reported that processed mussels (frozen, cooked) in some cases appeared to be more contaminated than non-processed mussels. Thus it cannot be excluded that the food processing methods might contribute to the contamination of mussels. They also observed that the size of the microplastic items in mussels were mostly below 250 µm. Concerning the composition of the contaminating items, micro Fourier Transform Infrared spectrophotometry (µFTIR) analysis of the particles identified around 50% as microplastics (polyester, polypropylene and polyethylene), whereas the other 50% were mostly composed of rayon, cotton and cellulose. In this study as in most studies about mussels, the most abundant form of microplastic contamination is fibres.
To give an overview of the microplastic contamination phenomenon in mussels, provides the contamination levels, sample size, sampling location and analytical methods details reported in the literature. The full list of the edible species in which contamination of micro- nanoplastics have been reported, in total 201 animal species, is given in the supplementary material (Table S1.xls).
Table 2. Levels of microplastic contamination in mussels. When reviews cite other papers, the original paper is cited between brackets. ‘Item’ means a microplastic piece. SD indicates Standard Deviation.
Discussion on the reported results
The most studied species for microplastic contamination are blue mussels (Mytilus edulis) Therefore, it is interesting to compare the results obtained on this species by the different studies. Usually, microplastics of different shapes (fibres, particles), sizes and colours are described, but no accurate definition of microplastics currently exists. In , they were referred to as ‘items’. In addition, the units in which results are expressed differ between studies, either mass (number of items/g) or abundance (number of items/individual). The level of contamination of blue mussels across the different studies that express results as a number of items/g, are relatively homogeneous and varies between 0.2 items/g and 2.9 items/g. When also expressed in terms of items/individual, these results correspond to a range of 0 to 10 items/individuals (Van Cauwenberghe et al. Citation2015; Li et al. Citation2018). However, in other studies, expressing results exclusively as items/individuals, we observe higher contamination levels: between 5 and 19 items/individuals (Karlsson et al. Citation2017) and between 33 and 75 items/individuals (Mathalon and Hill Citation2014; Kolandhasamy et al. Citation2018). It is clear that the expression of results as items/g of mussels supposes averaging the results of contaminated and non-contaminated mussels, whereas the expression of results as items/individual does not say clearly if the number of items is averaged on the total number of mussels or only reflects the contamination level of those individuals where microplastics were found. This observation highlights one of the most important challenges in assessing microplastic contamination: the comparability of the results.
Looking further at the data, not only from the blue mussel but also at the data from other edible animal species in the supplementary material (Table S1.xls), it has to be noted that results of microplastic contamination have often been obtained using a huge variety of methodologies. Especially for fishes and turtles, some studies have been conceived and performed with a clear environmental perspective of assessing the presence of microplastics in sea species rather than evaluating the amount of plastics that might enter the human food chain, which affect the study design and result description. The sample size (number of individuals), the sampling location (ocean, coast or market for seafood, the village of origin) as well as the part of the animal that was analysed (stomach or gastrointestinal tract) differ between studies, hence making a reliable comparison of data extremely challenging. For example, the sample size varies from 2 individuals (Rabbitfish) to 1 450 individuals (langoustine).
The most commonly described analytical method in these studies usually involves dissection under a stereoscopic microscope, transfer into covered Petri dish, particle counting and eventually polymer identification using µFTIR (or sometimes, Raman spectroscopy) on selected particles and fibres. However, in some papers, no blank analysis is described and/or no appropriate measures are taken to avoid cross-contamination (use of laminar flow cabinets, cotton labcoats, glass or metal ware; pre-rinsing tools and equipment with distilled water or alcohol; use of open Petri dish to collect and measure airborne contamination). In such cases, the reliability of the data obtained can be questioned. In their study on mussels, for example, Li et al. underlined that, beyond the significant spatial difference in the level of contamination observed in different seawater locations, the variety of abundance of microplastics in mussels could be related to large differences in the extraction method, quantification and in the quality controls and cross-contamination preventions employed (Li et al. Citation2018). For the extraction of the microplastics from the tissue, some studies use acidic or alkaline digestion of the organic tissue, followed by filtration of the microplastics or flotation/sedimentation; whereas other studies only mention dissection under microscope and extraction of microplastics using tweezers.
Regarding the results, the average level of contamination is sometimes accompanied by a standard deviation. The standard deviation, in some cases, is larger than the average, which might reflect either a large scatter of the results and/or an insufficient sample number, not representative of the population. As described for the blue mussel, there is also sometimes a lack of clarity in reporting the number of items/individual taking into account the population of contaminated individuals, only or taking into account the total number of individuals considered for analysis. Finally, a few studies use pools of tissue (e.g. clams, mussels) and do replicate analysis (3 or 6 replicates), but still report results as number of items/g.
These observations indicate the difficulty to extrapolate literature data on seafood for estimating the human dietary intake of microplastics.
Another important remark is that some studies investigated the intake of microplastic by marine species by feeding them with plastic particles in the laboratory with the aim of studying the capacity of marine species to eat microplastics (Xu et al. Citation2017; Ward et al. Citation2003; Wegner et al. Citation2012; von Moos et al. Citation2012; Köhler Citation2010; Farrell and Nelson Citation2013; Browne et al. Citation2008; Ward and Tagart Citation1989; Ward and Kach Citation2009; Claessens et al. Citation2013; Kolandhasamy et al. Citation2018; Sussarellu et al. Citation2014; Brilliant and MacDonald Citation2000, Citation2002; Watts et al. Citation2014; Welden and Cowie, Citation2016b; Oliveira et al. Citation2013; Kaposi et al. Citation2014; Hart Citation1991). However, the microplastic levels to which those species are exposed do not often represent the concentrations in the environment and therefore must be considered with care.
Concerning nanoplastics, only a minimal number of studies evaluate their presence in the human food chain. This fact could be due either to a lack of interest, or to a lack of validated and standardised sampling and analytical methodologies. Some studies describe the capacity of nanoparticles to adsorb on algae (Bhattacharya et al. Citation2010) and to penetrate marine species such as mussels (Ward and Kach Citation2009; Wegner et al. Citation2012), oysters (Ward and Kach Citation2009) and fish (Cedervall et al. Citation2012; Chae and An Citation2017). The trophic transfer of nanoparticles from algae to fish via zooplankton was also described (Cederval et al., Citation2012). However, no peer reviewed study has yet unambiguously demonstrated the presence of nanoplastics in the related food products.
Micro- and nanoplastics contamination of food products, water and beverages via their processing
Description of the reported studies
The contamination of food products, meaning food submitted to a degree of processing, is another challenging issue. It is indeed difficult to judge whether micro- and nanoplastic particles were already in the food before processing or if their presence is the consequence of the processing phase. The same question applies in the case of drinking water and beverages.
Presently, the only studies on microplastics contamination of food products regard honey, sugar, salt, beer, bottled drinking water and canned sardines and sprats. presents their reported levels of contamination. We did not find studies about a possible accumulation effect nor any toxicological effect of these ingested microplastics after consumption of those food products.
Table 3. Levels of contamination reported in honey, beer, salt and water. ‘item’ means microplastic piece.
Although tap water is not really a food product, in that sense that is not filled in bottles and commercialised, it is still processed for purification and sold for distribution. In that perspective, it is presented in .
Discussion on the reported results
Honey, salt, sugar, beer, tap and bottled water (and to a lesser extent canned sardines and sprats) are food products consumed daily. Therefore, the studies reporting their contamination by microplastics should be scrutinised. Some studies concluded there was a significant contamination whereas others found that there was no safety risk. The following section gives more details about the variability of the data and the debates that arose.
Honey
As shown in , Liebezeit et al. published two studies (Liebezeit and Liebezeit Citation2013, Citation2015) reporting the contamination of honey samples from supermarkets and from producers.
In the 2013 study, the authors found an average of 166 ± 147 fibres/kg of honey and 9 ± 9 fragments/kg of honey across different countries. One could note a huge standard deviation. The authors found transparent and coloured fibres and particles.
Cellulose fibres, as well as chitin fragments, were decolourised by the oxidative sample pre-treatment. Therefore, cellulose constituted the majority of the transparent fibres. They were identified as cellulose by further staining with fuchsine. The authors postulated that cellulose fibres might have originated from the clothing of the beekeepers. However, it can also be observed that the use in the sample preparation method of cellulose nitrate filters to filter honey could eventually be another source of cellulose fibre contamination in that study.
Fibres and fragments that were not affected (nor destroyed or decoloured) by the oxidative sample pre-treatment and that could not be stained with fuchsin and rose Bengal were considered as synthetic polymers. The detection method is, therefore, an indirect method. The authors counted the fibres and particles using a microscope but did not further characterise them spectroscopically. The authors suggested that the fibres (and some particles) may come from the environment (atmospheric deposition to the interior of flowers and transported by the bees to the hive), and from honey processing (the longest fibres). The authors also postulated that the fragments (the majority being blue) could have been derived from plastic bags used to supply powdered sugar to the bees.
In the second study (Liebezeit and Liebezeit Citation2015), Liebezeit et al. found 40 to 660 fibres/kg of honey and 0 to 38 fragments/kg of honey in Germany. The authors still did not characterise the fibres and particles but used Rose Bengal to stain natural organic particles and to distinguish them from synthetic ones. However and interestingly, the authors reported that some pollen types, and some string-like fibres and chitin, were not stained and were distinguished from microplastic particles by their morphology. The rest of the non-stained-particles and fibres were counted under the microscope. The authors also found black carbon particles originating from the smoking of the hives, a common practice in bee-keeping to calm bees before harvesting.
Following these studies, Mühlschlegel et al. (Citation2017) investigated whether the honey from Switzerland was effectively contaminated by microplastics, aiming at understanding the origin of the contamination and eventually providing recommendations to bee-keepers to limit the contamination. They preferred using Fourier Transform infrared-attenuated total reflectance FTIR-ATR spectroscopy and Raman spectroscopy to characterise the isolated fibres and particles. Also, they extended the laboratory precautions to avoid sample contamination (use of laminar flow box, ultrapure water, cleanroom-grade gloves); they tested blank samples and they used a honey test sample (kind of home-made honey reference material spiked with ~30 particles of a polymethacrylate particles standard from Fluka). However, they did not provide any recovery data about the standard. The authors also mentioned that the described quality measures could not eliminate limited background contamination (no number given). They finally distinguished five particles classes:
Black carbon particles (1 760 to 8 680 particles/kg), from the application of the smoke.
Coloured fibres (32 to 108 fibres/kg), the majority of which are cellulose-based materials, probably from textile and clothing. Here the authors mentioned that a few black fibres (no exact number given) of polyethylene terephthalate (PET) were also observed, probably originating from textile and related to the beekeepers’ activity.
Blue (8 to 28 particles/kg) and yellow particles (64 particles/kg), the yellow particles being pollen and the blue particles probably related to a coating with copper phthalocyanine pigment.
White or transparent fibres (132 to 728 fibres/kg) assigned to cellulose or chitin.
White or transparent particles (60 to 172 particles/kg) related to cellulose, chitin and glass particles that came from glass abrasion (honey container or laboratory glassware).
The authors concluded that the amount and composition of the particles and fibres detected in the honey samples did not represent a safety risk. In the context of this review on microplastic contamination, we would focus on the black PET fibres (a minor part of the 32 to 108 coloured fibres/kg) and eventually the blue particles (8 to 28 particles/kg) if the coating is covering plastic material. Interestingly, the description of some PET fibres in honey confirms that textiles and clothing are sources of microplastic contamination. However, when compared with the results from Liebezeit (average 166 fibres/kg in 2013, average 173 fibres/kg in 2015), the results from Mühlschlegel (Citation2017) are much lower.
Salt
The potential microplastic contamination of salt is a direct consequence of the microplastic contamination of the aquatic environment. More studies are available compared to the number of studies about honey. Except for one study by Karami et al., the results of the available studies all concluded that microplastics are present in salt samples, but they still show significant variability.
Gündoğdu (Citation2018) identified microplastics particles by µ-Raman spectroscopy in 16 brands of Turkish salt. They included sea salt (16 to 84 particles/kg), lake salt (8 to 102 particles/kg) and rock salt (9 to 16 particles/kg). For rock salt, the contamination source is less obvious and is most probably related to the processing. The most common plastic polymers found were polyethylene (22.9%) and polypropylene (19.2%).
The results obtained by Kosuth et al. (Citation2018) on salt samples commercialised in US grocery stores and originating from different countries worldwide (including salt from oceans, seas and mines and in different packages such as glass, cardboard or plastic recipients), were much higher (46.7 to 806 particles/kg). However, the method used for detection was staining with Rose Bengal.
Karami et al. (Citation2017) also analysed 17 salt brands from different countries sampled on a Malaysian market (14 sea salts, 1 lake salt and 1 salt of unknown origin). After visual inspection of the filter membranes used for sample preparation, suspected particles, resembling to microplastics by their colour and morphology, were collected and were analysed with Raman spectroscopy. Interestingly, a test sample was prepared from salt spiked with a mixture of plastic polymers and 95% of the polymers were recovered after sample preparation and filtration on an 8 µm filter membrane. However, the salt samples were filtered using a 149 µm filter membrane because of the presence of insoluble material resistant to digestion that prevented filtration on filters with a pore size of 8 and 22 µm. This might have caused an underestimation of the number of microplastics below 149 µm in the salt samples. The results were 1 to 10 particles/kg, which is much lower than in the other studies, and closer to the rock salt from Gündoğdu.
On the contrary, Yang et al. (Citation2015) reported microplastic particles in sea salts, lake salts and rock salts from China between 7 and 680 particles/kg, up to six fold higher than the results on sea salts, lake salts and rock salts from Gündoğdu. In both studies rock salts and well salts were less contaminated then sea salts and lake salts.
Iñiguez et al. (Citation2017) reported on the difference between these two last studies and criticised the use by Karami et al. of a filter with a pore size of 149 µm to retain microfibres between 10 and 200 µm. According to Iñiguez et al., this would explain the very low contamination level found by Karami compared to Yang.
Sugar
Probably the only study on sugar contamination by microplastics is Liebezeit and Liebezeit (Citation2013). The same indirect method of colouration with fuchsin and Rose Bengal was used as for honey and the results must be taken with care as this method is not as specific as identification by spectroscopic methods. The authors specify that transparent and coloured particles were considered together in this case, probably because chitin, glass and cellulose are not expected to be found like in honey. Unrefined cane sugar had the highest amount of synthetic fragments and fibres. However, the authors mention that in both honey and sugar, the levels found probably do not exceed the European regulation limits (<0.1% permissible content of insoluble residues in honey, no regulation for refined sugar).
Canned sardines and sprats
Not many studies concern processed seafood products contamination by microplastics. Karami et al. (Citation2018) investigated the microplastic contamination of canned sardines and sprats from 13 countries. Four brands out of 20 brands were found to be contaminated with 1 to 3 particles. As was done in the study on salt from Karami, a test sample was prepared from fish spiked with a mixture of plastic polymers and was filtered through a 22 µm pore size filter. Contrastingly, the digested fish could not be filtered through filters smaller than 149 µm due to the presence of materials such as vegetable oil. Therefore, the samples were filtered through a filter membrane with a pore size of 149 µm and particles were analysed by Raman spectroscopy. In this case, the authors acknowledged that the collected fragments would be >149 µm.
Beer
Beer contamination by microplastic was yet another debatable issue. The previously mentioned authors, Liebezeit et al. also investigated microplastic contamination in German beers in 2014. Fibres, fragments and granules were found after filtration through a 0.8 µm cellulose filter, except for wheat beers that could percolate and were filtered through a 40 µm sieve. Again, colouration with Rose Bengal was used and the non-stained material was referred to as microplastic contamination. The authors acknowledged however that only spectroscopic analysis by Raman of FT-IR could firmly confirm the synthetic nature of the isolated material.
In 2015, Lachenmeier et al. criticised the method of Rose Bengal colouration as it could cause false-negatives (not detecting polyvinylpolypyrrolidone, PVPP, used in beer processing), false-positives (detecting starch or kieselgur) and background contamination (observed in blank samples). The authors highlight the need for cleanrooms (focusing on the relevant microplastic particles sizes) to perform laboratory work. On the other hand, they also postulate that the results previously reported were artefacts due to laboratory contamination, in particular as beers are submitted to microfiltration steps to remove yeast cells. The contamination would therefore not originate from the raw material as suggested by Liebezeit et al. Contamination during bottle filling on the automated filling lines is also unlikely.
Finally, in 2018, Kosuth et al. investigated the microplastic contamination of beers in the US. They selected beers brewed with water from the Laurentian Great Lake where plastic pollution was especially well-known. Samples were passed through a cellulose filter of 11 µm pore size and isolated material was stained with Rose Bengal. Many precautions were taken to avoid sample contamination (laminar flow cabinet, cotton lab coat, wiped workspace,…). Twelve blank samples were analysed and, interestingly, despite the precautions, anthropogenic particles were found: 6 blanks contained 1 particle, 1 blank contained 2 particles, 1 blank contained 3 particles and the remaining blanks did not contain any particle. The blank contamination level was nevertheless subtracted from the microplastic contamination level. Another interesting finding in this study was that no correlation could be drawn between the contamination of the beers and their corresponding municipal tap water supply. The authors also highlighted the difference in beer processing between the US and Germany. They postulate that product processing might be the most important factor to understand anthropogenic contamination.
Bottled water
Very recently in 2018, reports were published on the possible contamination of bottled water by microplastics. Given the consumption of bottled water worldwide, the topic caught widespread media attention.
Mason et al. published in September 2018 a study on 259 bottles of water from 9 countries. A particularly large number of bottles were sampled to overcome the variability of the manufacturing processes and the particle-fluid dynamics. The detection method used staining by Nile Red (for particles >6.5 µm) and further identification by FT-IT (for particles >100 µm). Nile Red is adsorbed on plastic and is detected by fluorescence; 93% of the bottles were found to be contaminated with a considerable variation of particle numbers between bottles even of the same brand: an average of 10.4 particles (size >100 µm)/L and an average of 325 particles (size 6.5 to 100 µm)/L. The authors postulated that this variability could be related to different water sources, bottling facilities, conditions and timing of shipment to purchase locations. Variations were found between the brands. Interestingly, one brand commercialised water in a glass bottle and in a plastic bottle. The glass bottle still showed microplastic contamination (204 particles/L) but to a lower extend than the water of the same brand in plastic bottle (1 410 particles/L). The authors concluded that part of the contamination would have come from the water source whereas larger contamination would have originated from the packaging. It seems that there are more fibres in tap water than in bottled water and more fragments in bottled water, indicating different contamination sources. The authors partially attributed the contamination to the industrial lubricants and fragmentation from the cap (polypropylene) when opening the bottle. Finally, the bottled water contained on average nearly twice the amount of microplastic found in tap water by the same authors (5.45 particles/L).
Also in 2018, Schymanski et al. analysed bottled water from 22 single-use and returnable plastic bottles, 3 beverage cartons and 9 glass bottles from Germany. The sample size was smaller than with Mason et al. However, they used µ-Raman spectroscopy and were able to identify particles smaller than 20 µm, in contrast to FT-IR. The authors found a higher number of particles in returnable bottles (118 particles/L) than in single-use bottles (14 particles/L) (84% of the particles were polyethylene terephthalate, PET and 7% were polypropylene, PP, that are both constituents of the plastic bottles). In water from beverage cartons and glass bottles polyethylene and other polyolefins were found. The authors attributed these materials to the coating of the beverage cartons and to the caps lubricants. These findings tend to indicate that the packaging may release particles into the water. This should be confirmed by further analysis of water before and after bottling.
Drawing on the findings from Mason et al., the results are not entirely comparable. Mason provide an interesting comparison of their respective findings: the major plastic contaminant is not the same (PEST, combination of polyester and polyethylene terephthalate in Mason; polypropylene in Schymanski); the size of particles selected was not the same due to the different methodologies (>100 µm in Mason; >6.5 µm in Schymanski); the packaging is one of the sources of contamination (mostly the caps in Mason; mostly the bottle in Schymanski). However, both found a similar amount of polyethylene contaminants (around 10%) and similar proportions of particles <100 µm compared to larger ones (95 to 98%).
However, it is remarkable that blank samples, prepared from ultra-pure water, although not indicating any growing contamination trend during the analytical sequence, still showed microplastic contamination with an average of 14 ± 13 particles/L (the major contaminant being PET). The authors acknowledged that despite their efforts to avoid sample contamination in the laboratory, they could not achieve a zero blank contamination. It is worrying to observe that the blank contamination is similar to the results from single-use plastic bottles (where PET is also the major contaminant). Another difficulty encountered by the authors was the identification of some coloured particles by Raman spectroscopy due to similar spectra. For example, blue nitrile gloves particles, heliogen blue, and polypropylene blue bottle cap have very similar spectra. Although these blue particles were not found in the blank samples as possible general laboratory contaminants, they were not included in the microparticle count of the samples. These examples highlight the limitations and challenges of microplastic measurement in laboratories.
Tap water
It is also interesting to investigate the possible microplastic contamination of tap water and to compare it to bottled water. Most studies are quite recent and more literature could be published in the coming months but not available at the time of writing this publication.
Kosuth et al. (Citation2018) performed an interesting analysis of 159 samples of tap water collected from 14 countries. Anthropogenic debris were found in 81% of the 159 samples. The range of microplastic particles was 0–61 particles/L. The majority of the particles were fibres of 0.10–5.00 mm (98.3%). The authors highlighted an interesting finding: The US data, covering the largest geographical zone and the most diverse populations (from 5 000 residents to 8.5 million residents), showed the largest standard deviation (11.8 particles/L) and the largest range of particles/L (0 to 61 particles/L). Another observation was that the mean particle numbers/L in more developed countries was significantly higher than in the developing countries, although developing countries might not always have municipal waste disposal and water filtration systems. This indicates that parameters such as the water source, the population density and the water treatment process most probably influence the microplastic contamination of tap water.
Another study was reported by Strand et al. (Citation2018) on Danish drinking water (Denmark was not included in the study from Kosuth). The authors analysed 50 L of drinking water directly sampled from the tap in 17 sites around Denmark. The samples were filtered (on stainless steel filters 10 µm) and examined by a stereomicroscope. 44% of those particles were selected and analysed by µFT-IR. Also, 3 tap water samples were filtered on a 0.2 µm filter and analysed by µFT-IR to detect eventual particles <100 µm. An average of 15.6 particles that resemble microplastics (>100 µm) per 50 L was registered. However, the publication indicates that, in 16 of the 17 samples, the number of particles was below the limit of detection of 29 particles/50 L. One can, therefore, wonder how these 16 numbers were produced. The sample with the highest contamination had 30 particles/50 L. In addition, from the µFT-IR identification, only 3% of the particles were microplastic; however, 17% could not be identified (76% were cellulose, 10% had poor spectra, 7% were unknown, 4% were protein-like). The authors concluded that no significant concentration of microplastics in the Danish tap water was found. Obviously, more studies are necessary to get an overview of the microplastic contamination in tap water in the different regions of the world and to correlate them with water source, population density and water purification systems.
Potential contamination from food packaging
Other types of possible micro- and nanoplastic particles contamination are those linked to food packaging. Chemical constituents, including residual monomers, additives and production aids, might migrate from food contact materials into the food product they come in contact with (Castle Citation2007; Cooper Citation2007). However, the contamination of foodstuffs by micro- and nanoplastic particles which are released spontaneously from the packaging material seems rather unlikely. Plastic food packaging could eventually break into plastic pieces and contaminate the food products if wrongly handled. In such cases, plastic fragments would be of a size that could easily be identified visually and could most likely be removed before consumption, if the retailer had not discarded the product.
On the other hand, a variety of nanomaterials, in the shape of nanoparticles but different from plastic (e.g. clays, metallic silver and metal-oxide nanoparticles) is nowadays used in smart food packaging applications. Because of their specific physicochemical properties, the incorporated nanomaterials provide improved functional properties to the host packaging material. These functional properties, which range from significant barrier properties, mechanical, rheological, optical, catalytic and even antimicrobial properties aim at extending the shelf life and freshness of the contained food (Bumbudsanpharoke et al. Citation2015). Silver nanoparticles (AgNPs) and nanoclay form the majority of the nano-enabled food packaging on the market. There is a growing concern about the potential migration of such nanoparticles from food contact materials to foodstuffs and its associated risks (Addo Ntim et al. Citation2018). However, currently, there are insufficient data about environmental and human safety assessments of migration and exposure to nanomaterials (Bumbudsanpharoke et al. Citation2015). Similarly, studies that can clearly correlate food packaging to micro- and nanoplastic particles contamination are still insufficient.
Estimating the global human exposure to microplastic through the diet: lessons learned from the review
From the analysis of the papers retrieved by our literature search, it emerges that there are at least two challenges to be tackled to accurately estimate the global human exposure to microplastic through the diet: 1. the need for a detailed and agreed definition of micro- and nano-plastics; 2. the need for standardised methods and quality assurance. More scientific investigations around these topics are necessary.
As a concrete attempt to tackle these issues, the following sections provide both an overview on the criteria to be considered for an internationally agreed definition of micro- and nanoplastics and a review of the state-of-the-art of the methodologies currently available for the detection and characterisation of microplastic particles. In addition, they might be considered as baselines for future examination of the average consumption of potentially contaminated animals entering the human food chain (Tables 2–3 and S1) and of the potentially contaminated food products () to assess the global human exposure to microplastic through the diet.
Need for an internationally agreed definition of micro- and nanoplastics
Science-based definitions require clear and unambiguous assessment of the relevant measurand(s) (i.e. properties intended to be measured), the development, refinement and validation of suitable measurement procedures (i.e. combination of sampling, extraction and laboratory analysis methods), and the production of fit-for-purpose representative test materials and reference materials (European Commission Joint Research Center Citation2013; Besley et al. Citation2017). Without resolving these analytical challenges the process of finding consensus and (international) harmonisation on science-based definitions and key-terminology for micro- and nanoplastics will be a difficult exercise.
Today, the definitions are predominantly application-driven and they are, as a result, often inconsistent in their elements and scope.
The following three sections aim to review general core elements (i.e. particle size, particle shape and chemical composition) which can be considered for describing microplastics and nanoplastics. An overview of analytical techniques and associated challenges is given further in the paper.
Particle size
The particle size boundaries of microplastics and nanoplastics are often attributed with numerous size ranges which vary from study to study. Some authors differentiate plastic litter according to three main size ranges: macro- (>25 mm), meso- (5 mm to 25 mm) and microplastics (<5 mm) (Blettler et al. Citation2017; Imhof et al. Citation2017).
Despite the multiple size ranges of microplastics, there is seemingly a broad acceptance by marine and freshwater scientists on an upper size limit of <5 mm (Arthur et al. Citation2009). The Joint Group of Experts on the Scientific Aspects of Marine Environmental Protection (GESAMP) and the Danish Environmental Protection Agency define microplastics as follows: ‘Small pieces of plastic particles in the size range of 1 nm to <5 mm’ (GESAMP Citation2015). Recently, the upper size limit of 5 mm has also been used in defining the term ‘micro-litter’, which is included in a Commission Decision (2017/848/EU) on criteria and methodological standards for the implementation of the Marine Strategy Framework Directive (MSFD) (European Commission Citation2017).
Compared to the upper size boundary, there is, however, much less of agreement on the lower size limit of microplastics. Some studies refer to limits of 1 mm, 1 µm or even 100 nm for microplastic particles.
Plastic particles with sizes typically less than a few micrometres are sometimes categorised as ‘nanoplastics’. In a statement on the presence of microplastics and nanoplastics in food, with particular focus on seafood (EFSA Citation2016), and inspired by the European Commission’s recommendation on nanomaterials definition (European Commission Citation2011), the European Food Safety Authority (EFSA) defines nanoplastics as: ‘a material with any external dimension in the nanoscale or having internal surface structure in the nanoscale (1 nm to 100 nm)’.
Particle shape
The interpretation of particle size results obtained on perfectly hard spherical particles is rather straightforward as their size can be readily related to the diameter of the particles. In this ideal situation, different techniques will obtain comparable results. For real-world particles, it has been demonstrated that ‘particle size’ alone does not sufficiently describe the exact quantity that is measured across different techniques because the different physical principles of the techniques cause measurements to be affected by particle shape (Kestens et al. Citation2016). Therefore, the particle size results of such measurements are generally expressed in terms of an equivalent spherical or circular diameter. Information on particle shape is not only important for interpreting particle size results but can also help to identify the potential origin of the detected microplastics and nanoplastics. For example, Hidalgo-Ruz et al. in 2012 proposed a categorisation scheme based on pre-defined shapes (e.g., cylindrical, disk, flat, ovoid, spheruloids, elongated, rounded, irregular, etc.) and different types (e.g., fragments, pellets, filaments, films, foamed plastic, granules, etc.). Particular attention should be put on the shape of the so-called ‘fibres’, i.e. those particles which are significantly longer than wide. Biodegradable fibres are wool, cotton, wood-based cellulose fibres and other natural fibres. However, Landbecker found that synthetic textile fibres were the most abundant type of microplastics present in samples collected from the lake Mälaren located west of Stockholm (Landbecker Citation2012). A similar conclusion was made by Naji et al. in 2017, who found that synthetic fibres (88 %) were the dominant type of microplastics determined in different littoral surface sediments of the Persian Gulf, followed by films (11 %) and fragments (1 %). Globally, it is estimated that there are 5 times more fibres than particles in sea and beach samples. Fibres may come from domestic textile washing. Once in the marine environment, fibres can reach concentrations of up to thousands of particles per cubic meter (Salvador Cesa et al. Citation2017). Synthetic fibres (nylon, acrylic, polyester) constitute 62.1 % of the whole textile fibres.
Particle chemical composition
The third core element to be considered for the classification of micro- and nanoplastics is chemical composition. The term ‘plastic’ is generally used to describe a vast collection of man-made organic compounds which have a very rigid, soft, or elastic consistency. According to Annex 1 of Commission Regulation (EU) No 10/2011 of 14 January 2011 on plastic materials and articles intended to come into contact with food alone, more than 1000 substances are authorised in the production. This only concerns food contact materials. Therefore, the number of substances that can be contained in plastic particles coming from different industrial and domestic sectors is quite high.
To ensure that plastics are not erroneously referred to as if they are a single substance, ISO defines ‘plastic(s)’ as ‘a material which contains, as essential ingredient, a high polymer and which, at some stage in its processing into finished products, can be shaped by flow’. Note 1 to this definition states that ‘elastomeric materials, which are also shaped by flow, are not considered to be plastics’ (ISO 472, 2013). From this point of view, black tire rubber elastomers are not classified as plastic material. However, from an environmental point of view, no differentiation is being made between thermoplastics, thermosets and elastomers. Therefore, in the present paper, it was decided to include the dust produced by rubber tires as part of microplastics.
Finally, a non-exhaustive list of plastic polymers encountered in microplastic and nanoplastic particles (micro- and nanoplastic particles) is the following:
polyester (polycyclohexylenedimethylene terephthalate (PCT))
polypropylene (PP)
polyvinyl chloride (PVC)
polystyrene (PS)
Teflon
nylon 6.6
polyethylene (PE)
polyethylene terephthalate (PET)
styrene acrylonitrile resin (SAN)
poly(n-butyl methacrylate) (PBMA)
Importance of a standardised definition
The lack of international agreement on the meaning of key terminology in the field of marine and riverine litter, on microplastics, nanoplastics and other relevant nomenclature, hinders the comprehensive monitoring of ecosystems and thus also the development of policy and regulatory frameworks. Once the analytical challenge is overcome, the extent of a legal definition for microplastics and nanoplastics should be agreed so that, for example, pieces of plastic marine or riverine litter, which may find their way, via the food chain, onto humans’ dinner plates would be covered by future sector-specific legislation. This means that the definition should neither be too narrow nor too broad in scope. A too narrow scope can be detrimental for human health risk assessment studies. On the contrary, a definition too broad in scope will be overprotective and difficult to integrate into legislation because a significant fraction of litter could be classified undesirably as microplastics or nanoplastics which is highly unlikely to find its way into the food chain.
In agreeing on lower and upper size limits for microplastics and nanoplastics definitions, a number of practical factors related to the measurement procedures (i.e. a combination of sampling, extraction and laboratory analysis methods) will also need to be taken into consideration (JRC Citation2013; Besley et al. Citation2017). These measurement procedures require inter-laboratory validation and standardisation, and the size ranges defined in the final definitions need to be conducted with the analytical capabilities of the measurement procedures in mind.
Need for standardised methods and quality assurance
Challenges
One of the first challenges in measuring micro- and nanoplastic contamination is to retrieve micro- and nanoplastics particles from environmental and food matrices as well as to collect representative fields of samples.
Then, a crucial issue is to prevent the contamination of samples in the laboratory with microplastics from air, clothes, equipment and reagents and to prepare blank samples. (Wesch et al. Citation2016) reviewed sampling, analytical procedures and possible sample contamination during all stages of the studies. In their review, they highlighted the lack of standardised approaches, as well as the need for a better definition of the background contamination in the laboratory and the importance of the use of clean rooms for this type of analysis.
In addition, to demonstrate method and laboratory performance, suitable quality assurance and quality control measures have to be implemented. These measures, which include in-house method validation and interlaboratory comparisons, strongly rely on the availability of fit-for-purpose representative test materials (RTMs) and certified reference materials (CRMs). To date, no RTMs or CRMs are available.
Finally, if reliable comparison of particle size results requires a detailed specification of the measurand ‘particle size’, this necessitates a description of the principle of the entire measurement procedure. An incomplete method description leaves room for misinterpretation along with ambiguity about the meaning or the fitness-for-purpose of the reported data. It is quite evident that microplastics and nanoplastics are heterogeneous in size and shape and as a result, the results obtained with the standardised method will be method-dependent. The measurand will be method-defined, as known in the field of particle technology.
Methods currently used
The methods described in the following sections cover sample preparation, conventional/common detection/identification methods and advanced or novel methods, often used in combination with conventional identification methods. Most of these methods were used in the studies reported in . For each technique, a brief description of basic measurement principles is given as well as the type of information that can be derived (i.e. particle size, shape, composition etc.) and finally the strengths and limitations of the technique. Advantages and disadvantages of the methods are summarised in .
Table 4. Advantages and limitations of the methods for sample preparation and characterisation of microplastics.
Methods of sample preparation
Studying microplastics in the food chain implies the analysis of an enormous variety of microplastics distributed in many different background matrices. Matrices may range from relatively simple fresh and saltwater aquatic systems, more complex environmental sediments, soil and wastewater treatment sludges to highly complex organic and biological-based samples such as the digestive tracts of vertebrates, invertebrates and seafood (Foekema et al. Citation2013; Dehaut et al. Citation2016). In many cases the materials of interest will form only a tiny portion of the sample with the remainder being a complication for whatever analytical method used to characterise the microplastics. Thus, there is a strong need to have sample preparation procedures which can simplify or eliminate the background matrix or concentrate or extract the plastic particles from the matrix prior to instrumental analysis. Where such sample preparation is required, measurement procedures must be selected which are as non-invasive as possible and which are effective against the undesired matrix while remaining compatible with the sample type.
Filtration
One of the simplest methods to recover microplastic is filtration which may be suitable for isolation and concentration of free microplastics from relatively simple matrices such as water and beverages. Additionally, sequential filtration through a series of increasingly fine filters may be relevant to categorising particles in terms of their particle size distribution.
Flotation/sedimentation
In comparison with inorganic materials, the large majority of polymers have relatively low densities ranging from the lightest materials such as polyethylene (0.85 g cm−3) up to 2.1 g cm−3 in the case of a dense halogenated material such as Teflon. Within this range the large majority of polymer types have densities below 1.5 g cm−3, which is lower than the density of many inorganic materials that may be mixed in microplastics. This difference is commonly exploited to preferentially extract plastic particulates by floating them out from salt solutions whose density is higher than the plastics, but lower than the other, usually mineral, solids present (Quinn et al. Citation2017). A variety of solutions may be used depending on the maximum density required. For polymers with densities of up to 1.2 g cm−3 NaCl solutions may be sufficient, while ZnCl (1.7 g cm−3), NaCI (1.8 g cm−3) or sodium polytungstate (3.1 g cm−3) solutions may be considered for more dense materials. Depending on the size and density particles sedimentation/flotation may be achieved using normal gravitation force but may be accelerated by the appropriate use of laboratory centrifuges. The use of density separation methods is quite simple and safe to implement and has a relatively low cost.
Matrix dissolution
When the microplastics are present in complex biological matrices such as biofilms, animal tissue and organs, the previously described physical separations processes may not be effective, hence a more invasive method may rather be required. For microplastics, three options are commonly considered for simplifying or eliminating undesirable organic material from analytical samples:
Acidic chemical digestion
The use of acid digestion is well known in analytical chemistry for trace elements and has also been proposed for microplastics (Miller et al. Citation2017). Typically, the procedures involve oxidative acid treatments with various combinations of HCl, HNO3, HClO4 and HClO with and without H2O2. Although a number of polymers types are resistant to such aggressive conditions, there are reports saying that these methods can result in varying levels of modification, damage or total destruction of plastic particulates (Enders et al. Citation2016).
Alkaline chemical digestion
Alkaline digestion using concentrated solutions of bases such as NaOH, KOH or tetramethylammonium hydroxide is reportedly effective for hydrolysing complex biological matrices materials such as animal tissue and organs. A comparison of basic and acid digestion processes (Enders et al. Citation2016) shows that alkaline digestion can be used with a greater range of polymers and present a lower risk of chemically modifying or structurally damaging particulates.
Enzymatic digestion
For samples rich in biological material, a valid alternative to chemical digestion is the use of enzymes (Catarino et al. Citation2017; Löder et al. Citation2017). The major advantage of enzymatic digestion is that it is relatively non-aggressive making it unlikely to damage the commonly used polymer materials, as well as being intrinsically safer for laboratory workers. The disadvantages are that enzymes are specific to certain types of matrices (proteins, carbohydrates, fats etc.) and complex samples may require the use of several sequential steps to adequately remove the matrix components. Additionally, enzymes are sensitive to their environment, they may have variable activity depending on their type and origins, and their specific activity can change during storage. Finally, the costs of enzymatic digestion can be significantly higher than those of chemical digestion.
Oil extraction
Many plastics are relatively hydrophobic in comparison with mineral particulates, and this may be used to extract them from aqueous media preferentially. In the work of Crichton and coworkers (Crichton et al. Citation2017), the oleophilic properties of microplastics have been exploited to separate the plastic from aqueous media by preferential partitioning them into the water-immiscible oil. The method is reported to be compatible with subsequent Fourier Transform Infra Red Spectrophotometry (FTIR).
Methods of detection, identification and quantification of microplastics
The different polymer types, colours, shapes, fragmentation and surface degradation due to weathering and additives make it difficult to assess and classify microplastics (Shim et al. Citation2017) by measurement procedures which are solely based on microscopy methods. Therefore, other methods need to be applied to detect, identify and quantify microplastics particularly when they are present in complex environmental, biological or food matrices. Although different analytical methods are described below, their performance (e.g. sensitivity, selectivity, limits of detection and quantification) for the characterisation of plastic particulates are yet to be optimised and validated. Also each method can have specific measurement limitations and hence a minimum of two methods should be used when it is desired accurately to confirm the presence and identity of micro-plastics.
Optical vibrational spectroscopy
The characterisation of polymers has for many years relied on optical spectroscopy methods to provide information on the identity and chemical compositions of polymeric materials. The two main techniques are Infrared Spectroscopy (IR) and Raman Spectroscopy. Both techniques are based on irradiating the sample to stimulate molecular vibrations and to produce an optical spectrum. This spectrum contains a variety of peaks forming a fingerprint which can be compared with spectral libraries to identify the polymer.
These methods are considered to be selective and reproducible, require small sample amounts and limited sample preparation, and are non-intrusive and mostly non-destructive. Their integration with optical microscopy has permitted their use with increasing small samples or localised regions of interest which are suited for the detection and identification of microplastics. However, microplastics present in the environment are often subject to UV-induced photodegradation. Spectra obtained on such weathered or partially degraded plastic particles, as well as mixed samples, can be significantly different from the reference spectra obtained on the pristine plastic particles, hence making the identification process a challenging task (Lenz et al. Citation2015; Karami et al., Citation2017; Rocha-Santos and Duarte Citation2017).
Infrared spectroscopy
The majority of today’s infrared spectrometers use integrated interferometers to acquire spectra. These systems are commonly referred to as Fourier Transform Infrared Spectrophotometers (FTIR). The instrument can collect high-resolution spectral data simultaneously over a wide spectral range.
For the identification of microplastics in the upper size range (> 500 µm), procedural modifications or specialised accessories (Attenuated Total Reflectance-FTIR) (Jung et al. Citation2018) permit conventional FTIR spectrometers to be used directly with individual particles. For smaller particles or for more routine applications, it has become common practice to use instruments which combine an optical microscope with a narrow focused incoming infrared beam which illuminates a small selected region of the sample. This ‘point-and-shoot’ method is often combined with a micro manipulated optics and motorised sample stage movement permitting automated 2-D area analysis.
Raman spectroscopy
Raman spectroscopy is a laser-based method that provides better resolution than IR spectroscopy. It is well suited to focus on small regions of a sample and can address the identification of microplastics as small as 1 µm (Rocha-Santos and Duarte Citation2017; Schymanski et al. Citation2018). The Raman spectrum yields similar, but complementary, information to that found with FTIR. It may also be combined effectively with optical microscopy and together with FTIR has become is one of the techniques most widely used for qualitative analysis and characterization of microplastics. In particular, the ability to localise the illuminated region make it suitable to tackle the issue of locating microplastics in the variety of media background in which plastic debris can be found, being also able to track down microplastics in living organisms via microscopy imaging (Rocha-Santos and Duarte Citation2017).
Thermal analysis
Among the novel techniques for the identification and quantification of plastic fragments we can find thermo-analytical techniques, in which the physicochemical properties of microplastics are correlated to their thermal stability and measured in function of time or temperature in the presence of an inert gas (Dümichen et al. Citation2015; Käppler et al. Citation2016; Shim et al. Citation2017). Thermal analysis techniques hyphenated with gas chromatography-mass spectrometry (GC-MS) can concurrently analyse microplastics additives (Silva et al. Citation2010; Rocha-Santos and Duarte Citation2017; Shim et al. Citation2017). Obviously, a limitation of these techniques is that they are destructive and do not provide data on the size and shape of the plastic fragments examined and only give mass concentration results (Käppler et al. Citation2016; Shim et al. Citation2017).
Differential scanning calorimetry (DSC) is a fast and relatively simple technique that implies the use of reference materials (such as polyethylene beads) to allow the identification of primary microplastics (Shim et al. Citation2017).
Pyrolysis gas chromatography-mass spectrometry (Py-GC-MS) offers the possibility of measuring small quantities of microplastics in complex matrices usually without sample pretreatment (Shim et al. Citation2017). As thermal decomposition of all microplastics occurs at a similar temperature (350 °C to 450 °C), a separation of the decomposition product is needed (GC-MS). Py-GC-MS allows the measurement of samples smaller than 0.5 mg, which is around 200 times less than the typical sample mass required for thermogravimetric analysis (TGA). It is usually coupled with an FTIR or mass spectrometry. Environmental samples spiked with polyethylene (PE), polyvinylchloride (PVC), polypropylene (PP), polyethylene terephthalate (PET), polystyrene (PS) and polyamide (PA) have been successfully identified (Dümichen et al. Citation2015; Rocha-Santos and Duarte Citation2017; Shim et al. Citation2017). This technique is time consuming and needs an expert operator. It could be used as the screening method of bulk environmental samples.
Fluorescent tagging with Nile Red
Nile Red is a lipophilic dye that has been suggested as a tool for fluorescently labelling of microplastics when irradiated with blue light. This method is used to detect and quantify small microplastics (PE, PP, PS, and nylon-6 type microplastics, from 20 μm to 1 mm) in environmental samples (Erni-Cassola et al. Citation2017; Maes et al. Citation2017; Shim et al. Citation2017). The Nile Red staining method is inexpensive, uses readily available equipment, and can be semiautomated for sample analysis. The method requires a sample purification step, fluorescence microscopy (green fluorescence protein settings), and suitable image analysis software.
Selective fluorescent tagging of microplastics using Nile Red and the subsequent density separation and filtration on a black polycarbonate (PC) filter paper have been recently reported in the literature (Erni-Cassola et al. Citation2017; Maes et al. Citation2017; Shim et al. Citation2017).
Shim et al. (Shim et al. Citation2017) were able to obtain fluorescence for expanded polystyrene (EPS), polypropylene (PP), polyethylene (PE), high density polyethylene (HDPE), poly(ethylene-vinyl acetate) (PEVA), polycarbonate (PC) and polyurethane (PU) particles. Nile Red was unnecessary to identified polyester (PES), polyamide (PA) and polyethylene terephthalate (PET) as they were detectable with blue fluorescence. Other authors (Erni-Cassola et al. Citation2017) have also reported the detection of Nylon-6, polyvinyl chloride (PVC) and black tire rubber.
However, the elimination of organic matter, that could be stained with Nile Red and lead to an overestimation of the microplastic amount, is a crucial step. Digestion with hydrogen peroxide (H2O2) is preferred (Erni-Cassola et al. Citation2017; Shim et al. Citation2017) over treatment with nitric acid, which is highly efficient at eliminating organic matter but can damage pH-sensitive plastic polymers. Unfortunately, presently, no digestion method can assure the complete removal of organic matter, hence false positives in Nile Red staining could still occur. Alternatively, Raman spectroscopy can also be used to confirm that the fragments stained with Nile Red are only synthetic polymers (Erni-Cassola et al. Citation2017). A combination of fluorescence analysis followed by FT-IR with a fluorescence filter has also shown to be useful in the identification of microplastic samples.
Another difficulty is to identify very weathered plastic samples. Previous studies (Shim et al. Citation2017) have shown that is necessary to take into account the fact that photo-oxidation of plastics caused by weathering might modify the stainable surface and might affect the intensity of emission influenced by the colour of the plastic fragments.
Advanced or novel methods
Although the previously described optical spectroscopy methods dominate the characterisation of microplastics, alternative methods are considered to tackle particles in the low micrometre range and nanoparticles that cannot be resolved from the food matrix, or when information on chemical contaminants may be relevant. One such method which has recently been reported is Time-of-Flight Secondary Ion Mass Spectrometry (ToF-SIMS).
The ToF-SIMS technique gives information on the chemical composition of the near-surface regions (<5 nm depth) of solid samples by bombarding the sample surface with a finely focused pulsed ion beam. The sputtered material is then analysed in a time-of flight mass spectrometer providing information about the elemental and molecular composition of the sample. This technique offers promise for the analysis of microplastics (Jungnickel et al. Citation2016). In particular, it is also capable of detecting elemental contaminants such as heavy metals. The main disadvantages of the technique are that the instrumentation is complex and expensive and that the identification of polymers itself from the mass spectra can be greatly complicated by the presence of surface contaminates or weathering.
Average consumption of food products and global exposure
In addition to the needs for a proper definition of microplastic and for standardised methodologies, it also important to address the variety of food product consumption around the world.
Some studies have estimated the yearly human exposure to microplastics caused by the consumption of mussels, considered potentially as the most contaminated food. According to one of those studies, results ranged from 123 microplastic particles/year/capita in the UK to 4 620 particles/year/capita in Belgium, France or Spain, where shellfish consumption is higher (Catarino et al. Citation2018). Other authors estimated human exposure to 11,000 particles/year/capita via mussels consumption (Van Cauwenberghe and Janssen Citation2014). EFSA also estimated that a 225 g portion of Chinese mussels would lead to the ingestion of 900 plastic particles (EFSA Citation2016). Considering one portion per month during one year, the consumption would rise to 10,800 particles/year/capita. Therefore, the variability of the number of particles/year/capita is high, depending on the country and the nutritional habits.
Another study used the recommended maximum daily dose to estimate the yearly exposure to microplastics in salts (sea and well salts) in Spain. The exposure was estimated up to 510 particles/year/capita, using the OECD recommended maximum daily dose of salt (5 g of salt per day) (Iñiguez et al. Citation2017). However, the recommended daily dose does not necessarily reflect the real consumption of those products. Kosuth et al. (Citation2018) also tried to sum the average consumption of microparticles based on consumer guidelines: Their results indicated a ingestion of over 5 800 particles/year/capita considering together the contributions from salt (contributing for 3% of the total number of particles), beer (9%) and drinking bottled water (88%). They did not referenced the considered consumer guidelines.
Also for some products, it can be very difficult to estimate the average consumption/year. For instance, a study on canned sardines and sprats estimated an average intake of 1 to 5 particles of microplastics/year/capita (Karami et al. Citation2018). However, the authors assumed a world average consumption of sardines (around 90 g/year/capita), thus averaging those that eat canned fish every week with those that never eat it.
Nevertheless, beyond these difficulties, it would be useful to estimate the total microplastic contamination level in a human diet by taking into account the average consumption of food products per region. Food products that present low contamination or consumption levels compared to mussels, might together contribute significantly to the global human exposure. However, the high variability of the results available today does not allow yet such an estimation.
In terms of relative comparison, it is possible for example to compare the order of magnitude of microplastic exposure from the consumption of mussels to another major sources of plastic exposure from the environment, such as indoor air. Catarino et al. measured the amount of household dust fibres falling out during the preparation and consumption of a meal on a surface of a regular plate of 12.5 cm of radius, in 3 households in Scotland. They estimated that the human exposure to these fibres was between 13 731 and 68 415 microplastics/year/capita. The microplastic exposure from household dust is then 15 to 112 times higher than the exposure due to mussel consumption, estimated in the same study between 123 in UK and 4 620 microplastics/year/capita in other countries with higher shellfish consumption (Catarino et al. Citation2018).
On the other hand, Van Cauwenberghe et al. (Citation2014) estimated a much higher human exposure from the consumption of mussels with 11 000 microplastic particles/year/capita in Europe, level that is closer to the exposure from household dust.
Furthermore, if we consider that the proportion of microplastic fibres is usually around one third of the total amount of fibres in indoor dust fallout, as reported by Correia Prata in 2018 (29% of microplastic in dust) and by Dris et al. in 2017 (33% of microplastic in dust), the data on microplastic exposure from household dust reported by Catarino et al. would be lowered to between 4 577 and 22 805 microplastics/year/capita. Therefore, depending on the studies, it becomes very difficult to conclude if the plastic ingestion related to mussel contamination is lower or equivalent compared to the plastic ingestion via dust fallout during a meal.
Thus, the necessity to retrieve all consumption data per region, the high variability of the available contamination levels (due to the absence of harmonised definition and methodologies as described above) do not allow at present any calculation of a total exposure to microplastics/year/capita through the diet, nor its comparison with other sources of contamination to evaluate its impact.
In addition, we have so far considered the word ‘exposure’ stricto senso, as the amount of microplastics that come in contact with human beings via food and beverages and that might be ingested. We did not consider the amounts of microplastics (or nanoplastics) that finally end up in the body cells, in the blood stream or in the faeces. The absorption rate, excretion rate and toxicity depend on many factors (age, sex, disease, genotype, physical activity,…) and are not in the scope of this report.
Conclusions
There is a growing concern about the impact of human activities on the whole life chain, and there is a legitimate concern that the smaller plastic fraction, through bioaccumulation and trophic transfer, may ultimately contaminate the human population. However, in contrast to the visible presence of massive amounts of litter, there is presently very little understanding of the extent of environmental contamination of micro- and nanoplastics and the toxicological effects of microplastics and nanoplastics ingestion on humans are still not demonstrated.
Risk assessment and risk management rely on reliable exposure data, and therefore, we reviewed here the available data on the presence of micro- and nanoplastic particles in food chain samples for their reliability. We conclude that, presently, it is impossible to assess human exposure to micro- and nanoplastics through food consumption due to the lack of validated methods (and certified reference materials) and due to the lack of standardisation across the analytical procedures used in the reporting. It must be underlined that the definition of what is intended to be measured (the measurand) is essential for the development of a measurement method and the absence of such an internationally accepted definition for micro- and nanoplastic particles is the first gap towards the adequate measurement of the occurrence of those particles.
Given the large variety of particles in size, shape and composition, the adsorption of other pollutants and the dynamic change of their distribution in our environment depending on the human activities, the development of fit-for-purpose standardised methods constitutes a challenge.
The calibration of such standard methods requires the use of reference materials, where the type of particle and their concentration is precisely known. Different reference materials should be developed for different polymers in different matrices. The adsorption of chemicals and microorganisms or the leaching properties of such materials must accurately mimic the adsorption and leaching properties of particles in the natural environment. Comparisons between prepared reference materials and naturally occurring particles must be performed (similar to commutability studies which compare incurred serum samples to patient samples in a clinical analysis).
Finally, to monitor the contamination by micro- and nanoplastics, a significant number of samples must be collected, representative of an environmental area or a population, using standard sampling protocols that avoid further contamination. Laboratories must be equipped with a clean zone, and protocols devoid of cross-contamination (e.g. contamination of blank samples) must be established.
The lack of reliable occurrence data in food, of standardisation of the analytical methods and of toxicological research on humans and animals are also reported in the EFSA report (EFSA Citation2016). At the current stage of knowledge, estimates exist, made by extrapolation of small sample size analysis and, comparison of contamination levels from food or air dust. However, no accurate answer can thus be given, neither to the question of how much microplastic we may consume through a normal diet nor to the question of how it may affect us. Until standardised analytical methods and reference materials are available, the data produced will not be representative and significant.
Supplemental Material
Download TIFF Image (4.9 MB)Supplemental Material
Download MS Excel (94.5 KB)Acknowledgments
A special acknowledgement goes to Veronique Vanherck and Emmanuel Duh for their outstanding contribution in infographism and in proof-reading, respectively. The authors also thank Birgit Sokull-Kluettgen for her review of the preliminary draft.
Disclosure statement
No potential conflict of interest was reported by the authors.
Supplementary material
Supplemental data for this article can be accessed on the publisher’s website.
Related Research Data
References
- Addo Ntim S, Norris S, Goodwin DG Jr., Breffke J, Scott K, Sung L, Thomas TA, Noonan GO. 2018. Effects of consumer use practices on nanosilver release from commercially available food contact materials. Food Addit Contam Part A Chem Anal Control Expo Risk Assess. 35(11):2279–2290. doi:10.1080/19440049.2018.1529437.
- Antão Barboza LG, Vethaakd AD, Lavorante BRBO, Lundebyef AK, Guilhermino L. 2018. Marine microplastic debris: an emerging issue for food security, food safety and human health. Mar Pollut Bull. 133:336–348. doi:10.1016/j.marpolbul.2018.05.047
- Arthur C, Bamford H, Baker J (2009). Proceedings of the international research workshop on the occurrence, effects and fate of microplastic marine debris, 9-1, 2008. Tacoma (WA): University of Washington Tacoma; NOAA Technical Memorandum NOS-OR&R-30.
- Barnes KK, Kolpin DW, Furlong ET, Zaugg SD, Meyer MT, Barber LB. 2008. A national reconnaissance of pharmaceuticals and other organic wastewater contaminants in the United States — I) Groundwater. Sci Total Environ. 402(2–3):192–200. doi:10.1016/j.scitotenv.2008.04.028.
- Besley A, Vijver MG, Behrens P, Bosket T. 2017. A standardized method for sampling and extraction methods for quantifying microplastics in beach sand. Mar Pollut Bull. 114:77–83. doi:10.1016/j.marpolbul.2016.08.055
- Bhattacharya P, Lin S, Turner JP, Ke PC. 2010. Physical adsorption of charged plastic nanoparticles affects algal photosynthesis. J Phys Chem. 114(39):16556–16561. doi:10.1021/jp1054759.
- Blettler MCM, Ulla MA, Rabuffetti AP, Garello N. 2017. Plastic pollution in freshwater ecosystems: macro-, meso- and microplastic debris in a floodplain lake. Environ Monit Assess. 189:581. doi:10.1007/s10661-017-6305-8
- Boerger CM, Lattin GL, Moore SL, Moore CJ. 2010. Plastic ingestion by planktivorous fishes in the North Pacific Central Gyre. Mar Pollut Bull. 60(12):2275–2278. doi:10.1016/j.marpolbul.2010.08.007.
- Bouwmeester H, Hollman PC, Peters RJ. 2015. Potential health impact of environmentally released micro- and nanoplastics in the human food production chain: experiences from nanotoxicology. Environ Sci Technol. 49:8932–8947. doi:10.1021/acs.est.5b01090
- Brilliant MGS, MacDonald BA. 2000. Postingestive selection in the sea scallop Placopecten magellanicus (Gmelin): the role of particle size and density. J Exp Mar Bio Ecol. 253:211–227. doi:10.1016/S0022-0981(00)00258-6
- Brilliant MGS, MacDonald BA. 2002. Postingestive selection in the sea scallop (Placopecten magellanicus) on the basis of chemical properties of particles. Mar Biol. 141:457–465. doi:10.1007/s00227-002-0845-2
- Browne MA, Crump P, Niven SJ, Teuten E, Tonkin A, Galloway T, Thompson R. 2011. Accumulation of microplastic on shorelines worldwide: sources and sinks. Environ Sci Technol. 45:9175–9179. doi:10.1021/es201811s
- Browne MA, Dissanayake A, Galloway TS, Lowe DM, Thompson RC. 2008. Ingested microscopic plastic translocates to the circulatory system of the mussel, Mytilus edulis (L.). Environ Sci Technol. 42(13):5026–5031. doi:10.1021/es800249a.
- Buchanan JB. 1971. Pollution by synthetic fibres. Mar Pollut Bull. 2(2):23. doi:10.1016/0025-326X(71)90136-6.
- Bumbudsanpharoke N, Choi J, Ko S. 2015. Applications of nanomaterials in food packaging. J Nanosci Nanotechnol. 15(9):6357–6372. doi:10.1166/jnn.2015.10847.
- Carbery M, O’Connor W, Thavamani P. 2018. Trophic transfer of microplastics and mixed contaminatns in the marine food web and implications for human health. Environ Int. 115:400–409. doi:10.1016/j.envint.2018.03.007
- Carpenter E, Smith K. 1972. Plastics on the sargasso sea surface. Science. 175(4027):1240–1241. doi:10.1126/science.175.4027.1240.
- Carr SA. 2017. Sources and dispersive modes of micro‐fibres in the environment. Integr Environ Assess Manage. 13(3):466–469. doi:10.1002/ieam.1916.
- Castle L. 2007. Chemical migration into food: an overview. In: Barnes K, Sinclair R, Watson D, editors. Chemical migration and food contact materials. Sawston (Cambridge): Woodhead Publishing; p. 1–13.
- Catarino AI, Macchia V, Sanderson WG, Thompson RC. 2018. Low levels of microplastics (MP) in wild mussels indicate that MP ingestion by humans is minimal compared to exposure via household fibres fallout during a meal. Environ Pollut. 237:675–684. doi:10.1016/j.envpol.2018.02.069
- Catarino AI, Thompson R, Sanderson W, Henry TB. 2017. Development and optimization of a standard method for extraction of microplastics in mussels by enzyme digestion of soft tissues. Environ Toxicol Chem. 36(4):947–951. doi:10.1002/etc.3608.
- Cedervall T, Hansson LA, Lard M, Frohm B, Linse S. 2012. Food chain transport of nanoparticles affects behaviour and fat metabolism in fish. PLoS One. 7:e32254. doi:10.1371/journal.pone.0032254
- Chae Y, An Y. 2017. Effects of micro- and nanoplastics on aquatic ecosystems: current research trends and perspectives. Mar Pollut Bull. 124(2):624–632. doi:10.1016/j.marpolbul.2017.01.070.
- Claessens M, Van Cauwenberghe L, Vandegehuchte MB, Janssen CR. 2013. New techniques for the detection of microplastics in sediments and field collected organisms. Mar Pollut Bull. 70:227–233. doi:10.1016/j.marpolbul.2013.03.009
- Cooper I. 2007. Plastics and chemical migration into food. In: Barnes K, Sinclair R, Watson D, editors. Chemical migration and food contact materials. Sawston (Cambridge): Woodhead Publishing; p. 228–250.
- Correia Prata J. 2018. Airborne microplastics: consequences to human health? Environ Pollut. 234:115–126. doi:10.1016/j.envpol.2017.11.043
- Crichton EM, Noël M, Giesab EA, Ross PS. 2017. A novel, density-independent and FTIR-compatible approach for the rapid extraction of microplastics from aquatic sediments. Anal Methods. 9(9):1419–1428. doi:10.1039/C6AY02733D.
- De Souza Machado AA, Kloas W, Zarfl C, Hempel S, Rillig MC. 2017. Microplastics as an emerging threat to terrestrial ecosystems. Glob Change Biol. 24(4):1405–1416. doi:10.1111/gcb.14020.
- De Witte B, Devriese L, Bekaert K, Hoffman S, Vandermeersch G, Cooreman K, Robbens J. 2014. Quality assessment of the blue mussel (Mytilus edulis): comparison between commercial and wild types. Mar Pollut Bull. 85(1):146–155. doi:10.1016/j.marpolbul.2014.06.006.
- Dehaut A, Cassone AL, Frère L, Hermabessiere L, Himber C, Rinnert E, Rivière G, Lambert C, Soudant P, Huvet A, et al. 2016. Microplastics in seafood: benchmark protocol for their extraction and characterization. Environ Pollut. 215:223–233. doi:10.1016/j.envpol.2016.05.018
- Dehghani S, Moore F, Akhbarizadeh R. 2017. Microplastic pollution in deposited urban dust, Tehran metropolis, Iran. Environ Sci Pollut Res Int. 24:20360–20371. doi:10.1007/s11356-017-9674-1
- Díaz-Cruz MS, Barceló D. 2008. Trace organic chemicals contamination in ground water recharge. Chemosphere. 72(3):333–342. doi:10.1016/j.chemosphere.2008.02.031.
- Dris R, Gasperi J, Mirande C, Mandin C, Guerrouache M, Langlois V, Tassin B. 2017. A first overview of textile fibres, including microplastics, in indoor and outdoor environments. Environ Pollut. 221:453–458. doi:10.1016/j.envpol.2016.12.013
- Dris R, Gasperi J, Saad M, Mirande C, Tassin B. 2016. Synthetic fibres in atmospheric fallout: A source of microplastics in the environment? Mar Pollut Bull. 104(1–2):290–293. doi:10.1016/j.marpolbul.2016.01.006.
- Dümichen E, Barthel AK, Braun U, Bannick CG, Brand K, Jekel M, Senz R. 2015. Analysis of polyethylene microplastics in environmental samples, using a thermal decomposition method. Water Res. 85:451–457. doi:10.1016/j.watres.2015.09.002
- Eerkes-Medrano D, Thompson RC, Aldridge DC. 2015. Microplastics in freshwater systems: A review of the emerging threats, identification of knowledge gaps and prioritisation of research needs. Water Res. 75:63–82. doi:10.1016/j.watres.2015.02.012
- [EFSA] European Food Safety Authority. 2016. Presence of microplastics and nanoplastics in food, with particular focus on seafood. EFSA J. 14(6):4501. doi:10.2903/j.efsa.2016.4501.
- Enders K, Lenz R, Beer S, Stedmon CA. 2016. Extraction of microplastic from biota: recommended acidic digestion destroys common plastic polymers. ICES J Mar Sci. 74(1):326–331. doi:10.1093/icesjms/fsw173.
- Engler RE. 2012. The complex interaction between marine debris and toxic chemicals in the ocean. Environ Sci Technol. 45(22):12302–12315. doi:10.1021/es3027105.
- Eriksen M, Mason S, Wilson S, Boxa C, Zellers A, Edwards W, Farley H, Amato S. 2013. Microplastic pollution in the surface waters of the Laurentian Great Lakes. Mar Pollut Bull. 77(1–2):177–182. doi:10.1016/j.marpolbul.2013.10.007.
- Erni-Cassola G, Gibson M, Thompson RC, Christie-Oleza JA. 2017. Lost, but found with nile red: a novel method for detecting and quantifying small microplastics (1 mm to 20 μm) in environmental samples. Environ Sci Technol. 51(23):13641–13648. doi:10.1021/acs.est.7b04512.
- European Commission. 2011. Commission recommendation of 18 October 2011 on the definition of nanomaterial. Off J Euro Union. L275:38–40.
- European Commission 2017. Commission Decision of 17 May 2017 on laying down criteria and methodological standards on good environmental status of marine waters and specifications and standardised methods for monitoring and assessment, and repealing Decision 20170/477/EU. Official Journal of the European Union, 2017/848/EU.
- European Commission, Joint Research Centre., 2013. Guidance on monitoring of marine litter in European seas. JRC Scientific and Policy Reports, Publications Office of the European Union, EUR 26113. Doi: 10.2788/99475
- Farrell P, Nelson K. 2013. Trophic level transfer of microplastic: mytilus edulis (L.) to Carcinus maenas (L.). Environ Pollut. 177:1–3. doi:10.1016/j.envpol.2013.01.046
- Faure F, Corbaz M, Baecher H, De Alencastro LF. 2012. Pollution due to plastics and microplastics in lake Geneva and in the Mediterranean sea. Arch Sci. 65:157–164.
- Foekema EM, de Gruijter C, Mergia MT, van Franeker JA, Murk AJ, Koelmans AA. 2013. Plastic in North sea fish. Environ Sci Technol. 47(15):8818–8824. doi:10.1021/es400931b.
- Gasperi J, Wright SL, Dris R, Collard F, Mandin C, Guerrouache M, Langlois V, Kelly FJ, Tassin B. 2018. Microplastics in air: are we breathing it in? Curr Opin Insect Sci. 1:1–5. doi:10.1016/j.coesh.2017.10.002
- GESAMP (2015). “Sources, fate and effects of microplastics in the marine environment: a global assessment” (Kershaw, P. J., ed.). (IMO/FAO/UNESCO-IOC/UNIDO/WMO/IAEA/UN/UNEP/UNDP joint group of experts on the scientific aspects of marine environmental protection). Rep. Stud. GESAMP No. 90, 96 p.
- Gündoğdu S. 2018. Contamination of table salts from Turkey with microplastics. Food Addit Contam Part A Chem Anal Control Expo Risk Assess. 35(5):1006–1014. doi:10.1080/19440049.2018.1447694.
- Hahladakis JN, Velis CA, Weber R, Iacovidou E, Purnell P. 2018. An overview of chemical additives present in plastics: migration, release, fate and environmental impact during their use, disposal and recycling. J Hazard Mater. 344:179–199. doi:10.1016/j.jhazmat.2017.10.014
- Hart MW. 1991. Particle captures and the method of suspension feeding by echinoderm larvae. Biol Bull. 180(1):12–27. doi:10.2307/1542425.
- Heberer T. 2002. Tracking persistent pharmaceutical residues from municipal sewage to drinking water. J Hydrol. 266(3–4):175–189. doi:10.1016/S0022-1694(02)00165-8.
- Hirai H, Takada H, Ogata Y, Yamashita R, Mizukawa K, Saha M, Kwan C, Moore C, Gray H, Laursen D. 2011. Organic micropollutants in marine plastics debris from the open ocean and remote and urban beaches. Mar Pollut Bull. 62(8):1683–1692. doi:10.1016/j.marpolbul.2011.06.004.
- Hollman PCH, Bouwmeester H, Peters RJB (2013). Microplastics in the aquatic food chain; Sources, measurement, occurrence and potential health risks. Wageningen, RIKILT Wageningen UR (University & Research centre), RIKILT report 2013.003, 28 pp.
- Horton AA, Walton A, Spurgeon DJ, Lahive E, Svendsen C. 2017. Microplastics in freshwater and terrestrial environments: evaluating the current understanding to identify the knowledge gaps and future research priorities. Sci Total Environ. 586:127–141. doi:10.1016/j.scitotenv.2017.01.190
- Huerta Lwanga E, Mendoza Vega J, Ku Quej V, de Los Angeles Chi J, Sanchez Del Cid L, Chi C, Escalona Segura G, Gertsen H, Salánki T, van der Ploeg M, et al. 2017. Field evidence for transfer of plastic debris along a terrestrial food chain. Nat Sci Rep. 7:14071. doi:10.1038/s41598-017-14588-2
- Imhof HK, Sigl R, Brauer E, Feyl S, Giesemann P, Klink S, Leupolz K, Löder MGJ, Löschel LA, Missun J, et al. 2017. Spatial and temporal variation of macro-, meso- and microplastic abundance on a remote coral island of the Maldives, Indian Ocean. Mar Pollut Bull. 116:340–347. doi:10.1016/j.marpolbul.2017.01.010
- Iñiguez ME, Conesa JA, Fullana A. 2017. Microplastics in Spanish Table Salt. Nat Sci Rep. 7:8620. doi:10.1038/s41598-017-09128-x
- Jung MR, Horgen FD, Orski SV, Rodriguez Cardenas V, Beers KL, Balazs GH, Jones TT, Work TM, Brignac KC, Royer S-J, et al. 2018. Validation of ATR FT-IR to identify polymers of plastic marine debris, including those ingested by marine organisms. Mar Pollut Bull. 127:704–716. doi:10.1016/j.marpolbul.2017.12.061
- Jungnickel H, Pund R, Tentschert J, Reichardt P, Laux P, Harbach H, Luch A. 2016. Time-of-flight secondary ion mass spectrometry (ToF-SIMS)-based analysis and imaging of polyethylene microplastics formation during sea surf simulation. Sci Total Environ. 563–564:261–266. doi:10.1016/j.scitotenv.2016.04.025
- Kaposi KL, Mos B, Kelaher B, Dworjanyn SA. 2014. Ingestion of microplastic has limited impact on a marine larva. Environ Sci Technol. 48(3):1638–1645. doi:10.1021/es404295e.
- Käppler A, Fischer D, Oberbeckmann S, Schernewski G, Labrenz M, Eichhorn K-J, Voit B. 2016. Analysis of environmental microplastics by vibrational microspectroscopy: FTIR, Raman or both? Anal Bioanal Chem. 408:8377–8391. doi:10.1007/s00216-016-9956-3
- Karami A, Golieskardi A, Ho YB, Larat V, Salamatinia B. 2017. Microplastics in eviscerated flesh and excised organs of dried fish. Nat Sci Rep. 7(5473):2045–2322. doi:10.1038/s41598-017-05828-6.
- Karami A, Golieskardi A, Keong Choo C, Larat V, Karbalaei S, Salamatinia B. 2018. Microplastic and mesoplastic contamination in canned sardines and sprats. Sci Total Environ. 612:1380–1386. doi:10.1016/j.scitotenv.2017.09.005
- Karlsson TM, Vethaak AD, Almroth BC, Ariese F, van Velzen M, Hassellöv M, Leslie HA. 2017. Screening for microplastics in sediment, water, marine invertebrates and fish: method development and microplastic accumulation. Mar Pollut Bull. 122(1–2):403–408. doi:10.1016/j.marpolbul.2017.06.081.
- Kestens V, Roebben G, Herrmann J, Jämting Å, Coleman V, Minelli C, Clifford C, De Temmerman P-J, Mast J, Junjie L, et al. 2016. Challenges in the size analysis of a silica nanoparticle mixture as candidate certified reference material. J Nanopart Res. 18:171. doi:10.1007/s11051-016-3474-2
- Köhler A. 2010. Cellular fate of organic compounds in marine invertebrates. Comp Biochem Physiol A Mol Integr Physiol. 157(Supplement S8). doi:10.1016/j.cbpa.2010.06.020.
- Kolandhasamy P, Su L, Li J, Qu X, Jabeen K, Shi H. 2018. Adherence of microplastics to soft tissue of mussels: A novel way to uptake microplastics beyond ingestion. Sci Total Environ. 610–611:635–640. doi:10.1016/j.scitotenv.2017.08.053
- Kosuth M, Mason SA, Wattenberg EV. 2018. Anthropogenic contamination of tap water, beer, and sea salt. PLoS One. 13(4):e0194970. doi:10.1371/journal.pone.0194970.
- Lachenmeier DW, Kocareva J, Noack D, Kuballa T. 2015. Microplastic identification in German beer – an artefact of laboratory contamination? Deutsche Lebensmittel-Rundschau. 111(10):437–440. doi:10.5281/zenodo.1250715.
- Landbecker D (2012). Anthropogenic particles in lake Mälaren (APILM). Project report, Uppsala Universitet, Sweden.
- Lebreton L, Slat B, Ferrari F, Sainte-Rose B, Aitken J, Marthouse R, Hajbane S, Cunsolo S, Schwarz A, Levivier A, et al. 2018. Evidence that the great pacific garbage patch is rapidly accumulating plastic. Nat Sci Rep. 8:46666. doi:10.1038/s41598-018-22939-w
- Lenz R, Enders K, Stedmon CA, Mackenzie DM, Nielsen TG. 2015. A critical assessment of visual identification of marinemicroplastic using Raman spectroscopy for analysis improvement. Mar Pollut Bull. 100:82–91. doi:10.1016/j.marpolbul.2015.09.026
- Li J, Green C, Reynolds A, Shia H, Rotchell JM. 2018. Microplastics in mussels sampled from coastal waters and supermarkets in the United Kingdom. Environ Pollut. 241:35–44. doi:10.1016/j.envpol.2018.05.038
- Li J, Yang D, Li L, Jabeen K, Shi H. 2015. Microplastics in commercial bivalves from China. Environ Pollut. 207:190–195. doi:10.1016/j.envpol.2015.09.018
- Li WC, Tse HF, Fok L. 2016. Plastic waste in the marine environment: A review of sources, occurrence and effects. Sci Total Environ. 566–567:333–349. doi:10.1016/j.scitotenv.2016.05.084
- Liebezeit G, Liebezeit E. 2013. Non-pollen particulates in honey and sugar. Food Addit Contam Part A Chem Anal Control Expo Risk Assess. 30(12):2136–2140. doi:10.1080/19440049.2013.843025.
- Liebezeit G, Liebezeit E. 2014. Synthetic particles as contaminants in German beers. Food Addit Contam Part A Chem Anal Control Expo Risk Assess. 31(9):1574–1578. doi:10.1080/19440049.2014.945099.
- Liebezeit G, Liebezeit E. 2015. Origin of synthetic particles in honeys. Pol J Food Nutr Sci. 65(2):143–147. doi:10.1515/pjfns-2015-0025.
- Löder MGJ, Imhof HK, Ladehoff M, Löschel LA, Lorenz C, Mintenig S, Piehl S, Primpke S, Schrank I, Laforsch C, et al. 2017. Enzymatic purification of microplastics in environmental samples. Environ Sci Technol. 51(24):14283–14292. doi:10.1021/acs.est.7b03055.
- Loos R, Locoro G, Comero S, Contini S, Schwesig D, Werres F, Balsaa P, Gans O, Weiss S, Blaha L, et al. 2010. Pan-European survey on the occurrence of selected polar organic persistent pollutants in ground water. Water Res. 44(14):4115–4126. doi:10.1016/j.watres.2010.05.032.
- Lusher A. 2015. Microplastics in the Marine Environment: distribution, Interactions and Effects. In: Bergmann M, Gutow L, Klages M, editors. Marine Anthropogenic Litter. Cham: Springer; p. 245–307.
- Maes T, Jessop R, Wellner N, Haupt K, Mayes AG. 2017. A rapid-screening approach to detect and quantify microplastics based on fluorescent tagging with Nile Red. Nat Sci Rep. 7:44501. doi:10.1038/srep44501
- Malaweera BO, Wijesundara WMNM. 2014. Use of seafood processing by-products in the animal feed industry. In: Kim SK, editor. Seafood processing by-products. New York (NY): Springer; p. 315–339.
- Mason SA, Garneau D, Sutton R, Chu Y, Ehmann K, Barnes J, Fink P, Papazissimos D, Rogers DL. 2016. Microplastic pollution is widely detected in US municipal wastewater treatment plant effluent. Environ Pollut. 218:1045–1054. doi:10.1016/j.envpol.2016.08.056
- Mason SA, Welch V, Neratko J. 2017. Synthetic polymer contamination in bottled water. Front Chem. 6:407. doi:10.3389/fchem.2018.00407
- Mathalon A, Hill P. 2014. Microplastic fibres in the intertidal ecosystem surrounding Halifax harbor, Nova Scotia. Mar Pollut Bull. 81(1):69–79. doi:10.1016/j.marpolbul.2014.02.018.
- Mato Y, Isobe T, Takada H, Kanehiro H, Ohtake C, Kaminuma T. 2001. Plastic resin pellets as a transport medium for toxic chemicals in the marine environment. Environ Sci Technol. 35(2):318–324. doi:10.1021/es0010498.
- Miller ME, Kroon FJ, Motti CA. 2017. Recovering microplastics from marine samples: A review of current practices. Mar Pollut Bull. 123(1):6–18. doi:10.1016/j.marpolbul.2017.08.058.
- Mintenig SM, Löder MGJ, Primpke S, Gerdts G. 2019. Low numbers of microplastics detected in drinking water from ground water sources. Sci Total Environ. 648:631–635. doi:10.1016/j.scitotenv.2018.08.178
- Moore C, Phillips C. 2012. Plastic ocean. New York: Avery. ISBN 9781583335017.
- Mühlschlegel P, Hauk A, Walter U, Sieber R. 2017. Lack of evidence for microplastic contamination in honey. Food Addit Contam Part A Chem Anal Control Expo Risk Assess. 34(11):1982–1989. doi:10.1080/19440049.2017.1347281.
- Oberbeckmann SL, Martin GJ, Labrenz M. 2015. Marine microplastic-associated biofilms – a review. Environ Chem. 12(5):551–562. doi:10.1071/EN15069.
- Oliveira M, Ribeiro A, Hylland K, Guilhermino L. 2013. Single and combined effects of microplastics and pyrene on juveniles (0+ group) of the common goby Pomatoschistus microps (Teleostei, Gobiidae). Ecol Indic. 34:641–647. doi:10.1016/j.ecolind.2013.06.019
- Possatto FE, Barletta M, Costa MF, Ivar Do Sul JA, Dantas DV. 2011. Plastic debris ingestion by marine catfish: an unexpected fisheries impact. Mar Pollut Bull. 62(5):1098–1102. doi:10.1016/j.marpolbul.2011.01.036.
- Quinn B, Murphy F, Ewins C. 2017. Validation of density separation for the rapid recovery of microplastics from sediment. Anal Methods. 9:1491–1498. doi:10.1039/c6ay02542k
- Renzi M, Guerranti C, Blašković A. 2018. Microplastic contents from maricultured and natural mussels. Mar Pollut Bull Part A. 131:248–251. doi:10.1016/j.marpolbul.2018.04.035
- Rios LM, Moore C, Jones PR. 2007. Persistent organic pollutants carried by synthetic polymers in the ocean environment. Mar Pollut Bull. 54(8):1230–1237. doi:10.1016/j.marpolbul.2007.03.022.
- Rist S, Carney AB, Hartmann NB, Karlsson TM. 2018. A critical perspective on early communications concerning human health aspects of microplastics. Sci Total Environ. 626:720–726. doi:10.1016/j.scitotenv.2018.01.092
- Rocha-Santos TAP, Duarte AC. 2017. Comprehensive Analytical Chemistry. Characterization and analysis of Microplastics. Vol. 75, 1st. Oxford: Elsevier.
- Rochman CM. 2016. The Role of Plastic Debris as Another Source of Hazardous Chemicals in Lower-trophic Level Organisms. In: Springer, editor. The Handbook of Environmental Chemistry. Berlin (Heidelberg): Springer; p. 1–15.
- Salvador Cesa F, Turra A, Baruque-Ramos J. 2017. Synthetic fibres as microplastics in the marine environment: A review from textile perspective with a focus on domestic washings. Sci Total Environ. 598:116–1129. doi:10.1016/j.scitotenv.2017.04.172
- Schymanski D, Goldbeck C, Humpf H-U, Fürs P. 2018. Analysis of microplastics in water by micro-Raman spectroscopy: release of plastic particles from different packaging into mineral water. Water Res. 129:154–162. doi:10.1016/j.watres.2017.11.011
- Shim WJ, Hong SH, Eo SE. 2017. Identification methods in microplastic analysis: a review. Anal Methods. 9(9):1384–1391. doi:10.1039/c6ay02558g.
- Silva MF, Doménech-Carbó MT, Fuster-López L, Mecklenburg MF, Martin-Rey S. 2010. Identification of additives in poly(vinylacetate) artist’s paints using PY-GC-MS. Anal Bioanal Chem. 397(1):357–367. doi:10.1007/s00216-010-3505-2.
- Steinmetz Z, Wollmann C, Schaefer M, Buchmann C, David J, Tröger J, Muñoz K, Frör O, Schaumann GE. 2016. Plastic mulching in agriculture. Trading short-term agronomic benefits for long-term soil degradation? Sci Total Environ. 550:690–705. doi:10.1016/j.scitotenv.2016.01.153
- Strand J, Feld L, Murphy F, Mackevica A, Hartmann N (2018). Analysis of microplastic particles in Danish drinking water. Aarhus University, DCE – Danish Centre for Environment and Energy, 34 pp. Scientific Report No 291. http://dce2.au.dk/pub/SR291.pdf
- Sussarellu R, Soudant P, Lambert C, Fabioux C, Corporeau C, Laot C (January 2014). Microplastics: effects on oyster physiology and reproduction. Platform presentation at the International workshop on fate and impact of microplastics in marine ecosystems (MICRO2014). Plouzane (France).
- Teuten EL, Saquing JM, Knappe DR, Barlaz MA, Jonsson S, Bjorn A, Rowland SJ, Thompson RC, Galloway TS, Yamashita R, et al. 2009. Transport and release of chemicals from plastics to the environment and to wildlife. Philos Trans R Soc B. 364:2027–2045. doi:10.1098/rstb.2008.0284
- Thompson RC, Olsen Y, Mitchell RP, Davis A, Rowland SJ, John AWG, McGonigle D, Russel AE. 2004. Lost at sea: where is all the plastic? Science. 304(5672):838. doi:10.1126/science.1094559.
- Van Cauwenberghe L, Claessens M, Vandegehuchte MB, Janssen CR. 2015. Microplastics are taken up by mussels (Mytilus edulis) and lugworms (Arenicola marina) living in natural habitats. Environ Pollut. 199:10–17. doi:10.1016/j.envpol.2015.01.008
- Van Cauwenberghe L, Janssen CR. 2014. Microplastics in bivalves cultured for human consumption. Environ Pollut. 193:65–70. doi:10.1016/j.envpol.2014.06.010
- von Moos N, Burkhardt-Holm P, Köhler A. 2012. Uptake and effects of microplastics on cells and tissue of the blue mussel Mytilus edulis L. after an experimental exposure. Environ Sci Technol. 46(20):11327–11335. doi:10.1021/es302332w.
- Ward JE, Kach DJ. 2009. Marine aggregates facilitate ingestion of nanoparticles by suspension-feeding bivalves. Mar Environ Res. 68(3):137–142. doi:10.1016/j.marenvres.2009.05.002.
- Ward JE, Levinton JS, Shumway SE. 2003. Influence of diet on pre-ingestive particle processing in bivalves: I: transport velocities on the ctenidium. J Exp Mar Bio Ecol. 293(2):129–149. doi:10.1016/S0022-0981(03)00218-1.
- Ward JE, Tagart NM. 1989. Influence of marine microalgal metabolites on the feeding behavior of the blue mussel Mytilus edulis. Mar Biol. 101:313–321. doi:10.1007/BF00428127
- Watts A, Lewis C, Goodhead RM, Beckett DJ, Moger J, Tyler C. 2014. Uptake and retention of microplastics by the shore crab Carcinus maenas. Environ Sci Technol. 48(15):8823–8830. doi:10.1021/es501090e.
- Wegner A, Besseling E, Foekema EM, Kamermans P, Koelmans AA. 2012. Effects of nanopolystyrene on the feeding behaviour of the blue mussel (Mytilus edulis L.). Environ Toxicol Chem. 31:2490–2497. doi:10.1002/etc.1984
- Weinstein JE, Crocker BK, Gray AD. 2016. From macroplastic to microplastic: degradation of high‐density polyethylene, polypropylene, and polystyrene in a salt marsh habitat. Environ Toxicol Chem. 35(7):1632–1640. doi:10.1002/etc.3432.
- Weithmann N, Möller JN, Löder MGJ, Piehl S, Laforsch C, Freitag R. 2018. Organic fertilizer as a vehicle for the entry of microplastic into the environment. Sci Adv. 4(4). doi:10.1126/sciadv.aap8060.
- Welden NAC, and Cowie PR. 2016b. Long-term microplastic retention causes reduced body condition in the langoustine, Nephrops norvegicus. Environ Pollut. 214:859–865. doi:10.1016/j.envpol.2016.03.06.
- Wesch C, Bredimus K, Paulus M, Klein R. 2016. Towards the suitable monitoring of ingestion of microplastics by marine biota: A review. Environ Pollut. 218:1200–1208. doi:10.1016/j.envpol.2016.08.076
- Wilkinson J, Hooda PS, Barker J, Barton S, Swinden J. 2017. Occurrence, fate and transformation of emerging contaminants in water: an overarching review of the field. Environ Pollut. 231:954–970. doi:10.1016/j.envpol.2017.08.032Get
- Worldwatch Institute. (2015). Global Plastic Production Rises, Recycling Lags. http://www.worldwatch.org/global-plastic-production-rises-recycling-lags-0 Accessed Mar 2018.
- Xu X-Y, Lee WT, Chan AKY, Lo HS, Shin PKS, Cheung SG. 2017. Microplastic ingestion reduces energy intake in the clam Atactodea striata. Mar Pollut Bull. 124(2):798–802. doi:10.1016/j.marpolbul.2016.12.027.
- Yang D, Shi H, Li L, Li J, Jabeen K, Kolandhasamy P. 2015. Microplastic Pollution in Table Salts from China. Environ Sci Technol. 49(22):13622–13627. doi:10.1021/acs.est.5b03163.
- Zentner E, Gerstl Z, Weisbrod N, Lev O, Pankratov I, Russo D, Gasser G, Voloshenko-Rosin A, Ronen D. 2015. Deep penetration of pharmaceuticals and personal care products through the vadose zone of effluent-irrigated land. Vadose Zone J. 14(1). doi:10.2136/vzj2014.09.0115.
- Zubris KAV, Richards BK. 2005. Synthetic fibres as an indicator of land application of sludge. Environ Pollut. 138(2):201–211. doi:10.1016/j.envpol.2005.04.013.