
 ?Mathematical formulae have been encoded as MathML and are displayed in this HTML version using MathJax in order to improve their display. Uncheck the box to turn MathJax off. This feature requires Javascript. Click on a formula to zoom.
ABSTRACT
Titanium dioxide is a white colourant authorised as food additive E171 in the EU and is applied in a range of food products. Currently the EU specifications for E171 do not refer to the characterisation of particle size distribution; however, this may be requested in the near future. Only a few studies have been published to date reporting data on the size distribution of food grade titanium dioxide. The aim of this study was to characterise the size distribution of titanium dioxide particles contained in eight confectionery products and the pristine titanium dioxide samples used in each of the products. This allowed the direct comparison of the particle size distribution in both the pristine and the extracted materials. By using various analytical techniques, such as transmission electron microscopy, single particle inductively coupled plasma mass spectrometry (sp-ICPMS) and centrifuge liquid sedimentation (CLS) for the characterisation and quantification of the titanium dioxide particle sizes, the impact of the instrumentation on the results was systematically studied. The volume-specific surface area (VSSA) and crystalline structure were also determined for all additives.
Introduction
Titanium dioxide (E171) is an authorised food additive in the EU (European Commission Citation2011b). It is used in a variety of food products such as cheese and cheese products, edible ices, surimi, dressings, non-diary creamers and in personal care products (as CI 77891) such as sun cream and toothpaste and in other consumer products (Weir et al. Citation2012). It is frequently used in chewing gum and in confectionery such as sugar-coated candy and decorations to achieve a white appearance or to make colourants used in food products look brighter and more appealing (Lomer et al. Citation2000; Weir et al. Citation2012; Chen et al. Citation2013; Peters et al. Citation2014; Periasamy et al. Citation2015; Dudefoi et al. Citation2017).
Titanium dioxide as food additive must be labelled according to the provision of Regulation (EU) No. 1169/2011 (European Commission Citation2011). If present also in the form of engineered nanomaterials, according to article 18(3) of this Regulation, this shall be clearly indicated in the list of ingredients. In this case, the name of the ingredient shall be followed by the word ‘nano’ in brackets.
Titanium dioxide occurs in the nature mostly in the form of the minerals brookite, rutile and anatase, however, only rutile and anatase are authorised to be used as E171, both having a tetragonal crystal system (Greenwood and Earnshaw Citation1997). In contrast to non-food applications such as medicines or cosmetics, titanium dioxide used as food additive E171 in food products undergoes no surface treatment and is not coated (European Food Safety Authority Panel on Food Additives and Flavourings Citation2019). Titanium dioxide has a high refractive index and strong light scattering and incident-light reflection capability which is most effective for particles in the size of approximately half the wavelength of the light to be scattered. Accordingly, scattering of visible light is maximised for particles that have a size of 200–350 nm (Theissmann et al. Citation2014; Winkler et al. Citation2018). Although the use of particles with a size of below 100 nm (nano) would seem to be of no use to enhance the appearance of food, studies showed that a fraction of particles in the nano-range can be present (Faust et al. Citation2014; Yang et al. Citation2014; Athinarayanan et al. Citation2015; Dudefoi et al. Citation2017).
As food grade titanium dioxide was permitted to be used in the EU before 20 January 2009, it belongs to those food additives which are subject to Regulation (EU) No. 257/2010 (European Commission Citation2010) requesting a new risk assessment by the European Food Safety Authority (EFSA). Subsequently, EFSA published the results from its re-evaluation of E171 in 2016 (European Food Safety Authority Panel on Food Additives and Nutrient Sources added to Food Citation2016). EFSA through its Panel on Food Additives and Nutrient Sources Added to Food (ANS) concluded that the absorption of orally administered titanium dioxide is extremely low and the low bioavailability of titanium dioxide appears to be independent of particle size.
There are a number of recent research studies investigating the toxicity effects of titanium dioxide especially related to the occurrence of nanoparticles (Bettini et al. Citation2017; Chen et al. Citation2013; Tassinari et al. Citation2014; Athinarayanan et al. Citation2015; Jovanovic Citation2015; Periasamy et al. Citation2015; Heringa et al. Citation2016; Rompelberg et al. Citation2016; Farrell and Magnuson Citation2017; Guo et al. Citation2017; Jia et al. Citation2017; Proquin et al. Citation2017; Pinget et al. Citation2019). In this respect, EFSA evaluated in 2018 the outcome of four recent and specific studies (Bettini, et al. Citation2017; Heringa et al. Citation2016; Guo et al. Citation2017; Proquin et al. Citation2017) regarding whether these would indicate the need for re-opening the EFSA opinion of 2016. EFSA concluded that this would not be the case (European Food Safety Authority Citation2018). The French Agency for Food, Environmental and Occupational Health and Safety (ANSES) published in April 2019 an opinion based on 25 new studies published between 2017 and 2019 (French Agency for Food Citation2019). EFSA, as requested by the European Commission, reviewed the ANSES opinion and concluded that there were no major findings that would overrule the conclusions made in the previous two scientific opinions on the safety of food grade titanium dioxide issued by the EFSA ANS Panel in 2016 and 2018 (European Food Safety Authority Citation2019).
However, already in its 2016 opinion, EFSA noted the need for more data; for example, toxicity data to address data gaps on reproductive system and information related to the particle size distribution of the titanium dioxide, when used as a food additive. Moreover, it was noted that the EU specifications for E171 should also include full characterisation of the particle size distribution of the materials as well as indication on the percentage (in number and by mass) of the particles in the nanoscale together with the information on the analytical methods/techniques used for detection and quantification of the nano-sized particles. In this respect, the European Commission called in early 2017 for data addressing those EFSA recommendations.
Only a few studies have published data on the size distribution of food grade titanium dioxide so far. Some characterised pristine E171 materials whilst others focussed on the size distribution of titanium dioxide particles extracted from food matrices:
Dudefoi et al. (Citation2017) characterised seven pristine food-grade titanium dioxide samples purchased from different European manufacturers for their size distribution, crystallinity and surface properties. The size distribution was determined with transmission electron microscopy (TEM). All samples contained a number-based fraction of 17–36% in the nano-range. Yang and co-workers characterised five different types of pristine titanium dioxides obtained from global food suppliers in China and Italy. They found that nano-sized particles were present in all samples analysed. The investigated pristine E171 materials contained 17–35% by the number of nano-sized constituent particles (<100 nm) (Yang et al. Citation2014). Another research group analysed a sample that was obtained from a large commercial supplier in China, which listed the material as compliant with the EU specifications for E171. TEM analysis revealed that the material contained 23% (by number) of nanoscaled constituent particles (Faust et al. Citation2014). Weir and co-workers investigated a pristine E171 additive that was obtained from a large commercial supplier in Italy. TEM analysis showed a broad size distribution ranging from 30 to 400 nm with at least 36% of the particles (by number) below 100 nm (Weir et al. Citation2012). The interaction of titanium dioxide and silica nanomaterials with food ingredients (e.g. sucrose) was studied by Yussof and co-workers (Yusoff et al. Citation2018). TEM analysis of the commercial E171 used in this study revealed that the size of the constituent particles ranged from 40 to 360 nm, with 32% of them (in number) being less than 100 nm in at least one dimension. Peters and co-workers conducted a study in which they analysed pristine E171 additives, particles extracted from a number of food products and particles extracted from personal care products. In total, seven pristine food grade E171 products were received from suppliers in Germany, China, Italy, the Netherlands and the UK. Size distributions of the pristine E171 materials were determined with scanning electron microscopy (SEM) and ranged from 30 to 600 nm. About 10% (by number) of the constituent particles were found to have dimensions below 100 nm (Peters et al. Citation2014). Following the call by the European Commission in 2017, EFSA has evaluated the characterisation results provided by interested business operators to amend the specifications of E171 related to its particle size (European Food Safety Authority Panel on Food Additives and Flavourings Citation2019).
It is likewise important to understand the impact of food processing on the extractability and characterisation of nanoparticles present in E171. Some research groups studied the size distribution of titanium dioxide particles in extracts from various food matrices by TEM (Weir et al. Citation2012; Chen et al. Citation2013; Peters et al. Citation2014; Dudefoi et al. Citation2017; Lim et al. Citation2018) and single particle inductively coupled plasma mass spectrometry (sp-ICPMS) (Peters et al. Citation2014; Candas-Zapico et al. Citation2018). Given the unavailability of the starting (pristine) E171 materials in these studies, it was however not possible to verify whether the particle size distribution had been altered during the extraction process.
Therefore, the aim of this study was to investigate the size distribution of E171 particles contained in eight finished and semi-finished confectionery products which were kindly provided by the food industry and taken out of their manufacturing process, along with exactly those E171 pristine samples used in each of the products. This allowed direct comparison of the particle size distribution in the pristine and in the extracted materials. To our knowledge, no other study has been published so far in this respect. By using various analytical techniques (TEM, spICPMS and centrifuge liquid sedimentation) the impact of the instrumentation on the results was also systematically studied.
Materials and methods
Test samples
The eight confectionery samples analysed in this study were kindly provided by the German Food Industry (four different companies) and were obtained through the Association of the German Confectionery Industry. Samples () included one custard cream, two semi-finished confectionery products with titanium dioxide in the outer shell and a liquorice core, three confectionery masses with different contents of titanium dioxide and two types of sugar pearls (white and yellow). The yellow sugar pearls contained a pearlescent pigment which according to the description provided by the manufacturer is composed of E171 and E555 (potassium aluminium silicate). For each of the confectionery samples, the corresponding E171 food additive used during its manufacturing was available. Each of the pristine E171 additives had different sample codes assigned by the company that provided the food samples. This, however, did not necessarily imply that the supplier was different. Indeed, the manufacturers did not specify the origin of the specific E171s, except for the one used in the white sugar pearls. According to the product specification sheet, this E171 product had an anatase crystal structure and was produced through the sulphate process. It was approved for food and cosmetic applications and claimed not to contain nanoparticles as conforming to the definition in chapter 1, Article 2, 1 (k) of EC Regulation No 1223/2009 (European Commission Citation2009).
Table 1. Finished and semi-finished food test samples; * contained same type of E171.
In total five different types of E171 were used for the manufacturing of the eight confectionery samples plus one pearlescent pigment for the yellow sugar pearls.
Raman spectroscopy for the determination of titanium dioxide crystalline phases
Raman spectroscopic analysis of the starting materials was performed in dry state without further modification, using a WITec alpha300 confocal Raman microscope equipped with a He-Ne laser operating at 633 nm. Raman spectra were collected using a 10x objective at 2 s accumulation time and 10 measurements were averaged to compare the spectra of the starting E171 powders with the spectra of reference titanium dioxide anatase (Huntsman) and rutile (Kronos) samples without smoothing or baseline subtraction.
Sample preparation – general remarks
The sample preparation step is crucial for the comparability of number-weighted size-distributions of constituent particles in E171 which were determined using different techniques in both pristine and extracted materials. The size-distribution needs to remain unaltered regardless of the sample preparation protocol applied. Size-distribution of the constituent particles can be altered either through the loss of some particles or through modification of the particle’s agglomeration state, during sample preparation. As opposed to TEM, the agglomeration state of the particles is relevant for spICPMS and CLS analysis, as these techniques cannot distinguish between constituent and agglomerated/aggregated particles. Agglomerates of constituent particles are detected as large particles so, for these techniques, it is therefore important to keep the residual amount of agglomerated/aggregated material as low as possible. Sonication is frequently used as a means to break-up agglomerates in this context and the efficiency, effectiveness and speed with which such agglomerates can be broken up into smaller particles depend on such factors as the sonication probe size and shape, the acoustic power and the energy delivered.
Transmission electron microscopy and energy dispersive X-rays analysis (TEM-EDX)
Approximately 1 mg of the powdered pristine E171 additive was dispersed in 1 mL ultrapure water and ultra-sonicated with a vial sonicator (Hielscher Vial Tweeter model UIS250v, Teltow, Germany) for 15 min at 75% amplitude and 50% cycle time. From the confectionery samples, titanium dioxide was extracted by adding 5 mL of ultrapure water to 1–6 pieces of sweets (the amount depended on the type of sweet) followed by 5 min of vigorous manual shaking. Thereafter, the larger undissolved components, such as the liquorice cores in the semi-finished confectionery products, were removed and the remaining aqueous suspensions, mainly containing sugar and titanium dioxide, were centrifuged for 5 min at 3000 g and washed 4 times in 5 mL ultrapure water. The titanium dioxide pellets deposited at the bottom of the vial were then re-suspended in 1 mL ultrapure water and sonicated with a vial sonicator for 15 min under the same sonication conditions as applied for the dispersion of the pristine E171. Aliquots of 3 µL were manually spotted on Formvar Carbon coated 200 mesh copper grids (Agar Scientific, Stansted, United Kingdom) for both the suspended pristine starting materials and the food product extracts. The suspensions were imaged with a JEOL JEM-2100 HR-transmission electron microscopy at 120 kV (JEOL, Italy) coupled to an X-Flash Detector 5030 (Bruker, Italy). The elemental composition was determined with the QUANTAX 200 software (Bruker, Italy). Size distributions were determined with the ImageJ-NANODEFINE Particle Sizer plugin. Particle sizes are expressed as ‘length short axis’ corresponding to the minimum Feret diameter. The sample preparation was based on an in-house developed procedure. The completeness of the particles’ sedimentation during the centrifugation step was verified by analysing the supernatant for the presence of particles.
Single particle ICP-MS
A Perkin Elmer NexIon 300D quadrupole ICPMS, equipped with an SC Fast peristaltic pump, a Meinhard concentric nebuliser, a glass cyclonic spray chamber and a standard quartz torch (2.5 mm i.d) operating in standard mode was used for sp-ICPMS analysis (Perkin Elmer, Waltham, MA, US). Operating conditions were optimised every day to achieve maximum sensitivity. For the setting of all parameters and data acquisition, the Nano Application Module of the Syngistix™ software was used. The dwell time was set at 100 μs and the total data acquisition time at 60 s. The transport efficiency (TE) was determined every day following the ‘particle size’ approach (Pace et al. Citation2011). The exact flow rate of the peristaltic pump required for the determination of the transport efficiency was measured daily and was around 0.17 mL min−1. A 60 nm gold NPs suspension with a concentration of approximately 100000 particles mL−1 and solutions of dissolved gold (blank and four solutions ranging from 1 to 10 μg L−1) were prepared by diluting the stock solutions with ultrapure water. The dissolved ionic gold standard for ICPMS (1 g L−1 in 5% HCl) and gold nanoparticles with a nominal diameter of 60 nm (43.45 μg mL−1 in aqueous 2 mM sodium citrate) were purchased from Sigma-Aldrich (St. Louis, MO, US) and NanoComposix (San Diego, CA, US) respectively. Transport efficiency ranged from 11.3% to 13.8%. For the determination of titanium dioxide nanoparticles, the titanium-48 isotope was monitored setting the mass fraction to 60% and density to 3.9 g cm−3. A 5-point calibration curve ranging from 0 to 15 µg L−1 dissolved titanium in 1% HNO3 was used for calibration. Dissolved ionic titanium standard for ICPMS (1 g L−1 in 2% HNO3) was purchased from Sigma-Aldrich (St. Louis, MO, US). Suspensions of the pristine E171 powdered samples were prepared weighing 50 mg in 50 mL ultrapure water. Extracts of white sugar pearls were prepared weighing 1 g of sugar pearls in 50 mL ultrapure water. Dispersions were then bath-sonicated (Starsonic 35, PBI International, Milan, Italy) for 10 min at maximum power (2 Watt) and filtered through 1.2 µm disc filters applying very low pressure (Whatman, Cellulose acetate membrane, 30 mm, Product code 10462261). Directly after filtration and just before analysis, samples were diluted with ultrapure water to achieve an approximate particle concentration of 1000–2000 particles per 60 s scan time. The sample preparation procedure was taken from a study that investigated the size distribution of highly poly-disperse titanium dioxide in food matrices (Bucher and Auger Citation2019). All samples were prepared in triplicate. Reported values are the average result of the three measurements.
Centrifugal liquid sedimentation
Centrifugal liquid sedimentation (CLS) analysis of the samples was performed as a preliminary check of particle size distributions. As this technique includes a fractionation step before detection, resolution of the size distribution in poly-disperse materials such as E171 is facilitated compared to other fast screening techniques such as batch mode dynamic light scattering. CLS measurements were performed using a line start CPS disc centrifuge (CPS Instruments Europe, Oosterhout, The Netherlands) equipped with a 405 nm laser, using an 8–24% sucrose gradient at a rotation speed of 18000 rpm. PVC particles with diameter of 237 nm were used for calibration before every single measurement. After 10 min of sonication in 1% sodium hexametaphosphate solution, aliquots of 100 μL E171 suspensions at a concentration of 10 µg mL−1 were injected in the disk of the centrifuge. An absorption of 0.075 and the refractive index/density values of anatase (2.49 and 3.84 g cm−3 respectively) were used as input parameters for the calculations. The choice of these values was justified by the Raman data collected in this study.
Volume-specific surface area (VSSA) determination with Brunauer–Emmett–Teller (BET)
The specific surface area (SSA) was determined following the Brunauer–Emmet–Teller (BET) method. This was done using a Gemini VII analyser (Micromeritics Instruments Corp., Norcross, GA, USA) and determining the specific surface area (SSA) at the boiling point of nitrogen (−196°C). Before analysis, gases and vapours that may have adsorbed on the surface of the sample during manufacturing, handling or storage were removed. This was achieved with a VacPrep 061 degassing system (Micromeritics Instruments Corp., Norcross, GA, USA) in which samples were degassed at 60°C for approximately 2 h and then at 200°C for additional 2 h before analysis. Samples not analysed immediately after the degassing procedure were kept under vacuum at 60°C. Before analysis samples were brought to room temperature.
Correct functioning of the instrument was verified by analysing a Carbon Black reference material of known surface area (P/N 004-16833-00 from Micromeritics, Norcross, GA, USA). The volume-specific surface area (VSSA) was obtained by multiplying the specific surface area (SSA, surface per mass) with the skeletal density of anatase (3.84 g cm−3).
Volume-specific surface area estimation using the TEM-based number- weighted size distribution
VSSA estimation of the test samples was calculated using the TEM-based number-weighted size distribution data at 10 nm binning. The centre size (minimum Feret diameter) of the bins was utilised to calculate the surface and volume of a single particle (assuming spherical shape) in each specific bin. Mass of particles was calculated applying a density value of 3.84 g cm−3. The surface and mass values were multiplied with the counts in the actual bin and the total surface and total mass were calculated as a sum of the surfaces and masses of all size bins. The total surface divided with total mass provided the estimation of specific surface area. This value was multiplied with the density to calculate VSSA values (Equation 1) (Hogg Citation2008).
Equation 1:
where ri is the centre size radius of particles in the bin i containing particles with diameter xi-1< di≤xi, Ai is the total surface and mi is the total mass of the particles in bin i containing ni particles (counts). Volume-specific surface area (VSSA) is estimated as a ratio of the total surface and total mass of the particles multiplied with ρ, the density.
Results and discussion
Raman spectroscopy for the determination of titanium dioxide crystalline phases
The crystal structure of all starting materials except the pearlescent pigment was determined with Raman spectroscopy. Results are shown in . The rutile and the anatase phase of titanium dioxide exhibit well separated and distinct Raman bands. All tested E171 materials were unequivocally identified as anatase showing the typical vibrations of anatase at about 145, 197, 399, 515 and 640 cm−1.
Figure 1. Raman spectra of pristine E171 starting sample materials (lower part) and rutile/anatase reference materials (upper spectra).
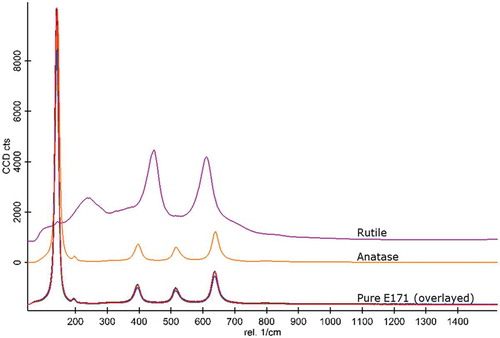
As already mentioned above, pure titanium dioxide exists in three crystal structures, i.e. anatase, rutile and brookite, but only anatase and rutile or mixtures of these two polymorphs are employed in food products (Winkler et al. Citation2018). Moreover, the anatase structure is the most frequently one occurring in E171 (Yang et al. Citation2014; Rompelberg et al. Citation2016; Farrell and Magnuson Citation2017) possibly because it is obtained through the sulphate process which employs simpler technology than the chloride route and can use lower grade and subsequently cheaper ores.
Transmission electron microscopy and energy dispersive X-rays analysis (TEM-EDX) of the samples tested
TEM analysis has been used to determine the particle number-size distributions of all pristine E171s and the extracts of the respective semi-finished and finished confectionery products in which they were used as additive. Number-size distributions and number-weighted cumulative percentage distributions are depicted in and for all products except the pearlescent pigments containing yellow sugar pearls. These are discussed separately.
Figure 2. Transmission electron microscopy. Number-weighted size distributions of titanium dioxide particles in pristine E171 additives (starting materials) and extracted materials. Histograms of absolute frequency (counts) and cumulative functions.
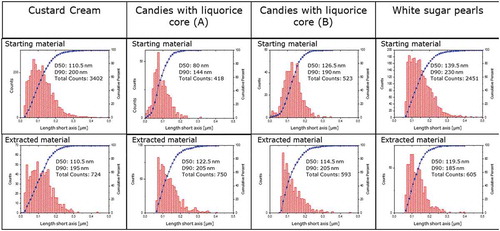
Figure 3. Transmission electron microscopy. Number-weighted size distributions of titanium dioxide particles in pristine E171 additives (starting materials) and extracted confectionery masses. Histograms of absolute frequency (counts) and cumulative functions.
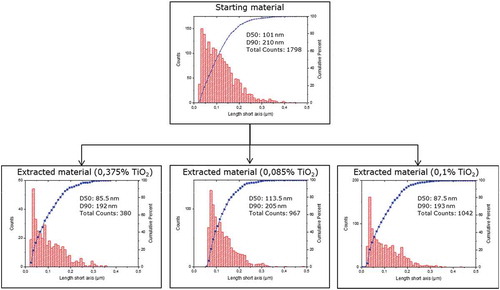
The size range of titanium dioxide particles is similar in all pristine additives spanning from approximately 10–350 nm. Differences in the size distribution can however already be observed visually and are confirmed by their respective number-weighted D50 (median) values, their mean size and by the percentage of particles with a size below 100 nm ().
Table 2. TEM analysis: number of analysed particles, number-weighted mean size, D50 and relative frequency of particles in the nanoscale of pristine E171 additives and extracted particles.
D50 values of all but one of the pristine E171s range from 101 to 139.5 nm whereas the percentage of particles smaller than 100 nm ranges from 23.6% to 49.3%. This is in good agreement with the findings of other studies which report percentages of particles in the nanoscale in the range of 17–36% (Weir et al. Citation2012; Faust et al. Citation2014; Yang et al. Citation2014; Dudefoi et al. Citation2017; Yusoff et al. Citation2018) with the exception of one study (Peters et al. Citation2014) that reported a percentage around 10%. Data submitted by the industry to the EFSA on the particle size characteristics of E171 showed that the percentage of particles by number <100 nm ranged between 11% and 39% (European Food Safety Authority Panel on Food Additives and Nutrient Sources added to Food Citation2016).
The E171 used in the liquorice containing candies (A) was found to have a noticeable different particle size distributions compared to all other E171-tested materials. It contained a significantly higher amount of particles in the nano-size range (66%).
For one of the E171 samples tested – the one used for the manufacturing of the white sugar pearls – the origin was known. As stated in the product specification sheet this material should not contain nanoparticles according to the nanomaterials definition given in the European Regulation on cosmetic products in chapter 1, Article 2, 1(k) (European Commission Citation2009). Here a nanomaterial is defined as an ‘insoluble or biopersistant and intentionally manufactured material with one or more external dimensions, or an internal structure, on the scale from 1 to 100 nm’. Compared to the size distribution of the other investigated E171 samples in this study, this additive did indeed not contain particles in the size-range 10–70 nm. It did however nonetheless contain approximately 20% of particles <100 nm. The statement given in the product specification sheet refers supposedly to the fact that material has not been manufactured with the intention to contain nanoparticles. It is however not the aim of this study to interpret the definition whether the intentionality refers to the material in its totality or to the nano-size fraction only.
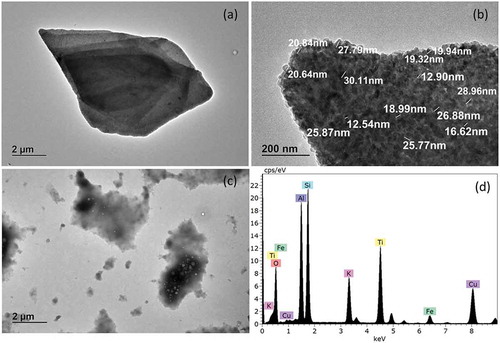
shows a TEM image of the pearlescent pigment used in the yellow sugar pearls. Large platelets of several micrometres coated with 15–25 nm particles are visible. Energy dispersive X-ray analysis (EDX) identified the smaller particles on the surface as being titanium dioxide. The additional presence of Si, Al and K indicates that the platelet cores consist of mica, otherwise known as potassium aluminium silicate. According to the current definition of E171 (European Commission Citation2012), certain rutile grades of titanium dioxide are produced using mica as a template to form the basic platelet structure. The surface of the mica is then coated with titanium dioxide using a specialised patented process. All of the mica is finally removed with an extractive dissolution procedure resulting in a mica-free platelet form of rutile titanium dioxide. Since according to the EDAX results the investigated pigment still contains potassium aluminium silicate, the investigated material would consequently not be covered by the current definition of food grade titanium dioxide.
Figure 4. TEM images of pearlescent pigment used in yellow sugar pearls. (a) Lower magnification of pigment, (b) higher magnification of pigment surface, (c) extracted material, (d) energy dispersive x-ray analysis. Spectrum belonging to sub-figure (B).
Having access to both the pristine E171 and the respective food products in which these were used allowed direct comparison of the particle size distribution of the extracted and the pristine material. The particle size distribution was well reproduced for the particles extracted from the custard cream and its related starting material. A relatively good matching was observed for particles extracted from the white sugar pearls and the three confectionery masses and the respective pristine additives. A lower correspondence was found for the two types of candies with a liquorice core. The size distributions of these two products, depicted in , show that in the extracted material particles with a size <50 nm are not detected.
A possible explanation is that the extraction process of the candies did not entirely remove all matrix components and that these residuals did induce errors in the automated particle counting procedure of the TEM image. An indication of this hypothesis can be observed in .
Figure 5. TEM images of titania particles and matrix residuals (highlighted) in candy extracts.
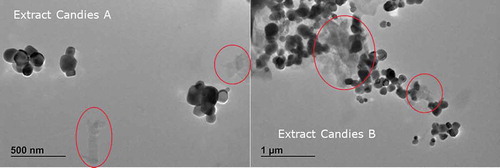
The light-grey areas visible in the TEM images, highlighted with red circles, can be associated with residual matrix components. Both liquorice-incorporating candies are covered with an outer shell which is composed of sugar, titanium dioxide and waxes (personal communication, Prof. Reinhard Matissek, 5 March 2019, Food Chemistry Institute (LCI) Cologne). Waxes such as carnauba wax are commonly used on the surface of candies as glazing agent (Godshall Citation2016; de Freitas et al. Citation2019). Assuming that the water-soluble sugar was completely removed during the extraction process, it is likely that the light-grey residues visible in the image can be associated with hydrophobic waxes which were not entirely removed. An alternative, less likely, the explanation is that small suspended wax droplets selectively embedded very fine E171 particles, which were then removed with the supernatant during the washing/centrifugation step. The manufacturing process of the samples might also have led to the removal of some of the smaller particles.
These results show how even in relatively simple matrices such as those investigated in this study, sample preparation, i.e. the extraction process can have an impact on the particle size distribution. The altered number-size distribution may then have an impact on the interpretation of whether an extracted material is or is not a nanomaterial according to the European Commission recommended definition (European Commission Citation2011a). This demonstrates the need for validated and harmonised sample preparation protocols prior to the particle size characterisation and determination.
Single particle ICP-MS
The pristine E171 samples were analysed on their particle size distribution by single particle ICP-MS. The cumulative number of distributions are illustrated in .
Figure 6. Single particle ICP-MS – cumulative number distribution of titanium dioxide particles of four E171 pristine starting materials and the extract of white sugar pearls. The legend includes the number of analysed particles.
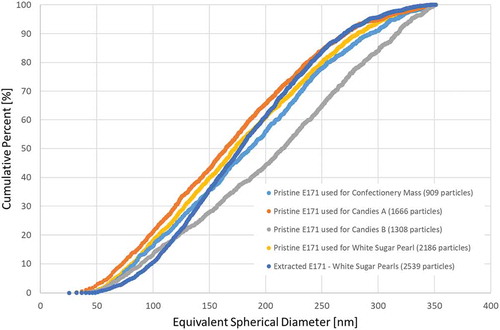
The analysed particle sizes ranged from 40 nm to approximately 350 nm. The lower limit is however dictated by the size detection limit (DLs) which in sp-ICPMS strongly depends on the nature of the element (Lee et al. Citation2014; Aznar et al. Citation2017). Consequently, particles below this size are not detected. The TEM analysis, as discussed above, demonstrated that all pristine E171 materials except the one used for the manufacturing of the white sugar pearls contained particles which were smaller than 40 nm. A relevant part of existing titanium dioxide particles could therefore not be detected by using sp-ICPMS. It must be stressed that this results in an underestimation of the total amount of particles and the percentage of particles in the nanoscale while it overestimates the D50-values. This evidence can indeed be observed when comparing D50-values and percentages of particles in the nanoscale determined with TEM () and with sp-ICPMS ().
Table 3. Single particle ICP-MS analysis: number of analysed particles, median of the number-weighted size distribution and relative frequency of particles in the nanoscale of pristine E171 additives and particles extracted from white sugar pearls.
Moreover, sp-ICPMS cannot distinguish between constituent particles and agglomerated/aggregated particles. An agglomerate of constituent particles is detected as one larger particle. In the presence of agglomerates, the amount of larger particles will therefore be overestimated while the amount of smaller (constituent) particles will be underestimated. Hence, single particle ICPMS does not provide the same amount and detail of information that TEM is able to deliver. For polydisperse materials such as E171, which contain particles below 40 nm, sp-ICPMS is not capable of providing the number-weighted size distribution over the whole range for which nanoparticles are defined. Depending on the purpose of the measurement this might in some cases be sufficient. For the assessment of a nanomaterial according to the EC recommended definition, sp-ICPMS can however only be used as a screening technique combined with electron microscopy (EM) analysis as confirmatory technique (Verleysen et al. Citation2015).
The comparison of the particle size distributions of the pristine E171 and the extracted material for the white sugar pearls showed that the two distributions match well for this confectionery product (see and ).
Centrifugal liquid sedimentation
The results obtained by CLS as depicted in ) shows that – according to their absorption-based distribution – all pristine E171s had a particle-size distribution mode between 100 and 400 nm with the smallest value of about 230 nm measured for the starting material of Candies A. The absorption-based measurements were well reproducible – as illustrated by the three parallel measurements for the E171 used for Candies A in ). Transformation to mass-based size distribution ()) shows that values close to the lower edge of the size distribution were however not well reproducible, due to possible artefacts introduced by the transformation of instrument noise to signal during calculations.
Figure 7. Size distributions determined with CLS. (a) Absorbance-based/extinction-weighted size distributions for E171 particles extracted from different food products, (b) absorbance-based/extinction-weighted size distributions for E171 particles extracted from Candies A (three replicate measurements), (c) mass-weighted size-distribution of particles extracted from Candies A, (d) number-weighted size-distribution of particles extracted from Candies A.
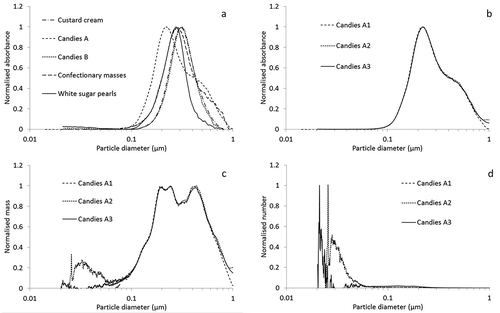
This becomes even more evident when looking at number-weighted distributions ()) generated from the mass distributions supposing simple spherical geometry of the particles. Moreover, even if CLS has a good size resolution it cannot distinguish between single particles and agglomerates/aggregates and consequently it is poorly suited to the direct determination of number-based particle size distributions. However, the good size resolution permits it to be used to obtain fast qualitative information on the relative agglomeration/aggregation state of materials.
Volume-specific surface area determination by Brunauer–Emmett–Teller (BET)
The volume-specific surface area (VSSA) is a property of materials that in this study was obtained by multiplying the specific surface area (SSA, surface per mass) by the material’s skeletal density (Wohlleben et al. Citation2017). It can be used on most dry powder materials as a criterion to identify nanomaterials according to the EU definition (European Commission Citation2011). Results obtained from Raman spectroscopy identified all investigated titanium dioxide samples as anatase; thus a density of 3.84 g cm−3 was used for the calculations. Results – all samples were analysed in triplicate – are given in .
Table 4. Surface areas (SSA), volume-specific surface area (VSSA) and TEM-based VSSA estimation (VSSA TEM) determined for six pristine E171 additives.
Volume-specific surface areas ranged from 31.01 to 40.60 m2 cm−3 with 5 out of 6 materials being in the range of 30–35 m2 cm−3. Only the E171 used for the manufacturing of Candies A (with liquorice core) showed a slightly higher VSSA. This indicated that the average particle size in this E171 sample was smaller compared to the others. This finding was confirmed by the number-size distributions obtained with TEM as described above. VSSAs estimated/calculated using the particle size distribution determined with TEM as the basis, are generally in good agreement with the effectively measured VSSAs. Surprisingly the SSA of the pearlescent pigment used in the yellow sugar pearls did not strongly differ from the others. Due to the presence of large mica platelets, a much lower VSSA was expected in this case. A possible explanation is that the VSSA is primarily driven by the small titanium dioxide particles with which the platelet surface is coated. However, a difference between the pearlescent pigments and the pristine E171 samples could be observed by the larger relative standard deviation of the VSSA over the three replicates. This difference might be attributed to lower homogeneity of this material.
For all E171 samples the VSSA was below 60 m2 cm−3, the upper value for positive identification of nanomaterials according to the Commission Recommendation on the definition of a nanomaterial (European Commission Citation2011). The recommendation however specifies that the ‘VSSA > 60 m2 cm−3 criterion’ can only be reliably used to for the positive identification of nanomaterials (Wohlleben et al. Citation2017). The opposite is not necessarily true and results deriving from number-size distributions should in that case prevail. An example for such a case could be observed for the pristine E171 starting material used for the manufacturing of the liquorice containing Candies A. TEM results revealed that 66% of the particles (in number) are in the nano-size range whereas the VSSA was below 60 m2 cm−3. The calculated TEM-VSSA is similar to the VSSA determined by gas adsorption. Hence, the origin of this discrepancy is related to the material’s polydispersity (the shape of the distribution function), which underlines/emphasises the difference between the number-weighted median and the VSSA-equivalent diameter.
Conclusions
The strong point of this study is its unique sample base; a selection of E171-containing confectionery products and the pristine titanium dioxides that were used in their production. This allowed the direct comparison between the particle size distributions in both. The size distribution of all tested pristine E171 materials was similar and spanned from approximately 10–350 nm with a relevant portion of particles in the size-range 1–100 nm. However, it is important to note that even in relatively simple food matrices such as those investigated in this study, the extraction process can have an impact on the particle size distribution and underlines the importance of well-planned particle extraction procedures.
Comparison of particle size distributions determined with TEM, sp-ICPMS and centrifugal liquid sedimentation (CLS) showed that electron microscopy is currently the only analytical technique which can reasonably be expected to give a quantified measure of the constituent particle size distribution over the full size range. Although sp-ICPMS is a promising technique able to generate the number-based particle size distribution, it can – at the time being – only be used for screening purposes for polydisperse materials such as E171. CLS has proven to be a fast and reliable screening technique to generate absorption-based particle size distributions for titanium dioxide samples. However, the turbidity-measurement-based centrifugal particle sedimentation method showed some limitations when evaluating number-weighted distributions in the sub 100 nm range. These were most probably due to the noise amplified by the transformations from absorption to mass and from mass to number-weighted distributions.
This study included the interesting case of a material, which is not unambiguously identified as a nanomaterial by VSSA, but by transmission electron microscopy (according to the Commission’s recommended definition of nanomaterials).
To summarise, validated and harmonised sample preparation protocols are necessary to ensure the accurate determination of the particle size distributions. Moreover, the analytical technique used for the determination of the particle number-size distributions – as demonstrated for E171 in this study – can have a significant impact on the number/portion of constituent nanoparticles found. This is important to take into consideration by implementing the Commission Recommendation for nanomaterials definition.
Disclaimer
The information and views set out in this study are those of the author(s) and do not necessarily reflect the official opinion of the European Commission. The European Commission does not guarantee the accuracy of the data included in this study. Neither the European Commission nor any person acting on the European Commission’s behalf may be held responsible for the use that may be made of the information contained therein.
Acknowledgements
The authors are grateful to selected companies that provided the confectionery products and especially to the Federal Association of the German Confectionery Industry.
Disclosure Statement
The authors declare no conflicts of interest.
Additional information
Funding
References
- Athinarayanan J, Alshatwi AA, Periasamy VS, Al-Warthan AA. 2015. Identification of nanoscale ingredients in commercial food products and their induction of mitochondrially mediated cytotoxic effects on human mesenchymal stem cells. J Food Sci. 80(2):N459–464.
- Aznar R, Barahona F, Geiss O, Ponti J, José Luis T, Barrero-Moreno J. 2017. Quantification and size characterisation of silver nanoparticles in environmental aqueous samples and consumer products by single particle-ICPMS. Talanta. 175:200–208.
- Bettini S, Boutet-Robinet E, Cartier C, Coméra C, Gaultier E, Dupuy J, Naud N, Taché S, Grysan P, Reguer S, et al. 2017. Food-grade TiO2 impairs intestinal and systemic immune homeostasis, initiates preneoplastic lesions and promotes aberrant crypt development in the rat colon. Sci Rep. 7:40373.
- Bucher G, Auger F. 2019. Combination of 47Ti and 48Ti for the determination of highly polydisperse TiO2 particle size distributions by spICP-MS. J Anal At Spectrom. 34(7):1380–1386.
- Candas-Zapico S, Kutscher DJ, Montes-Bayon M, Bettmer J. 2018. Single particle analysis of TiO2 in candy products using triple quadrupole ICP-MS. Talanta. 180:309–315.
- Chen XX, Cheng B, Yang YX, Cao A, Liu JH, Du LJ, Liu Y, Zhao Y, Wang H. 2013. Characterization and preliminary toxicity assay of nano-titanium dioxide additive in sugar-coated chewing gum. Small. 9(9–10):1765–1774.
- de Freitas CAS, de Sousa PHM, Soares DJ, da Silva JYG, Benjamin SR, Guedes MIF. 2019. Carnauba wax uses in food – a review. Food Chem. 291:38–48.
- Dudefoi W, Terrisse H, Richard-Plouet M, Gautron E, Popa F, Humbert B, Ropers MH. 2017. Criteria to define a more relevant reference sample of titanium dioxide in the context of food: a multiscale approach. Food Addit Contam Part A. 34:653–665.
- European Commission. 2009. Commission Regulation (EU) No 257/2010 of 25 March 2010 setting up a programme for the re-evaluation of approved food additives in accordance with Regulation (EC) No 1333/2008 of the European Parliament and of the Council on food additives. Off J Eur Union L80/19. 83:19ff
- European Commission. 2010. Commission Regulation (EU) No 257/2010 of 25 March 2010 setting up a programme for the re-evaluation of approved food additives in accordance with Regulation (EC) No 1333/2008 of the European Parliament and of the Council on food additives. Off J Eur Union L80/19. 83:19ff
- European Commission. Commission (EU) No 1169/2011 on the provision of food information to consumers. Off J Eur Union L304/18. 2011. 54:18ff.
- European Commission. 2011a. EC recommendation of 18 October 2011 on the definition of nanomaterial (2011/696/EU). Off J Eur Union L275/38. 54:38
- European Commission. 2011b. Commission (EC) No 1333/2008 of the European Parliament and of the Council of 16 December 2008 on food additives. Off J Eur Union L354/16. 51:16ff.
- European Commission. 2012. Commission Regulation (EU) No 231/2012 of 9 March 2012 laying down specifications for food additives listed in Annexes II and III to Regulation (EC) No 1333/2008 of the European Parliament and of the Council. Off J Eur Union L83/1. 55:1ff
- European Commission. 2019. Commission (EC) No 1223/2009 of the European Parliament and of the Council of 30 November 2009 on cosmetic products. Off J Eur Union L 342/59. 52:59ff.
- European Food Safety Authority. 2018. Evaluation of four new studies on the potential toxicity of titanium dioxide used as a food additive (E 171). EFSA J. 16(7):5366.
- European Food Safety Authority. 2019. EFSA statement on the review of the risks related to the exposure to the food additive titanium dioxide (E 171) performed by the French agency for food, environmental and occupational health and safety (ANSES). EFSA J. 17(6):5714.
- European Food Safety Authority Panel on Food Additives and Flavourings. 2019. Scientific opinion on the proposed amendment of the EU specifications for titanium dioxide (E171) with respect to the inclusion of additional parameters related to its particle size. EFSA J. 17(7):5760.
- European Food Safety Authority Panel on Food Additives and Nutrient Sources added to Food. 2016. Scientific opinion on the re-evaluation of titanium dioxide (E 171) as a food additive. EFSA J. 14(9):4545.
- Farrell TP, Magnuson B. 2017. Absorption, distribution and excretion of four forms of titanium dioxide pigment in the rat. J Food Sci. 82:1985–1993.
- Faust JJ, Doudrick K, Yang Y, Westerhoff P, Capco DG. 2014. Food grade titanium dioxide disrupts intestinal brush border microvilli in vitro independent of sedimentation. Cell Biol Toxicol. 30:169–188.
- French Agency for Food, Environmental and Occupational Health & Safety. 2019. AVIS de l’Agence nationale de sécurité sanitaire de l’alimentation, de l’environnement et du travail relatif aux risques liés à l’ingestion de l’additif alimentaire E171. Saisine n° 2019-SA-0036.
- Godshall MA. 2016. Candies and sweets: sugar and chocolate confectionery. In: Elsevier, editor. Encyclopedia of food and health. Oxford, UK: Academic Press; p. 621–627.
- Greenwood NN, Earnshaw A. 1997. Chemistry of the elements. In: 21 - titanium, zirconium and hafnium. Second ed. Oxford, UK: Butterworth-Heinemann; p. 954–975.
- Guo Z, Martucci NJ, Moreno-Olivas F, Tako E, Mahler GJ. 2017. Titanium dioxide nanoparticle ingestion alters nutrient absorption in an in vitro model of the small intestine. NanoImpact. 5:70–82.
- Heringa MB, Geraets L, van Eijkeren JC, Vandebriel RJ, de Jong WH, Oomen AG. 2016. Risk assessment of titanium dioxide nanoparticles via oral exposure, including toxicokinetic considerations. Nanotoxicology. 10:1515–1525.
- Hogg R. 2008. Issues in particle size analysis. KONA Powder Part J. 26:81–93.
- Jia X, Wang S, Zhou L, Sun L. 2017. The potential liver, brain, and embryo toxicity of titanium dioxide nanoparticles on mice. Nanoscale Res Lett. 12(1):478.
- Jovanovic B. 2015. Critical review of public health regulations of titanium dioxide, a human food additive. Integr Environ Assess Manag. 11:10–20.
- Lee S, Bi X, Reed RB, Ranville JF, Herckes P, Westerhoff P. 2014. Nanoparticle size detection limits by single particle ICP-MS for 40 elements. Environ Sci Technol. 48:10291–10300.
- Lim J-H, Bae D, Fong A. 2018. titanium dioxide in food products: quantitative analysis using ICP-MS and Raman spectroscopy. J Agric Food Chem. 66:13533–13540.
- Lomer MCE, Thompson RPH, Commisso J, Keen CL, Powell JJ. 2000. Determination of titanium dioxide in foods using inductively coupled plasma optical emission spectrometry. Analyst. 125:2339–2343.
- Pace HE, Rogers NJ, Jarolimek C, Coleman VA, Higgins CP, Ranville JF. 2011. Determining transport efficiency for the purpose of counting and sizing nanoparticles via single particle inductively coupled plasma mass spectrometry. Anal Chem. 83:9361–9369.
- Periasamy VS, Athinarayanan J, Al-Hadi AM, Juhaimi FA, Mahmoud MH, Alshatwi AA. 2015. Identification of titanium dioxide nanoparticles in food products: induce intracellular oxidative stress mediated by TNF and CYP1A genes in human lung fibroblast cells. Environ Toxicol Pharmacol. 39:176–186.
- Peters RJB, van Bemmel G, Herrera-Rivera Z, Helsper HPFG, Marvin HJP, Weigel S, Tromp PC, Oomen AG, Rietveld AG, Bouwmeester H. 2014. Characterization of titanium dioxide nanoparticles in food products: analytical methods to define nanoparticles. J Agric Food Chem. 62:6285–6293.
- Pinget G, Tan J, Janac B, Kaakoush NO, Angelatos AS, O’Sullivan J, Koay YC, Sierro F, Davis J, Divakarla SK, et al. 2019. Impact of the food additive titanium dioxide (E171) on Gut microbiota-host interaction. Front Nutr. 6:57.
- Proquin H, Rodriguez-Ibarra C, Moonen CG, Urrutia Ortega IM, Briede JJ, de Kok TM, van Loveren H, Chirino YI. 2017. Titanium dioxide food additive (E171) induces ROS formation and genotoxicity: contribution of micro and nano-sized fractions. Mutagenesis. 32:139–149.
- Rompelberg C, Heringa MB, van Donkersgoed G, Drijvers J, Roos A, Westenbrink S, Peters R, van Bemmel G, Brand W, Oomen AG. 2016. Oral intake of added titanium dioxide and its nanofraction from food products, food supplements and toothpaste by the Dutch population. Nanotoxicology. 10:1404–1414.
- Tassinari R, Cubadda F, Moracci G, Aureli F, D’Amato M, Valeri M, De Berardis B, Raggi A, Mantovani A, Passeri D, et al. 2014. Oral, short-term exposure to titanium dioxide nanoparticles in Sprague-Dawley rat: focus on reproductive and endocrine systems and spleen. Nanotoxicology. 8:654–662.
- Theissmann R, Kluwig M, Koch T. 2014. A reproducible number-based sizing method for pigment-grade titanium dioxide. Beilstein J Nanotechnol. 5:1815–1822.
- Verleysen E, Van Doren E, Waegeneers N, De Temmerman PJ, Abi Daoud Francisco M, Mast J. 2015. TEM and SP-ICP-MS analysis of the release of silver nanoparticles from decoration of pastry. J Agric Food Chem. 63:3570–3578.
- Weir A, Westerhoff P, Fabricius L, Hristovski K, Von Goetz N. 2012. Titanium dioxide nanoparticles in food and personal care products. Environ Sci Technol. 46:2242–2250.
- Winkler HC, Notter T, Meyer U, Naegeli H. 2018. Critical review of the safety assessment of titanium dioxide additives in food. J Nanobiotechnology. 16:51.
- Wohlleben W, Mielke J, Bianchin A, Ghanem A, Freiberger H, Rauscher H, Gemeinert M, Hodoroaba VD. 2017. Reliable nanomaterial classification of powders using the volume-specific surface area method. J Nanopart Res. 19:61.
- Yang Y, Doudrick K, Bi X, Hristovski K, Herckes P, Westerhoff P, Kaegi R. 2014. Characterization of food-grade titanium dioxide: the presence of nanosized particles. Environ Sci Technol. 48:6391–6400.
- Yusoff R, Nguyen LTH, Chiew P, Wang ZM, Ng KW. 2018. Comparative differences in the behavior of TiO2 and SiO2 food additives in food ingredient solutions. J Nanopart Res. 20:76.