
 ?Mathematical formulae have been encoded as MathML and are displayed in this HTML version using MathJax in order to improve their display. Uncheck the box to turn MathJax off. This feature requires Javascript. Click on a formula to zoom.
ABSTRACT
A tiered intake assessment approach, ranging from the conservative default and refined budget method to refined dietary exposure assessments using national food consumption surveys is presented and applied to derive maximum potential global colour intake estimates. The US and UK markets served as representative for the world and the EU, respectively, to determine the maximum potential exposure ceilings for eleven colours in various sub-populations, including brand-loyal consumers. Industry-reported global use levels were assigned as the maximum level. Conservative intake assessments for food colours used in non-alcoholic beverages were estimated for the general population 2 + y, toddlers, children 3–9 y, adolescents 10–17 y, adults 18–64 y, elderly 65–74 y, very elderly 75 + y based on assumed uses in high intake markets. Refined dietary exposures were estimated using either the 2-day food consumption data from the 2013–2016 US National Health and Nutrition Examination Survey or the 4-day food consumption data from the 2008–2016 U.K. National Diet and Nutrition Survey Rolling Programme. In the most refined market-share adjusted assessment, brand-specific market volume data were used to place appropriate weight on corresponding beverage type uses. Strong concordance between the refined budget method and the brand-loyal deterministic approach was shown, in which the latter assumes that the maximum use level of the colour is present in 100% of non-alcoholic beverages. This study shows that safety of colours – both synthetic and natural – in beverages at proposed use levels can be supported for any geography, with all intake estimates falling below the acceptable daily intake in refined assessments. Importantly, this study demonstrates that the refined budget method is a valid first-tier screening assessment to prioritise food colours that may benefit from more refined intake assessments when warranted.
Introduction
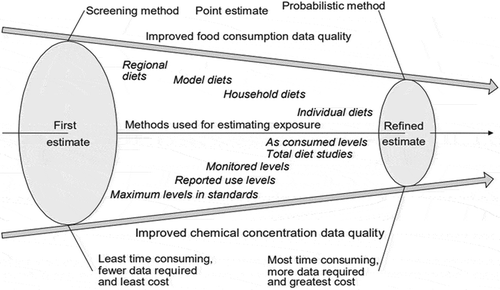
The objective of the study is to compare different intake assessment methods ranging from the conservative traditional Budget Method screening to the more refined and resource-intensive estimated daily intake assessments (at the person level) to demonstrate if and when the more resource intensive refined assessments may be warranted. The methods draw from the tiered intake assessment concept as laid out within the International Programme on Chemical Safety’s Principles and methods for the risk assessment of chemicals in food (IPCS Citation2009b, see ).
Figure 1. Stepwise approach to obtain realistic dietary exposure assessement (IPCS, Citation2009b, EHC 240).
In view of recent interest in estimating global intakes for several colour provisions in non-alcoholic beverages (CCFA Citation2019), the study applies the tiered methodology to evaluate the maximum potential intake of elevenFootnote1 synthetic colours globally.
Food colours’ primary purpose is to improve the organoleptic properties of the food or beverage and meet consumer expectations and preferences, specifically its visual cues (Elliot and Maier Citation2014; Elliot Citation2015). Additionally, food colours provide initial cues on composition and taste of beverage product (e.g. orange for orange-flavoured products, shades of yellow for mango – or citrus-flavoured products, red for cherry-flavoured products, etc.). The intensity of the coloured product will signal the intensity of the flavour, e.g. lighter hues may be associated with a ‘hint’ of a flavour while more intense hues may signal more intense flavours. The range of use levels varies depending on the desired colour intensity that appeals to diverse consumers based on differing social, cultural and geographical backgrounds.
Synthetic colours tend to be more acid- and heat- and light-stable, reliable and versatile than natural colours. Even so, natural colours are gaining more prominence as alternatives to synthetic colours in limited applications, as chemistries and matrix compatibilities are improved. A wide range of factors, including pH, packaging, base colour, processing conditions, temperature and shelf-life, can impact the stability and performance of naturally derived colours for a given application. Water-soluble (straight colours) are used in water-based flavoured non-alcoholic beverages.
Although regulatory frameworks worldwide allow beverage formulators the opportunity to utilise any one or a collection of food colours for specific applications, the use of food colours is often scrutinised as it has been hypothesised that children’s exposure to food dyes is correlated with behavioural effects (FDA Citation2011, Citation2019; OEHHA Citation2019). Efforts to ensure continued safe use of relevant colours have been made within specific markets, for example, by the US Food and Drug Administration (FDA), European Food Safety Authority (EFSA), Food Standards Australia New Zealand, South Korea, India, Japan and ANVISA Brazil among others (FDA Citation2019; Doell et al. Citation2016; EFSA Citation2009a, Citation2009b, Citation2009c, Citation2009d, Citation2010a, Citation2010b, Citation2010c, Citation2013, Citation2014a, Citation2014b, Citation2015a, Citation2015b, Citation2015c, Citation2015d, Citation2015e, Citation2019a, Citation2019b; FSANZ Citation2008; Ha et al. Citation2013; Dixit et al. Citation2010; Yamada et al., Citation2000; Toledo et al., Citation1992; JECFA Citation2019; Bastaki et al Citation2017; Harp et al. Citation2013; Stevens et al. Citation2015), and across markets by the Joint FAO/WHO Expert Committee on Food Additives (JECFA Citation2011, Citation2016, Citation2017). Nevertheless, differences in global and regional food colour uses in water-based flavoured non-alcoholic beverages due to consumer expectations and preferences make it challenging to estimate global intakes for critical sub-populations (e.g. children) that are simultaneously conservative (overestimates) and within the bound of reasonableness.
Readily accessible food consumption data from representative countries with high water-based flavoured non-alcoholic beverage consumption (e.g. the United States for the globe and the United Kingdom for the European Union region) along with industry-reported global maximum use levels were integral to the tiered intake assessment so as to determine the possible ceiling for global intakes (i.e. maximum potential intakes) among various subpopulations, including children. The US was selected as it is one of the countries with highest water-based flavoured non-alcoholic beverage consumption (see Popkin and Hawkes Citation2016). The UK was selected to represent Europe, because it was used in several EFSA colour evaluations, including tartrazine, azorubine, sunset yellow, quinoline yellow, brilliant black, brilliant blue and curcumin (see EFSA Citation2009a, Citation2009b, Citation2009c, Citation2009d, Citation2010a, Citation2010b, Citation2010c; respectively), and as reported by EFSA, the UK adult population “is considered to be one of the highest consumers of soft drinks in Europe”.
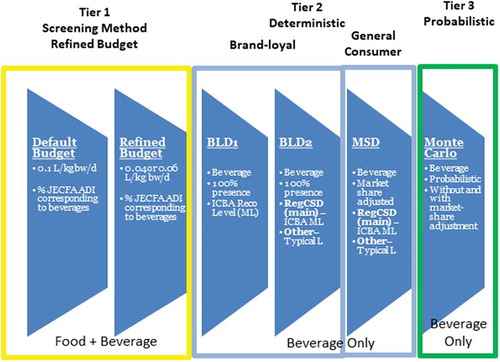
As part of a tiered approach, the assessments were stepwise, with the initial screening based on default and conservative assumptions, and subsequent assessments with model refinements and more realistic intake scenarios through the integration of brand-specific market volume data. Refinements still maintained conservatism by assuming the fraction of the beverage category containing any one of the eleven colours under review corresponded to the fraction for a given colour thereby substantially overestimating intake for that given colour (see Materials and Methods, ). Results from the various intake modelling scenarios are compared to determine whether the refined budget method can serve as a valid first-tier screening assessment to prioritise only those colours that may require further in-depth intake assessments.
Table 1. Types of beverages and colour use levels.
Table 2. Proportion of beverages (based on U.S. market volume) with colours.
Materials and methods
Food consumption data
United States (US)
Estimated beverage consumption amounts were based on food consumption records collected in the ‘What We Eat in America’ (WWEIA) component of the National Health and Nutrition Examination Survey (NHANES) conducted in 2013–2014 and 2015–2016 (NHANES 2013–2016). NHANES is a continuous survey that uses a complex multistage probability sample designed to be representative of the civilian US population (NCHS Citation2016, Citation2018). The NHANES datasets provide nationally representative nutrition and health data and prevalence estimates for nutrition and health status measures in the United States. Statistical weights are provided by the National Centre for Health Statistics (NCHS) to adjust for the differential probabilities of selection and non-response.
As part of the examination, trained dietary interviewers collected detailed information on all foods and beverages consumed by respondents in the previous 24-h time period (midnight to midnight). A second dietary recall was administered by telephone three to 10 days after the first dietary interview, but not on the same day of the week as the first interview. The dietary component of the survey is conducted as a partnership between the US Department of Agriculture (USDA) and the U.S. Department of Health and Human Services (DHHS). DHHS is responsible for the sample design and data collection, and USDA is responsible for the survey’s dietary data collection methodology, maintenance of the databases used to code and process the data, and data review and processing. A total of 14,532 individuals in the survey period 2013–2016 provided 2 complete days of dietary recalls.
United Kingdom (UK)
Estimated beverage consumption amounts were based on food consumption records collected in the UK National Diet and Nutrition Survey Rolling Programme (NDNS RP). The NDNS RP is a continuous cross-sectional survey, designed to assess the diet, nutrient intake and nutritional status of the general population aged 1.5 years and older living in private households in the UK. A representative sample of around 1000 people (500 adults and 500 children) take part in the NDNS RP each year. The NDNS RP comprises an interview, a 4-day estimated diet diary, physical measurements and a blood and urine sample. The survey is carried out in all four countries of the UK and is designed to be representative of the UK population. The core NDNS RP is jointly funded by Public Health England (PHE) and the UK Food Standards Agency (FSA). The NDNS RP is carried out by a consortium comprising NatCen Social Research (NatCen) and the Medical Research Council Elsie Widdowson Laboratory (MRC EWL) with fieldwork in Northern Ireland carried out by the Northern Ireland Statistics and Research Agency (NISRA). A detailed description of the survey methodology for the NDNS survey, including sample selection are published online (PHE Citation2019).
This study uses combined results from Years 1 to 8 of the NDNS RP (2008/2009 – 2015/2016) for a sample of the UK population designed to be nationally representative. Fieldwork was conducted continuously throughout each year in order to take into account potential seasonal variations in food consumption. The data are statistically weighted by FSA to minimise any bias in the observed results which may be due to differences in the probability of households and individuals being selected to take part and to attempt to reduce non-response bias. Year 1 of the RP included two week days and two weekend days for each person. Year 2 onwards was designed so that all days of the week would be (as far as possible) equally represented.
Beverage types and colour levels
Reported average and maximum use levels in water-based flavoured non-alcoholic beverages for the eleven colours being evaluated herein (i.e. allura red, amaranth, annatto norbixin, azorubine (carmoisine), brilliant black, brilliant blue, curcumin, paprika extract, quinoline yellow, sunset yellow, and tartrazine) are provided in . These use levels were based on an extensive global beverage industry colour use survey conducted from April to July 2019. Colour use level information was supplied by the global beverage industry through the International Council of Beverages Associations (ICBA) membership. Both multi-national beverage companies (including, among others, Keurig Dr Pepper, Pepsi Co, The Coca-Cola Company) and national and regional beverage associations such as the American Beverage Association (ABA), Australian Beverage Council (ABC), Associacao Brasileira das Industrias de Refrigerantes e de Bebidas nao Alcoolicas (ABIR), Cámara Costarricense de la Industria Alimentaria (CACIA), Canadian Beverage Association (CBA), Soft Drinks Europe (UNESDA) and the Japanese Soft Drink Association (JSDA), among others, participated in the extensive data collection effort. Colour use level information received captures the vast majority of non-alcoholic beverages sold globally. The ‘average’ and ‘maximum reported global use level’ in beverages across product portfolios (for each participating multi-national company) and across companies’ portfolios (for each participating national and regional beverage association) were requested. Upon data blinding and aggregating, the ‘average’ use level for each colour was calculated by averaging across all averages reported while the ‘maximum reported global use level’ was typically based on the highest across all use levels reported. Nevertheless, as verification of reported use levels against all globally marketed beverages is not feasible, few products for which higher colour use levels are needed may exist in certain jurisdictions.
Food codes corresponding to the water-based flavoured non-alcoholic beverages were identified within WWEIA, NHANES 2013–2016 for the US diet and the NDNS RP (2008/2009–2015/2016) for the UK diet. For completeness food selection was based on the overarching water-based flavoured non-alcoholic beverage category (14.1.4) within the Codex General Standard for Food Additives (GSFA) and accompanying sub-categories: 14.1.4.1 (carbonated), 14.1.4.2 (non-carbonated). 14.1.4.3 (powders, syrups, concentrates). The lists of the NHANES food codes and the NDNS RP food codes included in this study are provided in Supplemental Appendices I and II, respectively.
Market share data
Market share information for various beverages is regularly gathered by the Beverage Marketing Corporation (BMC Citation2019). Similar to the stratification in Martyn et al. (Citation2017), water-based flavoured non-alcoholic beverages were stratified according to conventional beverage types defined by industry, namely: regular carbonated soft drinks (regCSDs), low- and no-calorie sweetened (LNCS) carbonated soft drinks (LNCS CSD), flavoured water, juice drinks, energy drinks, sports drinks, ready-to-drink (RTD) tea, and RTD coffee. Ingredient labels for US brands making up more than generally 80% of the market volume for a given beverage type (data not shown) were reviewed for ingredient declarations of any of the eleven colours. The proportions of these beverage types with ‘any’ colour use (limited to the eleven colours being evaluated in this study) are summarised in . Market volume data from the US market were assumed to be representative for the UK market as well and were applied only to the market-share adjusted deterministic (MSD) approach described more fully below.
Budget method
Overview
In 1979, the budget method was developed to derive screening estimates of the maximum food additive levels that can be used in the food and/or beverage supply without exceeding the food additive Acceptable Daily Intake (ADI) (Hansen Citation1979; JECFA Citation2001).
The budget method has also been used to assess the theoretical maximum daily dietary exposure (TMDE) to some food additives (IPCS Citation2009b). The method is based on default assumptions regarding the estimates of consumption of solid foods and of non-milk beverages, maximum concentration of the additive in foods and in non-milk beverages, and the proportion of solid foods and of non-milk beverages that may contain the additive (see equation 1).
The default consumption estimates used in the calculation of the TMDE are based on the following assumptions regarding maximum physiological levels of consumption:
The concentrations of the additive in solid foods and non-milk beverages are the maximum reported use levels of the additive.
Daily non-milk beverage consumption of 0.1 litre kg-bw−1. This non-milk beverage consumption level translates to 6 L of non-milk beverages for a 60 kg person, which is well above the 2 L default value for chronic daily total liquid intake (milk, tap-water, other beverages) typically assumed for adults (EFSA Citation2012).
Daily solid food consumption of 100 kcal kg-bw−1, which is equivalent to 0.05 kg-food kg-bw−1 when assuming an energy density of 2 kcal g−1 (Hansen Citation1979). This solid food consumption level translates to 3 kg of food for a 60 kg person, which is a conservative estimate, since consumption data from the NHANES indicate that the total daily intake of both foods and beverages is about 3 kg (data not shown).
The proportions of solid foods and non-milk beverages that may contain the additive are arbitrary estimates – the default proportions of 12.5% for solid foods and 25% for non-milk beverages are often used in Europe (EC Citation1998). For children, a default proportion of 100% has been assigned to non-milk beverages in some cases (e.g. EFSA Citation2009a; JECFA Citation2012). Alternatively, data from food and beverage manufacturers could be used.
As noted above, estimates of the TMDE are from both foods and beverages. For this study, the reverse assessment as originally described 1979 budget method (Hansen Citation1979; JECFA, Citation2001) was conducted to calculate the theoretical maximum beverage concentration (TMBC) for the colour additives of interest. Potential food contributions were accounted for in TMBC by assigning only a portion of the ADI to beverages. Description of data and method used to determine the ADI-apportioned fraction for beverages is further detailed below. Additionally, refinements to the default consumption estimates within the TMBC approach were made to better capture more reasonable physiological limits, as described further below. Based on the ADI-apportioned fraction for beverages, TMBC of a colour additive in beverages can be calculated using equation 2:
JECFA ADI apportioned fraction for beverages
The Joint (FAO/WHO) Expert Committee on Food Additives (JECFA) ADI was utilised in view of the global nature of reported uses for this assessment. The proportion of the ADI assigned to beverages was based on colour dietary intake assessments previously conducted by either the US FDA or EFSA.
For the US assessment, the portion of the ADI assigned to beverages for each colour was based on the colour intake assessment conducted by Doell et al. (Citation2016). Doell et al. (Citation2016) presented the percent contributions of various food categories and beverages to the total intake of colours for the US population age 2 y and older, children 2–5 y, and teenaged boys 13–18 y in a series of charts. The total percent contribution from beverages were determined for allura red, brilliant blue, sunset yellow and tartrazine and applied to each accordingly. The average percent contributions from these four colours were then applied to all other colours of interest herein including those that were not evaluated by Doell et al. (Citation2016). The beverage percent contributions to total colour intake used to assign the portion of the ADI for beverages for children 2–5 y and 2 USD + y are summarised in .
Table 3. Beverage apportioned JECFA ADI.
The UK assessments leveraged EFSA’s opinions on Allura red (EFSA Citation2015a), amaranth (EFSA Citation2013), annatto norbixin-based (EFSA Citation2019a), azorubine (EFSA Citation2015b), brilliant black (EFSA Citation2015c), brilliant blue (EFSA Citation2010b), curcumin (EFSA Citation2014a), paprika (EFSA Citation2015d), quinoline yellow (EFSA Citation2015e), sunset yellow (EFSA Citation2014b) and tartrazine (EFSA Citation2009a) to determine the average percent contribution of non-milk beverages to the total estimated intakes of these colours for the various subpopulations typically assessed by EFSA (data are summarised in Supplemental Appendix III). Based on the average contribution, each colour was assigned to one of three overall beverage contribution categories: Low (26%), Mid (40%), and High (69%). In the current assessment, for the UK 1.5 + y population, the portion of the ADI assigned to beverage is based on the overall contribution category assignment for that colour, see . The portion of the ADI assigned to beverage for toddlers is also summarised in .
Tiered assessments
The budget method assessment (Broad Tier 1) for beverages was conducted stepwise in two sub-tiers, with sub-tier a (“default”) using the default budget method assumptions, including:
daily beverage consumption rate 0.1 L kg-bw−1
Twenty-five percent (25%) of non-milk beverages containing the additive for adolescents, adults, and elderly, and 100% assumed for toddlers and young children.
In sub-tier b (“refined”), US and UK beverage consumption rates were used in place of the default daily beverage consumption rate. Description of the refined beverage consumption rates is summarised below. Also, in the refined budget method assessment, the assumption of 25% of non-milk beverages containing the additive was applied to all subpopulations, except toddlers and children for whom 100% was assumed (see ).
Figure 2. Tiered intake assessements.
In both the “default” and “refined” budget methods, the maximum colour use levels were compared to the derived TMBC.
Beverage consumption in “refined” budget method
Data from the US NHANES 2015–16 were used to estimate the 95th percentile consumption (on L kg-bw−1 day−1) of all beverages, excluding milk and tap water for various US subpopulations. The maximum consumption across the subpopulations was 0.06 L kg-bw−1 day−1 for toddlers 12–35 months (data not shown). This maximum beverage consumption value was used in the refined assessment instead of the default 0.1 L kg-bw−1 day−1 for both young children (2–5 y) and the US general population 2 + y.
UK’s beverage consumption rate was derived based on UK consumption estimates compiled by EFSA. The following beverage categories were included in EFSA’s beverage consumption estimates:
L1 level: Fruit and vegetable juices and nectars (including concentrates)
L1 level: Coffee, cocoa, tea and infusions
Subsets of L1 level: Water and water-based beverages, specifically: L2 level: Beverages concentrates & L2 level: Water-based beverages
Data used in the UK assessment were limited to “consumer only, chronic” evaluations in the EFSA summaries. An overall 95th percentile was derived as follows: sum the 95th percentile for the beverage type subcategory with the maximum 95th percentile and the mean consumption for the remaining beverage type categories. The highest “calculated” 95th percentile beverage consumption are for toddlers (0.04 L kg-bw−1 day−1). Therefore, for the UK’s “refined” budget method the beverage consumption rate of 0.04 L kg-bw−1 day−1 was used, instead of the default 0.1 L kg-bw−1 day−1, to derive the TMBC of the colour additive for both toddlers (18–35 mo) and the UK general population (1.5 + y).
Estimating intake with national food consumption surveys
Estimates of maximum potential colour intake were derived by combining relevant beverage consumption amounts (as reported in the US NHANES 2013–2016 and UK NDNS RP 1–8, high beverage-consuming markets as described above) with corresponding global colour use levels, assuming these colours are permitted in both the US and UK markets. Deterministic assessments were conducted in a stepwise manner to assess dietary exposure to colours.
Three different deterministic assessments were conducted for each colour, including two brand loyal (BLD) and one market share adjusted (MSD) scenarios (see ). The assumptions that were made for each assessment scenario are summarised below in . The most conservative assessment scenario is the brand loyal scenario 1 (BLD-1), where the reported maximum colour use levels (in the world) were applied to all beverages. Each successive scenario is more refined, with the most refined Scenario 3 (MSD) applying the appropriate fraction of the volume market share that contains ‘any’ of the eleven colours to the use level for a given colour in the corresponding beverage type.
Table 4. Tiered assessment scenarios.
The mean, 90th and 95th percentile estimates were derived for the following age groups for both markets: Toddlers 12–35 months (US) or Toddlers 18–35 months (UK), Children 3–9y, Adolescents 10–17y, Adults 18–64y, Elderly 65–74y, and Very elderly.
A comparative assessment of outputs between the BLD-1 ‘beverage only’ approach and relevant maximum permissible levels (MPLs) or brand-loyal ‘food and beverage’ colour assessments performed by the U.S. FDA and EFSA was conducted to assess the degree of conservatism across methods (see Supplemental Appendix IV, Tables 1 and 2).
Results
Budget method
The “default” and the “refined” budget method calculated TMBC for each colour assessed in this study for water-based flavoured non-alcoholic beverages (in mg kg−1) is provided in and , respectively. The reported maximum global use levels in beverages are also included for reference.
Table 5. Theoretical maximum beverage concentration (TMBC) for colour in beverages based on the ‘default’ budget method.
Table 6. Theoretical maximum beverage concentration (TMBC) for colour in beverages based on the ‘refined’ budget method.
In the “default” budget method for both US 2 + y consumers and UK 1.5 + y consumers, the reported maximum global use levels in beverages exceeded the TMBC for all colours except in the following instances: brilliant black, brilliant blue, paprika extract, tartrazine, and sunset yellow (UK only). Whereas for toddlers/young children in the “default” budget method, the TMBC were exceeded for all eleven colours (see ).
In the “refined” budget method for all consumers (US 2 + y and UK 1.5 + y), the reported maximum global use levels in beverages were at or below the TMBC for most colours, except for amaranth, annatto extracts (norbixin-based), and quinoline yellow (US only). Among toddlers/young children, the TMBC were exceeded for allura red, amaranth, annatto (norbinxin-based), azorubine, quinoline yellow, curcumin (UK only), and sunset yellow (US only) (see ).
Estimated daily intake using national food consumption surveys
US NHANES
The per consumer daily intake of the eleven colours based on the brand-loyal deterministic and market-share deterministic assessment scenarios were generated for six US sub-populations: toddlers 12–35 months, children 3–9 y, adolescents 10–17 y, adults 18–64 y, elderly 65–74 y, very elderly 75 + y. Mean, 90th and 95th percentile estimated daily intake (expressed in mg kg-bw−1 day−1 using each individual reported body weight) were derived.
For all of the brand-loyal deterministic assessment scenarios based on the US NHANES, the per consumer mean, 90th and 95th percentile intakes for all subpopulations for five colours (brilliant black, brilliant blue, curcumin, paprika extract and tartrazine) were below their respective JECFA ADIs (see ). Since the estimated daily intake (EDI) were well below their respective JECFA ADIs even when based on the most conservative brand loyal deterministic scenario 1 (BLD-1), where the maximum use level was applied to all beverages, they can be set aside (i.e. no safety concern) and no further refined assessments would be necessary.
Table 7. Per consumer estimated daily intake of brilliant black, brilliant blue, curcumin, paprika extract and tartrazine, mg kg-bw−1 day−1, 2-day average; US NHANES 2013–2016.
Based on the brand-loyal deterministic assessment scenarios for five other colours (allura red, annatto norbixin-based, azorubine, quinoline yellow and sunset yellow), the mean, 90th and 95th EDIs were below their respective JECFA ADIs for all assessment scenarios and all subpopulations (i.e. BLD-2, MSD), except for the most conservative brand-loyal scenario 1 (BLD-1), i.e. the assessment where the reported maximum global colour use levels were assumed to be present across the entire water-based flavoured non-alcoholic beverage category (see ). Under the BLD-1 scenario, for toddlers, the 90th and 95th EDIs exceeded the JECFA ADI for allura red, annatto norbixin-based, and quinoline yellow, and the 95th EDI exceeded the JECFA ADI for azorubine and sunset yellow. However, it is worthwhile noting that the exceedance for azorubine and sunset yellow were limited to only 8.5% and 14%, respectively, of the corresponding JECFA ADI. For children 3–9 y under the BLD-1 scenario, the 90th and 95th EDI exceeded the JECFA ADI for annatto norbixin-based, and only the 95th EDI exceeded the JECFA ADI for allura red and quinoline yellow. Among adolescents 10–17 y and adults 18–64 y, under the BLD-1 scenario, the 95th EDI exceeded the JECFA ADI for annatto norbixin-based only (see ).
Table 8. Per consumer estimated daily intake of allura red, annatto norbixin, azorubine, quinoline yellow and sunset yellow, mg kg-bw−1 day−1, 2-day average; US NHANES 2013–2016.
For amaranth, the per consumer estimated daily intake exceeded the JECFA ADI for the most conservative brand-loyal deterministic assessment scenario 1 (BLD-1) at the mean, 90th and 95th percentile for toddlers 12–35 months and children 3–9 y; at the 90th and 95th percentiles for adolescents 10–17 y, adults 18–64 y and elderly 65–74 y; and, at the 95th percentile intake estimates for the very elderly. Similar patterns were observed for the next most conservative assessment (BLD-2) with the following differences: children 3–9 y exceeded the JECFA ADI only at the 90th and 95th percentile, the elderly 65–74 y exceeded only at the 95th percentile and the very elderly did not exceed the JECFA ADI. The next tier (MSD) did not have any exceedances (see ).
Table 9. Per consumer estimated daily intake of amaranth, mg kg-bw−1 day−1, 2-day average; US NHANES 2013–2016, JECFA ADI: 0.5 mg kg-bw−1 day−1.
UK NDNS
Similarly, the per consumer daily intake of the eleven colours based on the UK NDNS were developed for six UK subpopulations: toddlers 18–35 months, children 3–9 y, adolescents 10–17 y, adults 18–64 y, elderly 65–74 y, very elderly 75 + y. Consistent with findings from the US NHANES, the per consumer mean, 90th and 95th percentile intake for brilliant black, brilliant blue, paprika extract and tartrazine, were below their respective JECFA ADIs for all brand-loyal deterministic scenarios. Similar findings were found for curcumin, except that the 95th percentile estimated intake among toddlers slightly exceeded the JECFA ADI in the most conservative brand-loyal scenario 1 (BLD-1) wherein the reported maximum global use level was assumed for all beverages (see ).
Table 10. Per consumer estimated daily intake of brilliant black, brilliant blue, curcumin, paprika extract and tartrazine, mg kg-bw−1 day−1, 4-day average; UK NDNS RP 1–8.
Also, consistent with the US NHANES findings, the mean, 90th and 95th EDIs for all subpopulations for five other colours (allura red, annatto norbixin-based, azorubine, quinoline yellow and sunset yellow) were below their respective JECFA ADIs for all assessment scenarios (i.e. BLD-2, MSD), except for the most conservative brand loyal scenario (BLD-1), in toddlers primarily, where the maximum reported global use levels were assumed for the entire water-based flavoured non-alcoholic beverage category (see ). Under the BLD-1 scenario, for toddlers, the mean, 90th and 95th EDIs exceeded the JECFA ADI for annatto norbixin-base, while only the 90th and 95th EDI exceeded the JECFA ADI for allura red, azorubine, quinoline yellow and sunset yellow. For children 3–9 y under the BLD-1 scenario, the 90th and 95th EDI exceeded the JECFA ADI for allura red, annatto norbixin-based and quinoline yellow, while only the 95th EDI exceeded the JECFA ADI for sunset yellow. However, it is worthwhile noting that the exceedance for sunset yellow among this age group was limited to 3.25% of the JECFA ADI. Among adolescents 10–17 y, under the BLD-1 scenario, only the 95th EDI exceeded the JECFA ADI for annatto norbixin-based (See ).
Table 11. Per consumer estimated daily intake of allura red, annatto norbixin, azorubine, quinoline yellow and sunset yellow, mg kg-bw−1 day−1, 4-day average; UK NDNS RP 1–8.
The results for amaranth based on the assessment using the UK NDNS were also similar to the results from the US NHANES. In the BLD-1 scenario, the per consumer estimated daily intake at the mean, 90th and 95th percentile estimated intakes for toddlers and children, and the 90th and 95th percentile estimated intakes for adolescents and adults exceeded the JECFA ADI. In the BLD-2 scenario, the per consumer estimated daily intake at the mean, 90th and 95th percentile for toddlers, children (excluding the mean), adolescents (excluding the mean) and adults (excluding the mean and 90th percentile) exceeded the JECFA ADI as well. The MSD scenario did not have findings that exceeded the JECFA ADI (see ).
Table 12. Per consumer estimated daily intake of amaranth, mg kg-bw−1 day−1, 4-day average; UK NDNS RP 1–8, JECFA ADI: 0.5 mg kg-bw−1 day−1.
Discussion
This study presents a tiered assessment approach to derive conservative global intake estimates of colours. The “refined” budget method, presented herein as an alternative to the traditional budget method, was shown to be a streamlined conservative method that provides an effective screening tier that appropriately prioritises those beverage additives that may require further in-depth refined intake assessments, saving significant time and resources. There is confidence in the output of the “refined” budget method (that factors in both food and beverages) in view of strong concordance with the most conservative ‘beverage only’ 95th percentile brand-loyal deterministic assessment (BLD-1).
Likewise, the conservatism of the ‘beverage only’ brand-loyal deterministic approach conducted herein was maintained despite the ‘beverage only’ focus, as opposed to the ‘foods and beverages’ one. The output from the BLD-1 ‘beverage only’ estimates (either 90th or 95th percentile) for both US and UK markets, respectively, was also as conservative as (and within range of) corresponding to estimates from either the FDA ‘food and beverage’ 90th percentile high exposure maximum analytical level assessments or the EFSA ‘food and beverage’ 95th percentile brand-loyal assessments, respectively, for which colour assessments exist and for which outputs were adjusted by an appropriate factor to account for different use levels inputted into the various models (see Supplemental Appendix IV, Tables 1 and 2, respectively). This phenomenon can be explained by the fact that ‘food and beverage’ consumers have a broader consumer-base effectively diluting the cumulative estimated intake as compared to the higher estimated intakes from ‘beverage only’ consumers. This is also demonstrated, for example, in the tartrazine and sunset yellow FDA assessments (e.g. see Supplemental Tables 7(a, c) and 8(a, c) in Doell et al. Citation2016). The BLD-1 assessment is a refined intake assessment based on national food consumption survey of high beverage consuming markets, assuming: (i) 100% presence of a given colour across the entire non-milk water-based flavoured non-alcoholic beverage category, (ii) at the reported global maximum use level.
The results from both the “refined” budget method and the BLD-1 assessments would indicate that four colours (brilliant black, brilliant blue, paprika extract, and tartrazine) can be set aside, i.e. no safety concern. For all sub-populations, both the reported maximum global use levels for these colours in beverages were below the TMBC and the 90th and 95th percentile EDIs for these colours (for both the US and UK BLD-1 assessments) were well below their respective JECFA ADIs.
Similarly, for most consumers, both the “refined” budget method and the BLD-1 assessments would flag amaranth and annatto norbixin-based for further refinements. The reported maximum global use levels for these two colours exceed the TMBC in the refined budget method assessment (based on the beverage-apportioned JECFA ADI) while the mean, 90th and 95th percentile EDI exceed their respective JECFA ADI in the BLD-1 assessments. For toddlers/young children and children, both the refined and BLD-1 assessments would also prioritise allura red, quinoline yellow and sunset yellow for further refinement, as the TMBC is exceeded in the refined budget method while the 90th percentile EDI – considered high intake consumers – exceeds the JECFA ADI in the BLD-1 assessment.
Noteworthy is that while both the “refined” budget method and BLD-1 assessments may prioritise azorubine and curcumin for further assessments, these exceedances were observed primarily at the 95th percentile EDI (considered extremely high intake consumers) and only among toddlers in the BLD-1 assessment. For curcumin, the 95th percentile EDI exceedance of the JECFA ADI was only demonstrated for the UK toddlers and limited to 13% compared to a 25% TMBC exceedance in the refined budget method for the same sub-population. For azorubine, exceedances of the JECFA ADI were at the 95th percentile EDI for US toddlers (8.5%) and the 90th and 95th percentile EDIs for UK toddlers (4.5% and 34%, respectively). These results further coincide with findings from the “refined” budget method in which only US young children and UK toddlers show TMBC exceedances of 2.2% and 3.3%, respectively. These results should not typically raise concern in view of the conservative nature of both the BLD-1 assessments and the “refined” budget method. The above demonstrates the strong concordance between the “refined” budget method and the brand-loyal deterministic BLD-1 approach.
Together, these results demonstrate the utility of the “refined” budget method as a valid and effective streamlined alternative approach that very closely approximates the extremely conservative brand-loyal deterministic BLD-1 assessment. Since the budget method is intended to serve as a first-tier screening assessment, more robust and refined intake assessments would be warranted only for those colours with reported (or proposed) maximum use levels significantly exceeding the “refined” budget method-calculated TMBC. The next tiers of refined intake assessments would then follow the 2009 International Programme on Chemical Safety (IPCS) guidance on dietary exposures to substances, including the use of the preferred and more precise national survey consumption data over summary statistics (IPCS Citation2009b).
Relative to the next tier refined intake assessments, the current study selected the US and UK food consumption data based generally on: (i) anticipated higher beverage consumption rates compared to other markets and regions (Popkin and Hawkins Citation2016; EFSA Citation2009a, Citation2009b, Citation2009c, Citation2009d, Citation2010a, Citation2010b, Citation2010c), and (ii) availability of respective current national survey data. Utilising these higher beverage consumption markets as representative markets in these assessments enables identification of the maximum potential colour intake estimates thereby setting the ceiling for global estimates, such that if safety is achieved for these ‘high intake’ representative markets based on the maximum global use levels of each colour (even if some colours are not permitted within either the US or UK markets) then no safety concerns should exist for all markets globally. Further, national survey data are preferred to regional (or global) summary statistics because of the level of granularity afforded by national survey data enabling more precise and realistic intake assessments (IPCS, Citation2009b).
Also, as noted previously, the focus on “beverage only” consumers in the tiered and refined brand-loyal deterministic assessments (including for BLD-1, BLD-2) further elevates the global ceiling intake estimates. For example, the 95th percentile BLD-1 tier for almost all colours evaluated yielded an estimated intake ceiling either more conservative than the high exposure scenario (maximum use level)/high ‘food and beverage’ consumer intake (at the 90th percentile) derived by Doell et al. (Citation2016) for similar US subpopulations or equivalent to either the Maximum Permissible Level (MPL) or brand-loyal ‘food and beverage’ consumer intake (at the 95th percentile) derived by EFSA after factoring for the different levels inputted into these models (See Supplemental Appendix IV, Tables 1 and 2, respectively). Thus, there is a high confidence in the conservative nature of the refined brand-loyal ‘beverage only’ consumer deterministic approach presented herewith.
Refining exposure estimates by assigning reported maximum global use levels to the brand-loyal beverage type that contributes most to colour intake (i.e. regular CSD) and average use levels to the other beverage types (BLD-2), or by incorporating volume market share data to the deterministic scenario (MSD), the EDI’s for allura red, annatto norbixin-based, azorubine, curcumin, quinoline yellow and sunset yellow fell well below their respective JECFA ADIs, including for the 95th percentile estimates (considered extremely high consumers) among toddlers. Thus, safety would be affirmed for these colours in view of the conservative nature of these refined models, including the conservative assumption that global maximum use levels are used across 100% of the brand-loyal regular CSD beverage type among the 95th percentile toddler consumers.
While the EDI for amaranth exceeded the JECFA ADI for both the BLD-1 and BLD-2 brand-loyal deterministic assessment scenarios across most subpopulations, further refinement to the deterministic assessment scenario (i.e. MSD) resulted in mean, 90th and 95th percentile EDI falling below the JECFA ADI in all cases across all subpopulations.
Relative to the risk assessment paradigm, some concepts that should not be overlooked include the conservative nature of the ADI (IPCS, Citation2009a)
The ADI is derived from a No Observed Adverse Effect Level (NOAEL);
The NOAEL may be based on chronic exposure over one’s lifetime and assumes exposure at that level every day for 25,550 days (for a 70-year average lifespan);
The ADI applies a 100-fold safety factor to the NOAEL, accounting for interspecies differences (i.e. extrapolating from relevant animal models to humans) and intraspecies variability (i.e. extrapolating from adults to toddlers and across sensitive subpopulations).
Slight ADI exceedances when estimating daily intake should not immediately signal a safety concern.
Moreover, additional layers of conservatism are also introduced into the risk assessment paradigm when determining the EDI (IPCS Citation2009b). The degree of conservatism in the EDI depends ultimately on the approach utilised. For example, to attain a more realistic EDI, ‘usual’ intakes across days should be calculated rather than acute single day intakes, especially when comparing to a ‘chronic’ ADI. Additional conservative assumptions may include 100% presence of the additive across the entire food category of interest, the food additive is present at the maximum reported level across the non-milk water-based flavoured non-alcoholic beverage category or even in specified beverage types, etc.
Thus, the combined effect of the conservative nature of the ADI and the conservative approach to the EDI yields an extremely conservative risk assessment (even when multiple refinements are implemented). These conservative assumptions (built into the risk assessment paradigm) afford flexibility in choosing the appropriate use levels for ingredients/additives in wide-ranging foods and beverages applications.
Some limitations exist in the present assessment. The refined intake assessments using national consumption survey data were based on 2 or 4-day dietary recall data. The same general limitations found in cross-sectional studies such as the accuracy of the consumption estimates based on dietary recalls from survey participants apply to this study. An additional limitation (perhaps viewed as a strength by some) of this study is the limited number of recall days which would yield more conservative beverage consumption amounts. Finally, the market share information applied to only the MSD scenario was based solely on the US market. Nevertheless, multiple strengths of the study include application of the maximum reported global colour use levels (based on a global survey that included input from several multi-national beverage companies and national beverage associations from several countries) to the brand-loyal deterministic Scenarios 1 (all beverages) and 2 (brand-loyal RegCSD) assessments and leveraging national consumption surveys from high beverage consuming markets (i.e. U.S., U.K.).
Overall, this study shows that the modified “refined” budget method is a valid first-tier screening assessment. The refined budget method provides a streamlined and slightly more reasonable alternative to the traditional budget method, and better prioritises those beverage additives that may benefit from further detailed in-depth intake assessments, consequently maximising limited resources. Based on the screening level assessments with the “refined” budget method, and further refined dietary exposure assessments using national food consumption surveys from high beverage consuming markets, serving as representative markets for the world or the European Union region, this study also supports the safety of the use (or proposed use) of the eleven colours in beverages generally at the maximum reported global use levels.
Supplemental Material
Download MS Word (40.3 KB)Supplemental Material
Download MS Word (76.1 KB)Disclosure Statement
The authors do not have any conflict of interest.
Supplementary Material
Supplemental data for this article can be accessed on the publisher’s website.
Correction Statement
This article has been republished with minor changes. These changes do not impact the academic content of the article.
Additional information
Funding
Notes
1. Allura red, amaranth, annatto norbixin, azorubine (carmoisine), brilliant black, curcumin, paprika extract, quinoline yellow, sunset yellow, and tartrazine were among the colours under review by the CCFA and relevant to the non-alcoholic beverage industry. Brilliant blue was added to the current assessment for completeness.
References
- Bastaki M, Farrell T, Bhusari S, Bi X, Scrafford C. 2017. Estimated daily intake and safety of FD&C food-colour additives in the US population. Food Addit Contam Part A. 34(6):891–904.
- [CCFA] Codex Committee on Food Additives. 2019 March. Report of the 51st session of the CODEX committee on food additives. Jinan (China): CCFA. p. 25–29.
- [BMC] Beverage Marketing Corporation. 2019. Who we are. New York (NY): Beverage Marketing Corporation. [accessed 2019Dec14]. https://www.beveragemarketing.com/who-we-are.asp.
- Dixit S, Purshottam SK, Gupta SK, Khanna SK, Das M. 2010. Usage pattern and exposure assessment of food colours in different age groups of consumers in the state of Uttar Pradesh India. Food Add Contam Part A. 27(2):181–189.
- [EFSA] European Food Safety Authority. 2009a. Scientific opinion on the re-evaluation tartrazine (E 102) on request from the European commission. Efsa J. 7:1331.
- [EFSA] European Food Safety Authority. 2009b. Scientific opinion on the re-evaluation of azorubine/carmoisine (E 122) as a food additive on request the European commission. Efsa J. 7:1332.
- [EFSA] European Food Safety Authority. 2009c. Scientific opinion on the re-evaluation of sunset yellow FCF (E 110) as a food additive on request from the European commission. Efsa J. 7:1330.
- [EFSA] European Food Safety Authority. 2009d. Scientific opinion on the re-evaluation of quinoline yellow (E 104) as a food additive on request from the European commission. Efsa J. 7:2579.
- [EFSA] European Food Safety Authority. 2010a. Scientific opinion on the reevaluation of brilliant black BN (E 151) as a food additive on request from the European commission. Efsa J. 8:1540.
- [EFSA] European Food Safety Authority. 2010b. Scientific opinion on the reevaluation of brilliant blue FCF (E 133) as a food additive. Efsa J. 8:1853.
- [EFSA] European Food Safety Authority. 2010c. Scientific opinion on the re-evaluation of curcumin (E 100) as a food additive on request from the European commission. Efsa J. 8:1679.
- [EFSA] European Food Safety Authority. 2012. Scientific opinion - guidance on selected default values to be used by the EFSA scientific committee, scientific panels and units in the absence of actual measured data. Efsa J. 10:2579.
- [EFSA] European Food Safety Authority. 2013. Refined exposure assessment for amaranth (E 123). Efsa J. 11:3442.
- [EFSA] European Food Safety Authority. 2014a. Refined exposure assessment for curcumin (E 100). Efsa J. 12:3876.
- [EFSA] European Food Safety Authority. 2014b. Scientific opinion on the reconsideration of the temporary ADI and refined exposure assessment for Sunset Yellow FCF (E 110). Efsa J. 12:3765.
- [EFSA] European Food Safety Authority. 2015a. Refined exposure assessment for allura red AC (E 129). Efsa J. 13:4007.
- [EFSA] European Food Safety Authority. 2015b. Refined exposure assessment for azorubine/carmoisine (E 122). Efsa J. 13:4072.
- [EFSA] European Food Safety Authority. 2015c. Refined exposure assessment for brilliant black BN (E 151). Efsa J. 13:3960.
- [EFSA] European Food Safety Authority. 2015d. Scientific opinion on the re-evaluation of paprika extract (E 160c) as a food additive. Efsa J. 13:4320.
- [EFSA] European Food Safety Authority. 2015e. Refined exposure assessment for quinoline yellow (E 104). Efsa J. 13:4070.
- [EFSA] European Food Safety Authority. 2019a. Scientific opinion on the safety of annatto E and the exposure to the annatto colouring principles bixin and norbixin (E 160b) when used as a food additive. Efsa J. 17:5626.
- [EFSA] European Food Safety Authority. 2019b. Food colours. [accessed 2019 Nov 19]. https://www.efsa.europa.eu/en/topics/topic/food-colours.
- Doell DL, Folmer DE, Lee HS, Butts KM, Carberry SE. 2016. Exposure estimate for FD&C colour additives for the US population. Food Addit Contam Part A. 33(5):782–797.
- Elliot AJ. 2015 Apr 2. Colour and psychological functioning: a review of theoretical and empirical work. Front Psychol. 6:368.
- Elliot AJ, Maier MA. 2014. Colour psychology: effects of perceiving colour on psychological functioning in humans. Annu Rev Psychol. 65:95–120.
- [EC] European Commission. 1998. Report on methodologies for the monitoring of food additive intake across the European union. Report of a working group on scientific cooperation on questions relating to food. Task 4.2. Luxembourg (Germany): Office of Publications of the European Communities. SCOOP/INT/REPORT/2.
- [FSANZ] Food Standards Australia New Zealand. 2008. Survey of added colours in foods available in Australia. Food Standards Australia New Zealand. [accessed 2019 Dec 15]. http://www.foodstandards.gov.au/science/surveillance/pages/surveyofaddedcolours5519.aspx.
- [FDA] US Food and Drug Administration. 2011. Food advisory committee meeting; Mar 30; Silver Spring (MD). [accessed 2019 Dec 15]. https://www.talkingaboutthescience.com/studies/FDA-FACTranscript-03-30-2011.pdf.
- [FDA] US Food and Drug Administration. 2019. Science board meeting; Oct 7; Silver Spring (MD). [accessed 2019 Dec 15]. https://www.fda.gov/media/131378/download
- Ha MS, Ha SD, Choi SH, Bae DH. 2013. Exposure assessment of synthetic colours approved in Korea. Food Add Contam Part A Chem Anal Control Expo Risk Assess. 30(4):643–653.
- Hansen SC. 1979. Conditions for use of food additives based on a budget for an acceptable daily intake. J Food Prot. 42(5):429–434.
- [IPCS] International Programme on Chemical Safety. 2009a. Environmental health criteria 240: principles and methods for the risk assessment of chemicals in food. Chapter 5: dose-response assessment and derivation of health-based guidance values. Geneva (Switzerland):World Health Organization.
- [IPCS] International Programme on Chemical Safety. 2009b. Environmental health criteria 240: principles and methods for the risk assessment of chemicals in food. Chapter 6: dietary exposure assessment of chemicals in food. Geneva (Switzerland):World Health Organization.
- Harp BP, Miranda-Bermudez E, Barrows JN. 2013. Determination of seven certified colour additives in food products using liquid chromatography. J Agric Food Chem. 61(15):3726–3736.
- [JECFA] Joint FAO/WHO Expert Committee on Food Additives. 2001. Guidelines for the preparation of working papers on intake of food additives for the joint FAO/WHO expert committee on food additives; [accessed 2019 Dec 15]. http://www.who.int/foodsafety/chem/jecfa/en/intake_guidelines.pdf.
- [JECFA] Joint FAO/WHO Expert Committee on Food Additives. 2011 Evaluation of certain food additives and contaminants: seventy-fourth report of the joint FAO/WHO expert committee on food additives. WHO technical report series; no. 966.
- [JECFA] Joint FAO/WHO Expert Committee on Food Additives. 2012. WHO Food additive series 67: safety evaluation of certain food additives; prepared by the 76th meeting of joint FAO/WHO expert committee on food additives. Geneva (Switzerland):World Health Organization.
- [JECFA] Joint FAO/WHO Expert Committee on Food Additives. 2016. Evaluation of certain food additives: eighty-second report of the joint FAO/WHO expert committee on food additives. WHO technical report series; no. 1000.
- [JECFA] Joint FAO/WHO Expert Committee on Food Additives. 2017. Evaluation of certain food additives: eighty-fourth report of the joint FAO/WHO expert committee on food additives WHO technical report series; no. 1007.
- [JECFA] Joint FAO/WHO Expert Committee on Food Additives. 2019. Expert committee on food additives online compendium. World Health Organization; [accessed 2019 Nov 19]. http://www.fao.org/food/food-safety-quality/scientific-advice/jecfa/jecfa-additives/en/.
- Martyn D, Lau A, Darch M, Roberts A. 2017. Benzoates intakes from non-alcoholic beverages in Brazil, Canada, Mexico and the United States. Food Addit Contam Part A. 34(9):1485–1499.
- [NCHS] National Center for Health Statistics. 2016. NHANES data 2013-2014. Hyattsville (MD): U.S. Department of health and human services, Centers for Disease Control and Prevention. https://oehha.ca.gov/risk-assessment/general-info/2019-symposium-synthetic-food-dyes.
- [NCHS] National Center for Health Statistics. 2018. NHANES data 2015–2016. Hyattsville (MD): U.S. Department of health and human services, Centers for Disease Control and Prevention. https://wwwn.cdc.gov/nchs/nhanes/ContinuousNhanes/Default.aspx?BeginYear=2015.
- [OEHHA] Office of Environmental Health Hazard Assessment. 2019 Symposium on synthetic food dyes California office of health hazard assessment; [accessed 2019 Dec 15]. https://oehha.ca.gov/risk-assessment/general-info/2019-symposium-synthetic-food-dyes.
- [PHE] Public Health England. 2019. U.K. National diet and nutrition survey (NDNS) rolling programme (RP). https://www.gov.uk/government/collections/national-diet-and-nutrition-survey.
- Popkin BM, Hawkes C. 2016. The sweetening of the global diet, particularly beverages: patterns, trends and policy responses for diabetes prevention. Lancet Diabetes Endocrinol. 4(2):174–186.
- Stevens LJ, Burgess JR, Stochelski MA, Kuczek T. 2015. Amounts of artificial food colours in commonly consumed beverages and potential behavioral implications for consumption in children: revisited. Clin Pediatr (Phila). 54(12):1228–1230.
- Toledo MCF, Guerchon MS, Ragazzi S. 1992. Potential weekly intake of artificial food colours by 3–14-year-old children in Brazil. Food Addit Contam. 9(4):291–301.
- Yamada T, Ishiwata H 2000. Daily intake study of food additives by age cohort based on the market basket method. Japan Food Chemical Research Foundation. [accessed 2019 Dec 15]. https://www.ffcr.or.jp/en/documents/daily-intake-study/daily-intake-study-of-food-additives.html.