
 ?Mathematical formulae have been encoded as MathML and are displayed in this HTML version using MathJax in order to improve their display. Uncheck the box to turn MathJax off. This feature requires Javascript. Click on a formula to zoom.
ABSTRACT
Some secondary metabolites produced by fungi are carcinogenic, hepatotoxic, and/or cause birth defects in humans and animals. We developed and optimised bio-analytical tools for detection of metabolites, aflatoxins and evaluated the effectiveness of the methods in co-infected maize tissues. Isolate KSM012 (atoxigenic) demonstrated no peaks and no blue fluorescence on HPLC and TLC plates respectively confirming non-toxicity. AFB1 and AFB2 were produced by Isolate KSM015 in addition to AFG1 and AFG2, which is an indication of possible SBG morphotype. The limits of quantification and detection ranged from 0.02 to 35.81 µg/mL and 0.01–6.8 µg/mL, respectively. The best mass spectrum with lowest noise was obtained at 100% ACN and sterile water spiked with 0.1% formic acid at a flow rate of 0.3 mL/min. The positive ion mode with electrospray ionisation application exhibited better fragmentation for mycotoxins. In total 17 metabolites were detected by targeted and formula mass. KDVI maize line exhibited high fungal colonisation in comparison to GAF4 at equal co-infection ratio 50:50. AFB1 and AFG2 were remarkably higher in GAF4 in comparison to sensitive KDV1 (p ˂ 0.05). The detection limits, linearity and sensitivity showed the method developed was suitable for the determination of mycotoxin in comparisons to the guidelines of European Commission 657/EC 2002.
Introduction
The aflatoxin levels in food and feeds are strictly controlled and excessive levels can limit access to foreign markets (Payne and Yu Citation2010; Wu and Khlangwiset Citation2010). It is therefore important to have sensitive, quantitative, rapid and comparatively reliable techniques for detection of aflatoxins at various points along the food chain (Wacoo et al. Citation2014). Culture-based methods or techniques based on PCR are primarily used to differentiate atoxigenic and aflatoxigenic Aspergillus strains (Sulyok et al. Citation2007; Hayat et al. Citation2012; Zhao et al. Citation2014). The methods used to detect and quantify aflatoxins can be chromatographic, spectroscopic or immunochemical, with each having limitations and advantages depending on the applications (Wacoo et al. Citation2014).
Chromatographic methods, such as high-pressure liquid chromatography (HPLC), have been extensively used in the detection of aflatoxin (Wacoo et al. Citation2014). The method is considered as the gold standard for detection of aflatoxins because the fluorescence detector is capable of detection of aflatoxins at low levels in food and feeds (Wacoo et al. Citation2014). Filtenborg et al. (Filtenborg et al. Citation1983) demonstrated the detection of mycotoxins in agar plugs of pure Aspergillus section Flavi cultures using TLC. Aflatoxins analysis by TLC method has been found suitable, since most of the compounds fluoresce strongly under long-wavelength ultraviolet light. The drawback of TLC method is that it lacks precision due to accumulated errors during sample application, plate development, plate interpretation and also requires skilled technical personnel, thus affecting accurate quantification. HPLC may be used coupled with a variety of ultraviolet (UV) detectors, such as a diode array detector (DAD, Agilent) or photo diode array (PDA, Waters), while fluorescence detectors (FLD) can also commonly be employed for detection of aflatoxins and identification in foods and feeds (Songsermsakul PER-F Citation2008; Malachová et al. Citation2014). Recently, high-pressure liquid chromatography coupled with tandem mass spectrometry (HPLC-MS/MS) has been identified as the method of choice due to its selectivity and high sensitivity in the detection of numerous mycotoxins in one run (Zöllner and Mayer-Helm Citation2006; Malachová et al. Citation2014).
The usage of non-toxigenic A. flavus for biocontrol is connected directly with bio-analytical approaches to detect aflatoxin presence as it is necessary to confirm that the bio-control agent reduces aflatoxin contamination. The present study was therefore divided into two parts, where the first was to optimise bio-analytical approaches for detection of aflatoxin metabolites. Secondly, to evaluate whether the selected method can be used successfully in the differentiation of atoxigenic and aflatoxigenic isolates of A. flavus.
Materials and methods
Chemicals and reagents
Yeast extract, potato dextrose agar, sodium chloride, tryptone, ammonium acetate, mycological peptone, agar, malt extract agar, ethanol, acetone, methanol, chloroform, dichloromethane, formic acid (FA, >98%), acetonitrile, and trifluoracetic acid (99.8%) were from Sigma-Aldrich (USA). Reference standards of aflatoxin B + G mixture dry concentrate containing AFG1 and 1.7 µg AFB2, AFG2/mL and 5.8 µg AFB1, were from Sigma Aldrich (Germany). Coconut cream was purchased from Pick n Pay supermarket (Pick n Pay, Cape Town, South Africa). Ultrapure and pure grade water were processed by Milli Q water purification system in the department of molecular and cell biology, UCT, South Africa (Millipore LTD, Bedford, MA, USA).
Preparation of fungal culture
The Aspergillus flavus cultures used were from previous studies (Mitema et al. Citation2018). Briefly, five A. flavus isolates (KSM012, KSM014, HB021, HB026 and HB027) were grown on both aflatoxin non-inducing [Yeast Extract Peptone (YEP)] and inducing [Yeast Extract Sucrose (YES)] medium and incubated at 30°C in the dark for 7 d. Harvesting of conidia from the culture surfaces was performed using swabs of cotton, thereafter suspended in aqueous Tween 20 (0.2%). Using a haemocytometer, the working concentration was adjusted to 1 × 10⁶ conidia per mL. The inoculum was stored at 4°C for further studies within one week or kept in 15% glycerol at −20°C for 1–3 months or longer at −80°C.
Extraction of the metabolites
Different solvents were used for fungal metabolites extraction from A. flavus strains. Fresh mycelia of approximately 200–400 mg was scraped off the respective YES and YEP culture plates and put into vials (screw capped) containing 4 glass beads of approximately 4 mm diameter (Assistant, Germany). Thereafter, 10 mL of extraction solvent consisting of methanol dichloromethane, ethyl acetate [MeOH: DCM: EtOAc (1:2:3, v/v/v)] in 1% formic acid was used to extract aflatoxins and other metabolites ultrasonically for 15 minutes. The extracts were centrifuged at 14000 rpm for 15 minutes at 4°C and, thereafter, 500 µL transferred to sterile 2 mL tubes. Savant SpeedVac Plus SC210A Concentrator was used to dry the samples (Thermo Scientific, USA) for 12 h. Four hundred microlitres of methanol made up of 0.02% (v/v) HCl, 0.6% (v/v) FA and 2.5% (v/v) water was used to reconstitute the residue. Ultrasonic bath sonicator was used to carry out the reconstitution for 10 min at room temperature. Three fifty-microlitre aliquots of the sample were finally transferred to glass vials for TLC, HPLC and LC-MS/MS analysis after centrifugation at 14000 rpm for 15 min at 4°C.
Preparation of aflatoxin standards
Aflatoxin B + G mixture dry concentrate-reference standard (Sigma Aldrich, Germany) was dissolved in 5 mL HPLC grade methanol (Sigma Aldrich, USA) to make a working stock solution and stored accordingly to the manufacturer's recommendations in a freezer at −20°C (Sigma Aldrich, Germany). For bio-analytical analysis, a working stock solution was prepared in a one fold dilution consisting of 200 µg/L AFG1, 50 µg/L AFG2, 200 µg/L AFB1 and 50 µg/L AFB2, and thereafter, stored for three months in amber bottles at −20°C and/or −80°C for longer storage.
Detection and quantification of aflatoxins
Chromatographic analysis using TLC
TLC experiment was performed on a thin layer chromatography silica gel 60 plate 20 × 20 cm (Merck, KGaA, Darmstadt, Germany). The mobile phase for mycotoxins consisted of ACN/MeOH/FA (9:1:0.2 v/v/v). 10 µL of aflatoxins standard mix with certificated concentration of 1.70 µg/mL for (AFG2, AFB2) and 5.86 µg/mL for (AFG1, AFB1), and 20 µL of test samples were spotted on TLC plates and run for approximately 70–90 min in a thin layer chromatography tank at room temperature. Subsequently, the plates were air dried for approximately 30 minutes in the fume hood at room temperature. The plates were visualised either under ultraviolet light wavelength (254 and 366 nm), or sprayed with vanillin solution, or p-anisaldehyde solution, or subjected to iodine vapour. The intensities of the standard aflatoxins against the sample spots were compared and the concentrations of aflatoxins calculated based on the equation:
Where:
E = aflatoxins (µg/kg)
S = µL of aflatoxin standard equal in fluorescence to sample spot.
C = aflatoxin standard concentration in µg/mL.
V = final dilution of the sample extract (µL).
Z = sample matching the standards (µL).
W = sample extract weight (mg).
HPLC and optimisation
Four sets of optimisations were carried out at wavelengths 320 nm and 360 nm. Chromatographic separations and optimisation were accomplished on an Agilent HPLC 1200 system comprised a binary pump equipped with micro vacuum degasser, column compartment, Diode Array Detector and thermostatic auto-sampler (Agilent Technologies, Waldbronn, Germany). Detection of mycotoxins was achieved at wavelengths 200–410 nm range. Separations were accomplished on Agilent Zorbax Eclipse XDB-C18 column, 4.6 × 150 mm I.D., particle size 5 µm (Agilent Technologies, Waldbronn, Germany), maintained at 40°C operating at a flow rate of 1.0 mL per minute. The mobile phases used were ACN and H2O, both containing 0.005% trifluoroacetic acid (TFA). A gradient starting from 85% H2O and 15% ACN went to 100% ACN for 20 min, maintained at 100% ACN for 23 min and final 15% ACN for 27 min (Supplementary data, Table S1). The injected sample volume was 15 µL. Chemical used was of HPLC grade. Ultraviolet wavelength signals were set at 200–410 nm range. Aflatoxins in the sample solution were identified by comparing their peak height/area and retention times with conforming standards in the standard solution.
TOF/Q-TOF mass spectrometer and optimisation
Aflatoxin metabolites detection and quantification were accomplished with a Mass Spectrometer quadrupole time-of-flight (MS Q-TOF) component model G6530A system (Agilent Technologies, Waldbronn, Germany). The liquid chromatography instrument was an Agilent 1200 Series, consisting of an auto sampler HiP model G4226A, two isocratic high-pressure mixing pumps model G4220A, a vacuum degasser unit and a chromatographic oven. Separation of the chromatograms was achieved at 25° C on an Eclipse-Plus Agilent ZORBAX RRHD SB-C18-column, 50 × 2.1 mm i.d., 1.8 µm particle size, equipped with a C18 security guard cartridge, 4 × 3 mm i.d. (Phenomenex, Torrance, CA, USA). Eluent A (ultrapure H2O) and 100% eluent B (ACN) both contained 0.1% FA (Supplementary data, Table S2).
The initial mobile phase comprised 97% A and 3% B was held for 1 minute, before % B was increased linearly to 97% over 13 minutes (Supplementary data, Table S2). The % B was kept at 97 for 2 minutes before decreasing to the starting conditions over 2 minutes (Supplementary data, Table S2). The flow rate of the mobile phase was 0.3 mL per minute, the volume of injection for sample extracts and standards was 10 µL. The chemicals used were of HPLC grade and ultraviolet wavelength signals were set at 200–410 nm range. The identification of the aflatoxins in the sample solution was achieved by comparison of their targeted mass, retention times, and peak height with the conforming standards in the standard solution.
The nebulising (45 psig) and drying gas (300°C, 8 L per minute) used were nitrogen (99.999%) in the Electrospray ionisation (ESI) source. The Q-TOF gadget was operated in the 2 GHz Extended Dynamic Range resolution mode (mass resolution 5000 at m/z values of 120) and compounds were ionised in positive ESI by applying a capillary voltage of 3500 V. Agilent Mass Hunter Qualitative Analysis Workstation software ver. B.05.00 was used to process the obtained data and to control the LC-ESI–QTOF-MS system (Agilent Technologies, Waldbronn, Germany).
A fragmentor voltage of 120 V was used to obtain the precursor [M + H]+ ions for targeted compounds. Optimisation of collision energies was performed with the aim of generating numerous products from each precursor. MS/MS spectra scan for accurate production was attained in the range of m/z values from 60 to 750 units, considering a time window of 1 min centred in the retention time of each analyte. MS spectra (m/z range 100–1000 units) were simultaneously attained with the MS/MS spectra. Acquisition rates in MS/MS and MS modes were set at 1 spectra s,−1 with each spectrum being the combination of 9600 transients. Selective LC–MS/MS and LC–MS chromatograms were extracted with the most intense product ion of each metabolite and a mass window of 50 ppm around the [M + H]+, respectively. The LC–MS chromatograms were used in the post target analysis, and to screen for the presence of possible additional metabolites, whereas MS/MS mode was employed for quantification purposes.
HPLC and LC-MS/MS method validation
The optimised parameters were used to validate the methods; accuracy, specificity, limits of quantification (LOQ) and limits of detection (LOD). These parameters were used to confirm aflatoxin presence or absence in a sample based on European Commission regulations for the performance of bio-analytical approaches (European Commision 657/EC Citation2002; European Commision Citation2011). Analysis of linear regression was carried out for the aflatoxins mixture (AFB1, AFG1, AFB2 and AFG2). Curves of 4-point calibration for aflatoxins were made in the concentration ranges of 0.05–1.17 µg/mL for (AFG1, AFG2, AFB1, AFB2) for HPLC. The peak area ratio of each mycotoxin against its concentration was plotted using linear regression. Precision and accuracy were determined by extraction efficiency experiments carried out in triplicates. LOD and LOQ were predicted for a signal to noise ratio of 10 and 3 respectively from the chromatograms of the samples at the lowest level validated. The detection levels of the target compounds were close to the assumed LOQs and LODs based on the preliminary experiments. Calibration curves for each analyte were used to calculate the LOD and LOQ. Identification of the aflatoxins in the sample solution was achieved by comparing their peak area and retention times for HPLC or MS spectra (MRM mode) with the conforming standard in the standard solution.
Maize cultivars, in vitro co-infection of maize lines and bio-strategy
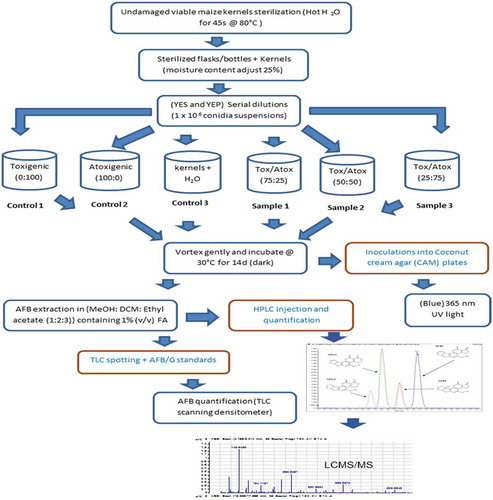
The maize lines used in the present study were as described previously (Mitema et al. Citation2019). The schematic flow diagram () outlines the steps in the bio-control approach from maize kernel sterilisation, through co-infection with aflatoxigenic or atoxigenic isolates and finally aflatoxin detection.
Figure 1. Experimental flow diagram for in-vitro biocontrol study of aflatoxin mitigation (micro-laboratory based) and metabolite determination using bio-analytical techniques. Undamaged maize kernels were surface sterilised and co-infected with a known concentration of atoxigenic isolate KSM012 and/or aflatoxigenic isolates KSM014 of A. flavus at varying proportions prior to metabolite extraction for TLC screening and LCMS/MS analysis. The isolates were cultured on inducing and non-inducing media (YES: yeast extract sucrose agar; YEP: yeast extract peptone agar; Tox: toxigenic and Atox: atoxigenic respectively; TLC: thin layer chromatography; LCMS/MS: liquid chromatography coupled to mass spectrometry)
Unspoilt kernels from GAF4 and KDV1 maize lines were superficially sterilised in hot H2O for 45 s at 80°C as previously described (Mehl and Cotty Citation2010), and an HB43 Halogen Moisture Analyser was used to quantify maize moisture content (Mettler Toledo, Columbus, OH). Adjustment of the moisture content to 25% was achieved by soaking the kernels in ultrapure water for approximately 30–60 minutes as described by (Abbas et al. Citation2006).
The spore suspensions of 1000 µL (1 x 10⁶ conidia per mL) were used to seed approximately 30 sterilised grains in a biosafety cabinet (Contained Air Solutions (CAS) BioMAT2, UK) with respective fungal isolates (non-toxin producing and toxin-producing isolates) at different ratios (0:100, 25:75, 50:50, 75:25, 100:0) in sterilised vials. 1000 µL of ultrapure H2O instead of fungal spore suspensions were used to inoculate the sterilised control grains. Both control and infected vial contents were vortexed for 30 s in a vortex mixer (SciQuip Ltd, UK) to ensure uniform and complete inoculum coating of kernels. The lids of the vials were loosened intermittently for gaseous exchange and thereafter, incubated for 14 days in the dark at 30°C. Fungal activity was halted at the end of the incubation period by oven drying at 45°C for a day or by the addition of 50 mL of 80% MeOH and the contents then prepared for aflatoxin extraction and further analysis. The experiments were performed twice in three biological replicates. The ability of kernels to germinate and efficiency of surface sterilisation were monitored by plating five randomly selected kernels from each vial onto a selective non-inducing medium (YEP) and inducing agar medium (YES) followed by incubation in the dark for 14 days at 30°C.
Statistical analyses
A randomised design with three biological technical replicates was used in all experiments. Percentage reduction and aflatoxin concentration were log transformed prior to analyses using GraphPad Prism, Tukey’s Multiple Comparison Test (TMCT), One-way analysis of variance (ANOVA) and Post-test for linear trend analysis. Aflatoxin levels mean differences (per cent difference between control maize treatments and inoculated maize) were calculated as:
Where:
TACM is total aflatoxin content in maize; aflatox: aflatoxigenic and atox: atoxigenic.
Mean differences in aflatoxin level standard deviations were calculated as a measure of variability in efficacy. The efficiency (E) of each isolate was calculated as:
where R is the percentage of aflatoxin reduction and the denominator is the percentage of the total A. flavus inoculum made up by the atoxigenic isolate (A). ‘A’ is the quantity of atoxigenic strain and ‘T’ is the quantity of aflatoxin-producer. All analyses and calculations were performed in GraphPad Prism software ver. 5.0.2.
Results and discussion
Metabolite extraction and efficiency
Metabolites were extracted from five representative A. flavus isolates (KSM012, KSM014, HBO21, HB026 and HB027) grown on YES/YEP medium. The extraction methods were tested and optimised at different temperatures, sonication times, with or without bead beating and solvent proportions to ascertain the best method for good, consistent metabolite yields ().
Table 1. Percentage extraction yield at varying parameters (solvent proportions, bead beating, time frame and sonication)
Varying proportions of solvents: dichloromethane (DCM), methanol (MeOH), acetonitrile (ACN), ethyl acetate (EtOAc) with or without FA, ultrasonic extraction, bead beating/bashing methods were tested at different temperatures and compared to each other based on the same starting material. A 12% yield of end product was obtained with 70% MeOH while extraction in ACN under the same conditions resulted in only a yield of 0.24% (). Fifteen per cent yield of the extract was obtained under sonication using extraction solvent [MeOH/DCM/EtOAc (1:2:3, v/v/v)] containing 1% FA for one hour at 65°C compared to 23% for 15 min at 30°C (). Extraction without bead beating exhibited no significant yield () and this could be attributed to possibly the tough cell wall of the fungi A. flavus which requires thorough disruption. Raeder and Broda (Citation1985) demonstrated that fungi have sturdy cell walls, resistant to standard extraction procedures, and similar result was also observed in the contemporary study.
Arranz et al. (Citation2006) and Gallo et al. (Citation2010) evaluated the efficiency of extraction of various organic solvents on contaminated matrices. They demonstrated that water-acetone (15:85 or 2:8) exhibited better efficiency for AFB1 extraction than a mixture of water-methanol, but less information was obtained for other mycotoxins. Additionally (Möller and Nyberg Citation2004) reported that water-acetonitrile (4:6, v/v) and – water-chloroform (1:10, v/v) gave better analytical results for aflatoxins extracted from peanut meal with aqueous acetone and acetonitrile exhibiting greater extraction efficiency compared to aqueous methanol. Quantification and detection of aflatoxins in contaminated samples requires efficient extraction steps (Taylor et al. Citation1993; Bertuzzi et al. Citation2012; Wacoo et al. Citation2014). Additionally, aflatoxins were observed to be soluble in polar protic solvents (methanol, acetone, chloroform and acetonitrile) mixed in varying proportions with small amounts of ultra-pure water (Taylor et al. Citation1993; Bertuzzi et al. Citation2012; Wacoo et al. Citation2014).
The extracted metabolites were subjected to further analysis using analytical methods (TLC and HPLC) to ascertain the limit of quantification (LOQ) and limit of detection (LOD).
Thin-layer chromatography
TLC has been extensively employed in the detection of aflatoxins in various foods as low as 1–20 µg/kg (Younis and Malik Citation2003) and also regarded as the method of choice for rapid and simple detection (Helrich Citation1990).
Wacoo et al. (Citation2014), demonstrated that in TLC, the distribution of aflatoxins between the stationary and mobile phases is linked primarily to varying solubility of the analytes in the two phases. Dissimilar analytes, depending on the interaction with the stationary and mobile phases, and their molecular structures, either remain in the mobile phase or associate more to the stationary phase, thereby allowing for effective and quick separation.
Diethylether/methanol/water (96:3:1, v/v/v); water/acetonitrile/methanol (6:2:2, v/v/v); water/acetonitrile/methanol (1:2:2, v/v/v), did not result in clear separations (data not shown). The polar metabolites moved with the solvent front. Solvent combinations displaying promising separations: chloroform/acetone (9:1, v/v); acetonitrile/methanol (9:1, v/v); chloroform/acetone/isopropanol (85:12.5:2.5, v/v/v) and toluene/isoamyl alcohol/methanol (90:32:3, v/v/v). Based on the availability of the chemicals, cost and carcinogenicity effect, the use of acetonitrile/methanol/FA (9:1:0.2, v/v/v) as a mobile phase was adopted. It was also found to give better separation of the mycotoxins in the current study.
However, though TLC can detect several types of mycotoxins in one test sample (Trucksess et al. Citation1984), it requires sample pre-treatment, skilled technical personnel and in addition, plate development and interpretation and it lacks precision due to accrued errors during sample application (Papp et al. Citation2002).
The TLC results were validated with HPLC to quantify the level or limit of detection of aflatoxins present after co-infection.
HPLC method optimisation and validation
Different mobile phases, sample injection volumes, columns and set parameters were experimented and gave varying results. The best separation method for aflatoxins was adopted after four sets of optimisations (; Supplementary data, Table S1).
Figure 2. Standard curves of various aflatoxin standards used in the current research (AFG2, AFG1, AFB2 and AFB1) respectively showing linear regression and equation
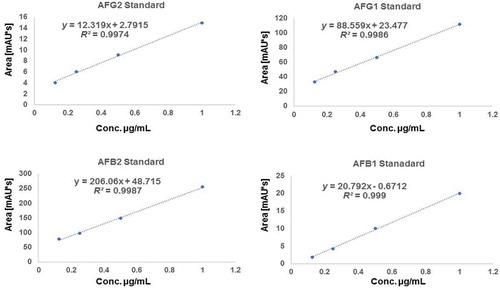
Kok (Citation1986) observed that chemical derivatisation of aflatoxins B1 and G1 is of potential in enhancing HPLC sensitivity during analysis since the natural fluorescence of these aflatoxins may not be high enough to reach the required detection limit. Similarly (Nielsen Citation2003) demonstrated that derivatisation by trifluoroacetic acid in the ACN makes the gradient more appropriate for positive electrospray ionisation, and thus improves the metabolite resolution, staying within the optimal flow range of the Z-spray source. The observations of (Kok Citation1986) and (Nielsen Citation2003) could explain the current findings where in the first two optimisations, no signals were observed, probably due to lack of derivatisation and/or low sample injection volume. With this information, the fourth optimisation consisted of derivatisation using trifluoroacetic acid (0.005%) in both H2O and 100% ACN. The ultraviolet wavelength signals were set at 320 nm and 365 nm, respectively. The temperature of the column was maintained at 40°C and volume of injection was adjusted to 15 µL at a flow rate 1 mL per minute and the gradient was set as indicated previously (Supplementary data, Table S1). Chromatograms were generated and were observed to exhibit satisfactory separation with aflatoxin standard peaks detected between retention times 9–20 min (). The fourth optimisation method was therefore adopted and considered as the best mobile phase in the current study.
Figure 3. HPLC chromatographic separations. Standard chromatogram achieved after the analysis of aflatoxins standard mix with certificated concentration of 1.70 µg/mL for AFG2 and AFB2 and 5.86 µg/mL for AFG1 and AFB1 at wavelength 320 nm
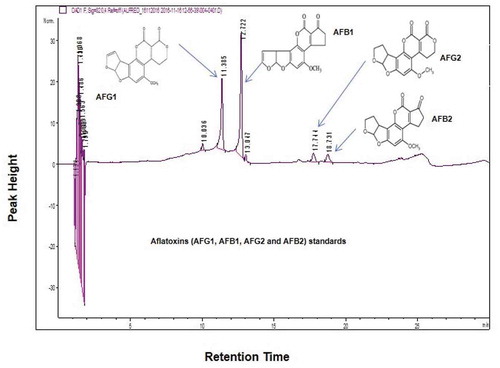
The generated chromatograms of HPLC for the isolates exhibited retention times for aflatoxins [AFB1 (12.72–12.84 min); AFB2 (18.73–18.91 min); AFG1 (11.39–11.68 min) and AFG2 (17.71–17.80 min)] based on the aflatoxin standards at wavelength 320 nm (). The atoxigenic strain (isolate KSM012) showed no HPLC peaks at wavelengths 320 nm and 365 nm, and the TLC plates had no blue fluorescence confirming that the strain is non-toxigenic ().
Figure 4. HPLC chromatographic separations for (a) isolate KSM012 (non-toxigenic strain) confirmed the possibility of its non-toxigenicity and (b) Aflatoxigenic isolate KSM014 (toxigenic strain) achieved at wavelength 365 nm respectively
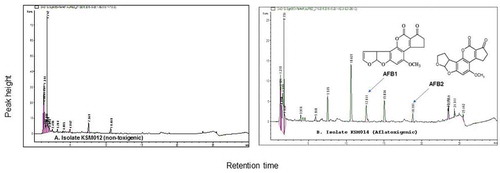
Isolate KSM104 produced compounds with similar retention time as the aflatoxin standards, AFB1 and AFB2, confirmed that this isolate was toxin-producing, an S-morphotype based on our previous studies (Mitema et al. Citation2018). The limits of detection and linearity including sensitivity showed that the method developed was suitable for detection of mycotoxin in the current study from the cultures of A. flavus mycelia. The LOQ and LOD ranged from 0.02 to 35.81 µg/mL and 0.01 to 6.8 µg/mL, respectively.
Herzallah (Citation2009) noted that HPLC provides fast, sensitive and accurate aflatoxins detection results as low as 0.1 ng/kg using fluorescence detector within a short time which were in agreement with the current optimised method. The results were also found to be precise and accurate for both the fluorescence and UV detectors.
The findings from HPLC analysis were correlated to the TLC method and therefore both approaches could detect the absence or presence of aflatoxin in a sample. Though TLC could detect the absence or presence of aflatoxins, it was not able to measure the LOD and LOQ as opposed to HPLC analysis. However, HPLC requires advanced technical skills, trained personnel to operate the instrument and analyse the data and is more expensive in terms of overall cost. Additionally, samples for HPLC analyses require rigorous sample purification and tiresome post- and pre-column derivatisation processes to enhance the detection limits of AFG1 and AFB1 (Li et al. Citation2009, Citation2011). Despite these drawbacks, HPLC provides accurate and sensitive detection of aflatoxins within a short time compared to TLC.
LC–MS/MS and data analysis
Metabolome analysis (metabolite profiling) represents a tool that discovers common application in all aspects of understanding, discovery, and utilisation, and thus, represents a focal point in studies of fungal physiology and taxonomy. The bio-analytical methodologies for metabolite profiling have been comprehensively discussed in reviews and other literature (Pramanik et al. Citation2002; Villas-bo et al. Citation2005).
The pilot experimental study with aflatoxin metabolites consisted of different outputs that measured mass spectrum responses for optimisation such as signal to noise ratio and peak area. The best mycotoxins mass spectra with the lowest noise were achieved in a mobile phase consisting of 100% ACN and ultra-pure H2O spiked with 0.1% FA at a flow rate of 0.3 mL per minute with gradient elution (Supplementary data, Table S2).
The greatest peaks with the lowest noise were obtained under LC conditions. Ten microlitre injection volume provided the lowest noise signal in mass spectrum (). further shows MS/MS spectra and fragmentation pathway in selective reaction mode (SRM) of selected mycotoxins. The most abundant product ions were determined using different collision energies.
Figure 5. MS/MS spectra and fragmentation pathway showing mycotoxin metabolites and their derivatives identified from eight different samples (KSM014, KSM015, KSM018, KSM019, HB023, MC033, MC037, MC038) isolated from four different climatic regions of Kenya based on electrospray ionisation mass-to-charge (m/z) ratio and targeted mass. The mycotoxins identified (AFG1: aflatoxin G1; AFG2: aflatoxin G2; AFB2: aflatoxin B2; AFM1: aflatoxin M1; AFM2: aflatoxin M2 and OTA: ochratoxin A). (MC: Makueni; HB: Homa Bay; KSM: Kisumu respectively)
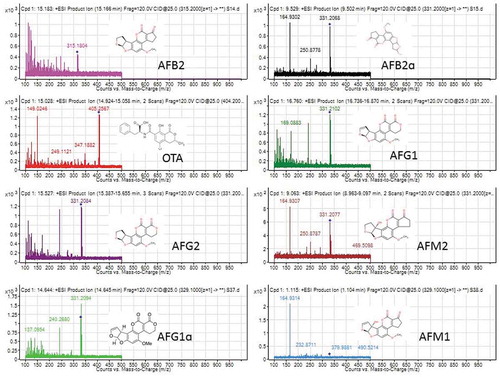
Application of positive ion mode with electrospray ionisation (ESI) indicated that mycotoxins displayed superior fragmentation patterns in positive mode (Supplementary data, Figure S1). Subsequently, the optimised multiple reaction monitoring (MRM) parameters were obtained in both positive and negative ion modes (Supplementary data, Figure S1). The aflatoxin metabolites were identified based on targeted formula mass and mass spectra ().
Table 2. Metabolites identified by formula mass, possible compounds, monoisotopic masses and other chromatographic properties
Table 3. Metabolites identified by targeted mass algorithm
(1) (Nielsen & Smedsgaard, Citation2003). Ranges indicate the highest and lowest mass difference found within the different samples. * Absolute values reported. N/B: NC: Nandi county; KSM: Kisumu county; HB: Homa Bay and MC: Makueni county.
Retention times for each aflatoxin derivative played a significant role in the identification of the metabolites. Major aflatoxin derivatives identified by targeted masses were aflatoxin AFG2α, AFG1, AFG2, AFB2, AFM1 and AFM2. Other metabolites identified were barnol, sorbicillin, dihydrojasmonic acid, citrinin, vertinolide, walleminone, ascochitine, pyroclavine costaclavine or secoclavine and ochratoxin A (). The findings were similar to (Nielsen and Smedsgaard Citation2003) who studied and presented updated methodology which utilised LC–UV–MS for metabolites de-replication in fungal extracts complemented with data from analysis of approximately 474 mycotoxins and fungal metabolites. Some of the metabolites and aflatoxins revealed by this study were also identified by (Malachová et al. Citation2014). Similarly (Malachová et al. Citation2014) optimised and evaluated the multianalyte method performance for other fungal metabolites and mycotoxins. The targeted mycotoxins were detected between retention time 1–18 min in the current study; however, some mycotoxins were observed to co-elute; OTA was eluted at approximately 15.03 min and AFG2 at 15.53 min ().
Compared with plants, A. flavus produces a broad range of secondary metabolites and has a complex metabolism (Nielsen and Smedsgaard Citation2003; Frisvad et al. Citation2004) and extracellular enzymes. The great metabolic diversity has actively been studied for many years and most metabolites produced by A. flavus are bioactive compounds used as cholesterol-lowering agents, antibiotics, immune-suppressors and anti-tumour agents (Newman et al. Citation2003).
The pilot multianalyte mycotoxin study did not reveal more information due to time and experimental constraints. Despite the drawbacks, the pilot study managed to identify nine aflatoxin metabolites by formula mass and eight major mycotoxins by targeted mass algorithm (; 3). From the findings, we suggest and conclude that LC-MS/MS is also an appropriate instrument for mycotoxin and metabolite identification. However, there is a possibility that it might give conflicting information due to formula mass overlap which is a common feature in closely related compounds or elements. This overlap could possibly be resolved by the use of nuclear magnetic resonance spectroscopy (NMR) which identifies and gives the structure of the compound. Thus, a combined LC-MS/MS and NMR approach may be best for clear metabolite distinction.
In-vitro bio-strategies in aflatoxin detection
Two maize lines (GAF4 and KDV1) believed respectively to be resistant and sensitive to A. flavus and aflatoxins were subjected to co-infection by aflatoxigenic strain (KSM014) and atoxigenic strain (KSM012) in the laboratory. The main objective was to test whether non-toxin producing strain (atoxigenic) could be deployed in aflatoxin mitigation or inhibition or reduction of aflatoxin production by aflatoxigenic strains.
Analytical techniques (TLC and HPLC) were used to quantify the limit of quantification and limit of detection of aflatoxin present in both maize lines following co-infection. The findings could possibly provide an insight into possible bio-control system approaches in aflatoxin and A. flavus mitigation at laboratory level.
The co-infected two maize lines (GAF4 and KDV1) exhibited dissimilar rates of fungal colonisation upon co-inoculation with aflatoxigenic (KSM014) and atoxigenic (KSM012) strains of A. flavus. KDVI maize line exhibited high fungal colonisation in comparison to GAF4 at equal co-infection ratio 50:50. In addition, minimal fungal growth was observed when the kernels were inoculated with individual strains of A. flavus for KDV1, and high fungal colonisation for GAF4 at co-infection ratio 100:0; 0:100. Moreover, controls showed no fungal growth, an indication of no contamination with fungal spores of either strain during co-inoculations as indicated in our previous work (Mitema et al. Citation2018). The A. flavus fungal cultures on the kernels were scrapped off and subjected to metabolite extraction and further bio-analytical analysis (HPLC and TLC) to establish the absence or presence of aflatoxins and to evaluate the LOD and LOQ of mycotoxins in a sample at different co-inoculation ratios.
TLC plates and aflatoxins
The thin layer chromatography plates examined showed a significant reduction in the aflatoxin levels from plants inoculated with a 50:50 ratio of aflatoxigenic/atoxigenic A. flavus strains (, lane 5).
Figure 6. Images of thin-layer chromatography plates (a) showing aflatoxin suspects or presence from the isolates in comparison to the standards of aflatoxins (b) the staining effects on TLC plate with p-anisaldehyde. Lanes: (1) Blank; (2) Standard; (3) G100/0; (4) G75/25; (5) G50/50; (6) G25/75; (7) G0/100; (8) K100/0; (9) K75/25; (10) K50/50; (11) K25/75; (12) K0/100. (atoxigenic/toxigenic. (G1: aflatoxin AFG1; G2: aflatoxin AFG2; B1: aflatoxin AFB1; B2: aflatoxin AFB2)
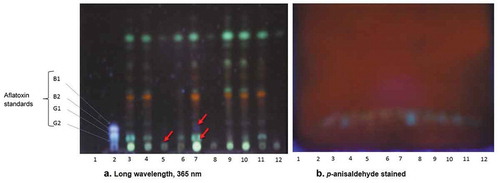
Visible spots with green and blue fluorescence for aflatoxins corresponding to the matching aflatoxin standards were observed at 365 nm (), blue and red arrows).
It should be noted that at short wavelength (254 nm), no observable green or blue fluorescence for mycotoxins was seen (data not shown). This observation shows that the absence or presence of aflatoxins and their derivatives in a sample could be identified after visualisation at long wavelength according to the present study. Staining with vanillin in phosphoric acid, p-anisaldehyde, or iodine vapour yielded no results ()).
HPLC and metabolites analysis after co-infection with atoxigenic/aflatoxigenic
Analysis of the metabolites extracted from the co-infected cultures was also performed using HPLC to identify the aflatoxins and the associated peaks ().
Figure 7. Analysis of high-performance liquid chromatography highlighting biocontrol strategy exhibited when two maize lines (KDV1 and GAF4) were co-infected with non-toxin producing (KSM012) and toxin-producing (KSM014) strains of Aspergillus flavus. At co-infection ratio (a) indicated by red arrow: 50:50; aflatoxin AFG2, AFB1 and at 75:25; AFG2 were detected whereas AFG1, AFB1 and AFB2 were not detected for GAF4 maize line respectively); (b) at 50:50 and 75:25) there was significant decrease in presence of both aflatoxins or no signals detected by HPLC on KDV1 maize line, an indication of probable complete inhibition of the aflatoxigenic isolate by atoxigenic counterpart. KDV1 maize line appeared more susceptible to Aspergillus flavus colonisation compared to GAF4. (AFG1: aflatoxin G1; AFG2: aflatoxin G2; AFB1: aflatoxin B1; AFB2: aflatoxin B2)
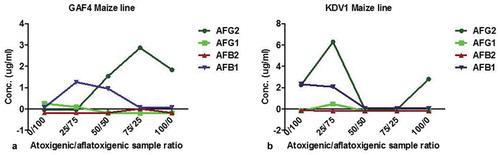
The presence of aflatoxins AFB1 and AFB2 in the maize tissues was significantly decreased in both maize lines at co-infection ratio (50 atoxigenic: 50 aflatoxigenic) (). This observation suggests that aflatoxin production by KSM014 might have been suppressed by KSM012.
Interestingly, the detection of aflatoxins AFG2 and AFB1was considerably greater in GAF4 maize line ()) compared to possibly sensitive KDV1. Additionally, significant reduction of both aflatoxins at co-infection 50:50 and 75:25 (atoxigenic/aflatoxigenic) was noted in KDV1 maize line suspected to be sensitive to A. flavus infection and aflatoxins ()). The observation was believed to be a potential complete inhibition of aflatoxin production by their counterpart, atoxigenic strain.
The observations above probably indicate that possible colonisation of kernels by the non-toxin producing, atoxigenic, strain might have had a potential to limit colonisation of the toxigenic strain and thereby inhibit and reduce toxin levels. Consequently, this was observed as complete inhibition of aflatoxin production. These findings might be appropriate for the development of bio-control systems for aflatoxin mitigation.
Bandyopadhyay et al. (Citation2016) demonstrated that bio-control of aflatoxins is an economical technique for management of aflatoxins with the possibility for a long-term solution to aflatoxin contamination in some parts of sub-Sahara Africa and other third world and developing countries. However, for bio-control effectively to relieve the burden of aflatoxin contamination in Africa, management programmes that optimise both area-wide benefits and bio-control’s long-term potential are required (Bandyopadhyay et al. Citation2016).
Bio-control experiments (Bandyopadhyay et al. Citation2016; Atehnkeng et al. Citation2016) exhibited a contamination reduction in aflatoxin in corns and peanut fields between 74.3% to approximately 99.9% on wheat coated with non-toxin producing A. flavus strains. Their interpretations were related to the contemporary findings where at co-inoculation ratio of atoxigenic to aflatoxigenic isolates (50:50 and 75:25) ()), there was insignificant presence of aflatoxins or no signals observed on HPLC (data not shown). The findings suggest that atoxigenic isolate might competitively exclude aflatoxigenic producers and/or displace the aflatoxigenic counterpart hence the reduction in toxin production ()). For biosafety and bio-control application of non-toxin producing A. flavus isolates in the field as a potential biological control agent, the non-toxin producing A. flavus isolates should preferably be genetically stable, indigenous and must belong to a VCG that does not contain toxin-producing members (Jaime-Garcia and Cotty Citation2006; Mehl and Cotty Citation2010, Citation2011).
Atehnkeng et al. (Citation2016) identified non-toxin producing isolates (Og0222, La3279, Ka16127 and Og0437) as possible candidate for bio-control strategies in Nigerian corn fields. From the study, it can be suggested that atoxigenic isolate (KSM012) might be a possible potential candidate for aflatoxin and A. flavus mitigation and a recommendation for possible field trial is required.
Studies by (Medina et al. Citation2015; De et al. Citation2015) and (Mehl et al. Citation2012) conducted under laboratory conditions revealed that abiotic stress-related factors such as humidity, temperature, water activity and solutes can influence growth and production of aflatoxins in Aspergillus spp. Understanding of the impact of these environmental conditions on the abiotic stress of A. flavus under field conditions could be prospective in understanding the efficacy of bio-control of toxin-producing isolates (Stevenson et al. Citation2015).
The mechanism for bio-control may be the displacement of aflatoxigenic isolates from host plants through initiation effects or a discrepancy in sporulation on substrates (Mehl et al. Citation2012). Horn and Greene (Citation1995) observed that non-toxin producing isolates competes with toxin-producing isolates during co-infection and could interfere with contamination by aflatoxins. Competitive exclusion by non-toxin producing isolates causes reduction in aflatoxin during co-infection (Hruska et al., Citation2014), a process supported by primary host contact (Mehl et al. Citation2012). Huang et al. (Citation2011) showed that the potential mechanisms for the latter include downregulation in the biosynthesis of aflatoxin and differences nutrient resource use between the isolates (Mehl and Cotty Citation2013).
Conclusions
Bioanalytical methods developed for metabolite extraction, fungal detection and quantification were validated and found to be appropriate for the diagnosis of aflatoxin presence or absence in A. flavus isolates and in co-infection studies on maize. The TLC approach was found to be a simple and robust but non-quantitative method for aflatoxin detection. HPLC and LC-MS/MS were able to precisely determine and quantify aflatoxins with the latter capable of determining a broad variety of other metabolites in the A. flavus isolates.
The KDV1 maize line was found to be more sensitive to fungal infections than GAF4. This sensitivity is one possible reason why aflatoxicosis outbreaks are more frequent in some regions in Kenya. The use of atoxigenic A. flavus strain during co-infection showed possible maximum inhibition of aflatoxin production by their aflatoxigenic counterparts. Moreover, the method developed as a bio-control for mycotoxin mitigation using locally adopted atoxigenic strains of A. flavus exhibited a reduction in toxin profiles on the tested samples at co-infection ratios 50:50 for both atoxigenic and aflatoxigenic strains.
Supplemental Material
Download MS Word (217.4 KB)Supplementary material
Supplemental data for this article can be accessed on the publisher’s website.
Additional information
Funding
References
- Abbas HK, Zablotowicz RM, Bruns HA, Abel C. 2006. Biocontrol of aflatoxin in corn by inoculation with non-aflatoxigenic Aspergillus flavus isolates. Biocontrol Sci Technol. 16(5):437–449. doi:10.1080/09583150500532477.
- Arranz I, Egmond ES, Van H, Kroeger K, Pedro B, Legarda TM, Burdaspal P, Reif K, Stroka J. 2006. Determination of aflatoxin B1 in medical herbs: interlaboratory study. J AOAC Int. 89(3):595–605. doi:10.1093/jaoac/89.3.595.
- Atehnkeng J, Donner M, Ojiambo PS, Ikotun B, Augusto J, Cotty PJ, Bandyopadhyay R. 2016. Environmental distribution and genetic diversity of vegetative compatibility groups determine biocontrol strategies to mitigate aflatoxin contamination of maize by a spergillus flavus. Microb Biotechnol. 9(1):75–88. doi:10.1111/1751-7915.12324.
- Bandyopadhyay R, Ortega-Beltran A, Akande A, Mutegi C, Atehnkeng J, Kaptoge L, Senghor AL, Adhikari BN, Cotty PJ. 2016. Biological control of aflatoxins in Africa: current status and potential challenges in the face of climate change. World Mycotoxin J. 9(5):771–789. doi:10.3920/WMJ2016.2130.
- Bertuzzi T, Rastelli S, Mulazzi A, Pietri A. 2012. Evaluation and improvement of extraction methods for the analysis of aflatoxins B1, B2, G1 and G2 from naturally contaminated maize. Food Anal Methods. 5(3):512–519. doi:10.1007/s12161-011-9274-5.
- De LF, Andrew A, Esther S, Jenny B, Hejazi F, Hayes S, Morrison IEG, Prior BA, McGenity TJ, Rangel DEN, et al. 2015. Concomitant osmotic and chaotropicity ‑ induced stresses in Aspergillus wentii : compatible solutes determine the biotic window. Curr Genet. 61(3):457–477. doi:10.1007/s00294-015-0496-8.
- [EC] European Commision 2002 Commission Decision No 657/EC. August 17. Commission decision of 12 August 2002 implementing council directive 96/23/EC concerning the performance of analytical methods and the interpretation of results (notified under document number C (2002) 3044)(Text with EEA relevance) (2002/657/EC). Off J Eur Communities. 29.
- [EC] European Commission. 2011. Method validation & quality control procedures for pesticide residue analysis in food and feed. Doc No SANCO/12495/2011. 2011;41.
- Filtenborg O, Frisvad JC, Svendsen JA. 1983. Simple screening method for moulds producing intracellular mycotoxins in pure cultures. Appl Environ Microbiol. 45(2):581–585. doi:10.1128/AEM.45.2.581-585.1983.
- Frisvad JC, Smedsgaard J, Larsen TO, Samson RA. 2004. Mycotoxins, drugs and other extrolites produced by species in Penicillium subgenus Penicillium. Stud Mycol. 49:201–241.
- Gallo A, Masoero F, Bertuzzi T, Piva G, Pietri A. 2010. Effect of the inclusion of adsorbents on aflatoxin B 1quantification in animal feedstuffs. Food Addit Contam - Part A. 27(1):54–63. doi:10.1080/02652030903207219.
- Hayat A, Paniel N, Rhouati A, Marty JL, Barthelmebs L. 2012. Recent advances in ochratoxin A-producing fungi detection based on PCR methods and ochratoxin A analysis in food matrices. Food Control. 26:401–415. doi:http://dx.doi.10.1016/j.foodcont.2012.01.060
- Helrich K. 1990. AOAC: official methods of analysis (Volume 1). 15th ed. Arlington (VA): Contam Agric Chem; p. 1298.
- Herzallah SM. 2009. Determination of aflatoxins in eggs, milk, meat and meat products using HPLC fluorescent and UV detectors. Food Chem. 114(3):1141–1146. doi:10.1016/j.foodchem.2008.10.077.
- Horn BW, Greene RL. 1995. Vegetative compatibility within populations of Aspergillus flavus, A. parasiticus, and A. tamarii from a peanut field. Mycologia. 87(3):324–332. doi:10.1080/00275514.1995.12026537.
- Hruska Z, Rajasekaran K, Yao H, Kincaid R, Darlington D, Brown RL, Bhatnagar D, Cleveland TE. 2014. Co-inoculation of aflatoxigenic and non-aflatoxigenic strains of Aspergillus flavus to study fungal invasion, colonization, and competition in maize kernels. Front Microbiol. 5:122. doi:10.3389/fmicb.2014.00122.
- Huang C, Jha A, Sweany R, DeRobertis C, Damann KE. 2011. Intraspecific aflatoxin inhibition in Aspergillus flavus is thigmoregulated, independent of vegetative compatibility group and is strain dependent. PLoS One. 6(8):e23470. doi:10.1371/journal.pone.0023470
- Jaime-Garcia R, Cotty PJ. 2006. Spatial distribution of Aspergillus flavus and its toxigenic strains on commercial cottonseed from south Texas and its relationship to aflatoxin contamination. Plant Pathol. 55(3):358–366. doi:10.1111/j.1365-3059.2006.01358.x.
- Kok A. 1986. Effects of degradation of visual stimuli on components of the event-related potential (ERP) in go/no go reaction tasks. Biol Psychol. 23(1):21–38. doi:10.1016/0301-0511(86)90087-6.
- Li P, Zhang Q, Zhang D, Guan D, Liu X, Fang S, Wang X, Zhang W 2011. Aflatoxin measurement and analysis. Chapter in ‘aflatoxins - detection, measurement and control’, Irineo Torres-Pacheco, intechOpen. https://www.intechopen.com/books/aflatoxins-detection-measurement-and-control/aflatoxin-measurement-and-analysis
- Li P, Zhang Q, Zhang W. 2009. Immunoassays for aflatoxins. Trends Anal Chem. 28(9):1115–1126. doi:10.1016/j.trac.2009.07.003.
- Malachová A, Sulyok M, Beltrán E, Berthiller F, Krska R. 2014. Optimization and validation of a quantitative liquid chromatography–tandem mass spectrometric method covering 295 bacterial and fungal metabolites including all regulated mycotoxins in four model food matrices. J Chromatogr A. 1362:145–156. doi:10.1016/j.chroma.2014.08.037.
- Medina A, Rodríguez A, Sultan Y, Magan N. 2015. Climate change factors and Aspergillus flavus: effects on gene expression, growth and aflatoxin production. World Mycotoxin J. 8(2):171–179. doi:10.3920/WMJ2014.1726.
- Mehl HL, Cotty PJ. 2010. Variation in competitive ability among isolates of Aspergillus flavus from different vegetative compatibility groups during maize infection. Phytopathology®. 100(2):150–159. doi:10.1094/PHYTO-100-2-0150.
- Mehl HL, Cotty PJ. 2011. Influence of the host contact sequence on the outcome of competition among Aspergillus flavus isolates during host tissue invasion. Appl Environ Microbiol. 77(5):1691–1697. doi:10.1128/AEM.02240-10.
- Mehl HL, Cotty PJ. 2013. Influence of plant host species on intraspecific competition during infection by Aspergillus flavus. Plant Pathol. 62(6):1310–1318. doi:10.1111/ppa.12038.
- Mehl HL, Jaime R, Callicott KA, Probst C, Garber NP, Ortega-Beltran A, Grubisha LC, Cotty PJ. 2012. Aspergillus flavus diversity on crops and in the environment can be exploited to reduce aflatoxin exposure and improve health. Ann NY Acad Sci. 1273(1):7–17. doi:10.1111/j.1749-6632.2012.06800.x.
- Mitema A, Okoth S, Rafudeen MS. 2018. Vegetative compatibility and phenotypic characterization as a means of determining genetic diversity of Aspergillus flavus isolates. Fungal Biol. 122(4):203–213. doi:10.1016/j.funbio.2017.11.005.
- Mitema A, Okoth S, Rafudeen MS. 2019. The development of a qPCR assay to measure aspergillus flavus biomass in maize and the use of a biocontrol strategy to limit aflatoxin production. Toxins. 11(3):179. doi:10.3390/toxins11030179.
- Möller TE, Nyberg M. 2004. Efficiency of different extraction solvent mixtures used in analyses of aflatoxins from a certified peanut meal reference material. Food Addit Contam. 21(8):781–785. doi:10.1080/02652030412331282394.
- Newman D, Cragg G, Snader K. 2003. Natural products as sources of new drugs over the period 1981-2002. J Nat Prod. 66(7):1022–1037. doi:10.1021/np030096l.
- Nielsen K. 2003. Fungal metabolite screening: database of 474 mycotoxins and fungal metabolites for dereplication by standardised liquid chromatography–UV–mass spectrometry methodology. J Chromatogr A. 1002(1–2):111–136.
- Nielsen KF, Smedsgaard J. 2003. Fungal metabolite screening: database of 474 mycotoxins and fungal metabolites for dereplication by standardised liquid chromatography-UV-mass spectrometry methodology. J Chromatogr A. 1002(1–2):111–136. doi:10.1016/S0021-9673(03)00490-4.
- Papp E, Klara H-Otta GZ, Mincsovics E. 2002. Liquid chromatographic determination of aflatoxins. Microchem J. 73(1–2):39–46. doi:10.1016/S0026-265X(02)00048-6.
- Payne GA, Yu J. 2010. Ecology, development and gene regulation in Aspergillus flavus. Mol Biol Genomics. 8:157–171.
- Pramanik BN, Mirza UA, Ing YH, Liu Y-H, Bartner PL, Weber PC, Bose AK. 2002. Microwave-enhanced enzyme reaction for protein mapping by mass spectrometry : A new approach to protein digestion in minutes. Protein Sci. 11(11):2676–2687. doi:10.1110/ps.0213702.
- Raeder U, Broda P. 1985. Rapid preparation of DNA from filamentous fungi. Lett Appl Microbiol. 1(1):17–20. doi:10.1111/j.1472-765X.1985.tb01479.x.
- Songsermsakul PER-F. 2008. A review of recent trends in applications of liquid chromatography-mass spectrometry for determination of mycotoxins liquid chromatography-mass spectrometry for. J Liq Chromatogr Relat Technol. 6076(11–12):1641–1686. doi:10.1080/10826070802126395.
- Stevenson A, Cray JA, Williams JP, Santos R, Sahay R, Neuenkirchen N, McClure CD, Grant IR, Houghton J, Quinn JP, et al. 2015. Is there a common water-activity limit for the three domains of life? Isme J. 9(6):1333–1351. doi:10.1038/ismej.2014.219.
- Sulyok M, Krska R, Schuhmacher R. 2007. A liquid chromatography/tandem mass spectrometric multi-mycotoxin method for the quantification of 87 analytes and its application to semi-quantitative screening of moldy food samples. Anal Bioanal Chem. 389(5):1505–1523. doi:10.1007/s00216-007-1542-2.
- Taylor SL, King JW, Richard JL, Greer JI. 1993. Analytical-scale supercritical fluid extraction of aflatoxin B1 from field-inoculated corn. J Agric Food Chem. 41(6):911. doi:10.1021/jf00030a014.
- Trucksess MW, Nesheim S, Eppley RM. 1984. Thin layer chromatographic determination of deoxynivalenol in wheat and corn. J Assoc Off Anal Chem. 67(4):4244.
- Villas-bo SG, Smedsgaard J, Nielsen J. 2005. Mass spectrometry in metabolome analysis. Mass Spectrom Rev. 24(5):613–646. doi:10.1002/mas.20032.
- Wacoo AP, Wendiro D, Vuzi PC, Hawumba JF. 2014. Methods for detection of aflatoxins in agricultural food crops. J Appl Chem. 2014:1–15. doi:10.1155/2014/706291
- Wu F, Khlangwiset P. 2010. Health economic impacts and cost-effectiveness of aflatoxin-reduction strategies in Africa: case studies in biocontrol and post-harvest interventions. Food Addit Contam Part A. 27(4):496–509. doi:10.1080/19440040903437865.
- Younis YMH, Malik KM. 2003. TLC and HPLC assays of aflatoxin contamination in sudanese peanuts and peanut products. Kuwait J Sci Eng. 30:79–94.
- Zhao X, Lin C-W, Wang J, Oh DH. 2014. Advances in rapid detection methods for foodborne pathogens. J Microbiol Biotechnol. 24:297–312. doi:http://www.jmb.or.kr/journal/view.html?doi=10.4014/jmb.1310.10013
- Zöllner P, Mayer-Helm B. 2006. Trace mycotoxin analysis in complex biological and food matrices by liquid chromatography-atmospheric pressure ionisation mass spectrometry. J Chromatogr A. 1136(2):123–169. doi:10.1016/j.chroma.2006.09.055.