
ABSTRACT
A tiered intake assessment approach is presented and applied to derive the maximum potential global low- and no-calorie sweeteners (LNCS) intake estimates. The US and Uk markets served as representative for the world and the EU region, respectively, to determine the maximum potential exposure for acesulfame potassium (AceK), aspartame, saccharin, steviol glycosides, and sucralose in various subpopulations, including brand-loyal consumers. Conservative intake estimates for LNCS used in non-alcoholic beverages were calculated for the general population 2 + y, toddlers (12–35 months (US) or 18–35 months (UK)), young children 3–9 y, adolescents 10–17 y, adults 18–64 y, elderly 65–74 y, and very elderly 75 + y based on assumed uses in high beverage consumption markets, leveraging either the 2-day food consumption data from the 2013–2016 US National Health and Nutrition Examination Survey or the 4-day food consumption data from the 2008–2017 UK National Diet and Nutrition Survey Rolling Programme. Strong concordance between the refined budget method and the brand-loyal deterministic approach was shown, the latter assumes the maximum industry-reported global LNCS use level is present in 100% of non-alcoholic beverages. This study shows that safety of LNCS in beverages at proposed use levels can be supported for any geography, with all intake estimates falling below the acceptable daily intake in refined assessments. Importantly, this study shows the refined budget method to be a valid first-tier screening assessment in prioritising those LNCS that may benefit from more refined intake assessments when warranted.
Introduction
Low- and no-calorie sweeteners (LNCS) are food additives that are broadly used as sugar substitutes to sweeten foods and beverages to reduce calories. They are some of the most thoroughly tested and evaluated food additives including by the World Health Organisation (WHO), the US Food and Drug Administration (FDA) and the European Food Safety Authority (EFSA) (Roberts Citation2016; Glendinning Citation2018; Serra-Majem et al. Citation2018). The range of LNCS use levels varies depending on consumers’ sweetness preferences, based on a number of factors including diverse social, cultural and geographical backgrounds (Venditti et al. Citation2020). In light of the WHO’s recommendation to reduce free sugar intake to no more than 10% and the potential substitution of sugar with LNCS as one possible tool to manage caloric intake (WHO Citation2015; USDA Citation2016; DGAC Citation2020), concerns around increasing trends in LNCS intake and potential exceedances of their respective Acceptable Daily Intakes (ADIs) have been raised (Serra-Majem et al. Citation2018).
Previously, Martyn et al. (Citation2018) reviewed the published global intake data on the major LNCS (i.e., acesulfame potassium (AceK), aspartame, saccharin, sucralose, cyclamate, thaumatin and steviol glycosides). Irrespective of the type of study conducted since 2008, no concern was noted with respect to exceedance of individual sweetener ADIs among the general population globally. Although the reviewed data did not show a significant shift in exposure over time, several studies indicate a reduction in intake and some data suggest there may have been an increase in the numbers of consumers of LNCS-sweetened products (Martyn et al. Citation2018).
In the current study, different intake assessment methods ranging from the screening conservative traditional Budget Method to the more refined, resource- and time-intensive estimated daily intake assessments (at the person level) are applied in a tiered approach to evaluate the global maximum potential intake of five LNCS (AceK, aspartame, saccharin, steviol glycosides, and sucralose). Readily accessible food consumption data from countries with high consumption of water-based flavoured non-alcoholic beverages (e.g. the United States for the world and the United Kingdom for the European Union region) along with industry-reported global maximum reported LNCS use levels were integral to determining the maximum potential global intakes among various sub-populations, including toddlers and young children. The US was selected as it is one of the countries with highest water-based flavoured non-alcoholic beverage consumption (see Figures 6 and 7 in Popkin and Hawkes Citation2016). The UK was selected to represent Europe, because UK is shown to be the highest consumer of beverages as well (EFSA opinion on colours that point to UK as highest consumer of soft drinks, see EFSA Citation2009a, Citation2009b, Citation2009c, Citation2009d, Citation2010a, Citation2010b, Citation2010c; Popkin and Hawkes Citation2016). The purpose of this assessment is to demonstrate if, and when, the more resource- and time-intensive refined assessments may be warranted. The methods draw from the tiered intake assessment concept as laid out within the International Programme on Chemical Safety’s Principles and methods for the risk assessment of chemicals in food (IPCS Citation2009b, see ).
Figure 1. Stepwise approach to obtain realistic dietary exposure assessment (IPCS, Citation2009b)
The tiered assessments were stepwise, with the initial screening based on default and conservative assumptions. Subsequent assessments incorporated model and input refinements, driving towards more realistic intake scenarios while maintaining conservatism. For example, even for the most refined model in the brand-specific market share deterministic approach, it was assumed that the entire volume of a beverage brand contained a particular LNCS even when the particular LNCS was used only in a specific flavoured version of that brand. This conservative assumption overestimates intake for that given LNCS in the most refined brand-loyal market-share deterministic scenario (see Materials and Methods, ). The output from the various intake modelling scenarios are compared with each other to determine whether the refined budget method can serve as a valid first-tier screening assessment to prioritise only those LNCS that may require further in-depth intake assessments.
Table 1. LNCS beverage use levels
Table 2. Proportion of respective LNCS-sweetened beverage types (based on U.S. market volume) containing specified LNCS
In addition, an analysis comparing individuals with or without diabetes among US and UK adults was conducted to determine if the total daily intake of LNCS-containing foods and beverages differed among these two subpopulations.
Materials and methods
Food consumption data
United States (US)
Estimated beverage consumption amounts were based on food consumption records collected in the What We Eat in America (WWEIA) component of the National Health and Nutrition Examination Survey (NHANES) conducted in 2013–2014 and 2015–2016 (NHANES 2013–2016). NHANES is a continuous survey that uses a complex multistage probability sample designed to be representative of the civilian US population (NCHS Citation2016, Citation2018). The NHANES datasets provide nationally representative nutrition and health data and prevalence estimates for nutrition and health status measures in the United States. As part of the examination, trained dietary interviewers collected detailed information on all foods and beverages consumed by respondents in the previous 24-h time period (midnight to midnight). A total of 14,532 individuals in the survey period 2013–2016 provided 2 complete days of dietary recalls.
United Kingdom (UK)
Estimated beverage consumption amounts were based on food consumption records collected in the UK National Diet and Nutrition Survey Rolling Programme (NDNS RP). The NDNS RP is a continuous cross-sectional survey, designed to assess the diet, nutrient intake and nutritional status of the general population aged 1.5 years and older living in private households in the UK. A representative sample of around 1000 people (500 adults and 500 children) takes part in the NDNS RP each year. The NDNS RP comprises an interview, a 4-day estimated diet diary, physical measurements, and a blood and urine sample. The survey is carried out in all four countries of the UK and is designed to be representative of the UK population. A detailed description of the survey methodology for the NDNS survey, including sample selection, is published online (PHE Citation2020). This study uses combined results from Years 1 to 9 of the NDNS RP (2008/2009 – 2016/2017) for a sample of the UK population designed to be nationally representative.
Beverage types and LNCS levels
Reported average and maximum use levels in water-based flavoured non-alcoholic beverages for the five LNCS (AceK, aspartame, saccharin, steviol glycosides, sucralose) are provided in .
The use levels were obtained from two surveys conducted in April–July 2019 and July–December 2019 facilitated through the International Council of Beverages Associations (ICBA) membership. The April–July 2019 survey obtained information on AceK and saccharin use levels globally, while the July to December 2019 data collection effort gathered beverage use levels for all five LNCS in the U.S.A., Canada, Mexico and Brazil. Both multi-national beverage companies (including, among others, Keurig Dr Pepper, Pepsi Co, The Coca-Cola Company) and national and regional beverage associations such as the American Beverage Association (ABA), Australian Beverage Council (ABC), Associacao Brasileira das Industrias de Refrigerantes e de Bebidas nao Alcoolicas (ABIR), Cámara Costarricense de la Industria Alimentaria (CACIA), Canadian Beverage Association (CBA), Soft Drinks Europe (UNESDA) and the Japanese Soft Drink Association (JSDA), among others, participated in the surveys.
For the April to July 2019 survey, reported average and maximum use levels in water-based flavoured non-alcoholic beverages for AceK and saccharin were supplied by the global beverage industry through the ICBA membership. AceK and saccharin use level information received captures most non-alcoholic beverages sold globally. The ‘average’ and ‘maximum reported global use level’ in beverages across product portfolios (for each participating multi-national company) and across companies’ portfolios (for each participating national and regional beverage association) were requested. Upon data blinding and aggregating, the ‘average’ use levels for AceK and saccharin were calculated by averaging across all averages reported while the ‘maximum reported global use level’ was typically based on the highest across all use levels reported.
For the July to December 2019 survey, upon blinding and aggregating the data, the global average beverage use level for each of the five LNCS (AceK, aspartame, saccharin, steviol glycosides, sucralose) was calculated by averaging all use levels reported for those branded products accounting for approximately 80% of the market volume share within each beverage type across the broader water-based flavoured non-alcoholic beverage category. The ‘maximum reported use level’ and the average in the global intake assessments were based on the highest maximum and average reported use levels across both surveys, predominantly noted for the survey across four higher beverage-consuming markets. We assumed that the distribution of levels across 80% of the beverage market volume would be similar across the remaining 20% and focused our efforts on the top-contributing brands (i.e., ~80%) to account for the most marketed beverages that comprise thousands of drink varieties.
Food codes corresponding to the water-based flavoured non-alcoholic beverages were identified within WWEIA, NHANES 2013–2016 for the US diet and the NDNS RP (2008/2009 – 2016/2017) for the UK diet. For completeness, food selection was based on the overarching water-based flavoured non-alcoholic beverage category (14.1.4) within the Codex General Standard for Food Additives (GSFA) and accompanying sub-categories – 14.1.4.1 (carbonated), 14.1.4.2 (non-carbonated). 14.1.4.3 (powders, syrups, concentrates) – and coffee, coffee substitutes, tea, herbal infusions, and other hot cereal and grain beverages, excluding cocoa (14.1.5). The lists of the NHANES food codes and the NDNS RP food codes included in this study are provided in Supplemental Materials Appendices I and II, respectively.
Market share data
Market share information for various beverages is regularly gathered by the Beverage Marketing Corporation (BMC Citation2019). Similar to the stratification in Martyn et al. (Citation2017) and Tran et al. (Citation2020), water-based flavoured non-alcoholic beverages were stratified according to conventional beverage types defined by industry but limited to the LNCS versions, namely: LNCS carbonated soft drinks (LNCS CSDs), LNCS flavoured water, LNCS juice drinks, LNCS energy drinks, LNCS sports drinks, LNCS ready-to-drink (RTD) tea, LNCS RTD coffee, and LNCS hot teas and coffees. Ingredient labels for US brands making up more than generally 80% of the market volume for a given beverage type (data not shown) were reviewed for ingredient declarations of any of the five LNCS.
The proportions of these beverage types with specific LNCS uses reported (for each of the five LNCS being evaluated in this study) are summarised in . It was assumed that the proportions for LNCS RTD coffee, LNCS hot teas and LNCS hot coffees (for which there was very limited uses reported) were the same as LNCS RTD teas to maintain conservatism.
The market volume data from the US market were also assumed to be representative of the UK market, and were likewise applied to the UK market-share-adjusted deterministic (MSD) approach described more fully below.
Tier 1 – Budget method
Overview
In 1979, the budget method was developed to derive screening estimates of the maximum food additive levels that can be used in the food and/or beverage supply without exceeding the food additive Acceptable Daily Intake (ADI) (Hansen Citation1979; JECFA Citation2001). The budget method has also been used to assess the theoretical maximum daily dietary exposure (TMDE) to some food additives (IPCS Citation2009b). Detailed description of the budget method and the default consumption estimates have been described elsewhere (Tran et al. Citation2020). For this study, as described in Tran et al. (Citation2020) the reverse assessment of the originally described 1979 budget method (Hansen 1979; JECFA Citation2001) was conducted to calculate the theoretical maximum beverage concentration (TMBC) for the LNCS of interest. In other words, instead of using the budget method to determine what the estimated exposure might be (i.e., TMDE) by applying assumed use levels of a particular food additive for both foods and beverages, the budget method was implemented in reverse to estimate the TMBC based on the fraction of the ADI reserved for beverages (based on either suggested assumptions by JECFA or actual data provided by EFSA). This approach provides a simplistic way of comparing proposed uses in beverages to what the TMBC might be for either the default budget method or the refined budget method. The reverse application of the budget method allows for quickly screening out those provisions that would no longer raise a potential safety concern if the proposed use levels fall below the estimated TMBC. Potential food contributions were accounted for in the TMBC derivation by assigning only a portion of the ADI to beverages. Description of data and method used to determine the ADI-apportioned fraction for beverages is detailed further below.
JECFA ADI-apportioned fraction for beverages
The Joint (FAO/WHO) Expert Committee on Food Additives (JECFA) ADI was utilised in view of the global nature of reported uses for this assessment (JECFA Citation2019). JECFA (Citation2001) recommends allocating 50% of the ADI to foods and 50% to beverages when the food additive is used in both foods and beverages but the proportion in each category is unknown. LNCS use prevalence estimates based on nationally representative data from NHANES (Gardner et al. Citation2012; Sylvetsky et al. Citation2017; Malek et al. Citation2018) indicate that the percent of the US population consuming LNCS-sweetened beverages is at least two to three times higher than the percent consuming LNCS-sweetened foods. Hence, since these studies did not report on the amounts of LNCS consumed, a 50% allocation of the ADI to beverages for children 2–5 y and US 2 + y is conservative and is similar to the % estimated for other additives elsewhere (see , and Tran et al. Citation2020).
Table 3. Beverage apportioned JECFA ADI
The UK assessments leverage EFSA’s opinions on aspartame and steviol glycosides to determine the average percent contribution of non-milk beverages to the total estimated intakes of these LNCS for various subpopulations (EFSA Citation2013, Citation2015). Non-alcoholic beverages (flavoured drinks with sweeteners and fruit nectars) contributed a total of 49% of the total aspartame intake for toddlers and averaged 40% across all subpopulations (range from 24% to 55%) (EFSA Citation2013). For steviol glycosides, non-alcoholic drinks (fruit nectars, flavoured drinks and coffee and tea) contributed a total of 59% of total steviol glycosides intake among toddlers and averaged 49% across all subpopulations (range from 28% to 59%) (EFSA Citation2015). The portion of the ADI assigned to non-milk beverages for AceK, saccharin and sucralose was conservatively assumed to be 40%, or the minimum of the estimates for aspartame and steviol glycosides, see .
Budget method tiered assessments – tiers 1a and 1b
The budget method assessment (Broad Tier 1) for beverages was conducted stepwise in two sub-tiers, with sub-tier a (“default”) using the default budget method assumptions, including:
daily beverage consumption rate 0.1 L kg-bw−1
25% of non-milk beverages containing the additive for adolescents, adults, and elderly, and 100% assumed for toddlers and young children.
In sub-tier b (“refined”), US and UK beverage high consumption rates were used in place of the default daily beverage consumption rate. (Description of the refined beverage consumption rates is summarised in Tran et al. (Citation2020)). Also, in the refined budget method assessment, the assumption of 25% of non-milk beverages containing the LNCS were applied to all subpopulations (see ).
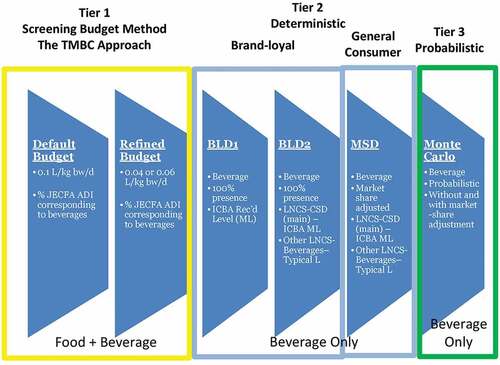
Figure 2. Tiered intake assessments framework
In both the “default” and “refined” budget methods, the maximum reported LNCS use levels were utilised to compare to the TMBC.
Beverage consumption in “refined” budget method
Data from the US NHANES 2015–16 and from UK consumption estimates compiled by EFSA were used to derive consumption estimates for use in the refined assessment. Beverage consumption estimates of 0.06 L kg-bw−1 day−1 and 0.04 L kg-bw−1 day−1 were derived for the US and UK populations instead of the default 0.1 L kg-bw−1 day−1 to derive the TMBC of any given LNCS additive for both toddlers and the general population. Details of the approach and data used are available in Tran et al. (Citation2020).
Tier 2 – Estimating intake with national food consumption surveys
Estimates of global maximum potential LNCS intake were derived by combining relevant beverage consumption amounts (as reported in the US NHANES 2013–2016 and UK NDNS RP 1–9, high beverage consuming markets as described above) with corresponding global LNCS use levels reported. Deterministic assessments were conducted in a stepwise manner with refining assumptions to derive conservative estimates of LNCS dietary exposures.
Three different deterministic assessments were conducted for each LNCS, including two brand loyal (BLD) and one market share adjusted (MSD) scenarios (see ). Assumptions made for each assessment scenario are summarised below in . The most conservative assessment scenario is the brand loyal scenario 1 (BLD-1), in which 100% of all water-based flavoured non-alcoholic beverages is assumed to contain the LNCS of interest at the reported maximum LNCS use levels (in the world). Each successive scenario is more refined such that in the most refined Scenario 3 (MSD) both the maximum use level applied to the brand-loyal beverage type and the average use level applied to the remaining beverage types are weighted accordingly by the corresponding conservative fraction of the volume market share assigned to each beverage type assumed to contain the specific LNCS (from ).
Table 4. Tier 2 Deterministic Assessment Scenarios
The mean, 90th and 95th percentile estimates were derived for the following age groups for both markets: toddlers 12–35 months (US) or toddlers 18–35 months (UK), young children 3–9 y, adolescents 10–17 y, adults 18–64 y, elderly 65–74 y, and very elderly.
Consumption of LNCS containing foods/beverages by diabetes status
Mean daily intake (g/day) of LNCS-containing foods, beverages, and food/beverage additions by diabetic status (based on self-reports) were derived and compared using the Wald F-test. The test was adjusted for survey design and used the statistical weights provided by NCHS (for the US) and FSA (for the UK).
Results
Tier 1 – Budget method
The “default” and the “refined” budget method calculated TMBC – for each LNCS assessed in this study for water-based flavoured non-alcoholic beverages (in mg kg−1) for the US and UK populations – is provided in , respectively. The reported maximum global use levels in beverages are also included for reference.
Table 5. Theoretical maximum beverage concentration (TMBC) for LNCS in beverages based on the ‘default’ or ‘refined’ budget methods – US
Table 6. Theoretical maximum beverage concentration (TMBC) for LNCS in beverages based on the ‘default’ or ‘refined’ budget methods – UK
For the US, the reported maximum global use levels in beverages exceeded the TMBC for all LNCS for all US consumers except for aspartame for the US 2 + y in the ‘default’ budget method. In the “refined” budget method, the reported maximum global use levels in beverages exceeded the TMBC for saccharin only for all US consumers (see ).
In the “default” budget method, the reported maximum global use levels in beverages exceeded the TMBC for all LNCS for all UK consumers except for aspartame for the UK 1.5 + y. However, in the “refined” budget method, the reported maximum global use levels in beverages exceeded the TMBC for saccharin only for all UK consumers (see ).
Tier 2 – Estimated daily intake using national food consumption surveys
US NHANES
The per consumer daily intake of the five LNCS based on the brand-loyal deterministic and market-share deterministic assessment scenarios were generated for six US sub-populations: toddlers 12–35 months, young children 3–9 y, adolescents 10–17 y, adults 18–64 y, elderly 65–74 y, very elderly 75 + y. Mean, 90th and 95th percentile estimated daily intakes (expressed in mg kg-bw−1 day−1 using each individual reported body weight) were derived (see and Supplementary Materials Appendix III).
Figure 3. Per consumer estimated daily intake of acesulfame potassium (AceK), aspartame, saccharin, steviol glycosides (as steviol equivalents), and sucralose, mg kg-bw−1 day−1, 2-day average; US NHANES 2013–2016
For all brand-loyal deterministic assessment scenarios based on the US NHANES, the per consumer mean, 90th and 95th percentile estimated daily intakes (EDI) for all subpopulations for aspartame were below its JECFA ADI (see ). Since the EDIs were well below the JECFA ADI even when based on the most conservative brand-loyal deterministic scenario 1 (BLD-1), where the maximum use level was applied to all beverages, aspartame can be set aside (i.e. no safety concern) and no further refined assessments would under ordinary circumstances be necessary or warranted.
Based on the brand-loyal deterministic assessment scenarios, the mean, 90th and 95th percentile EDIs for AceK, steviol glycosides, and sucralose were below their respective JECFA ADIs for all assessment scenarios and all subpopulations except toddlers for the BLD-1 scenario, where the EDIs exceeded the JECFA ADI for AceK, steviol glycosides and sucralose only at the 95th percentile. However, it is worthwhile noting that the BLD-1 exceedances among toddlers at the 95th percentile EDI ranged only from 9% to ~37% of the corresponding JECFA ADIs.
For saccharin, the mean, 90th and 95th percentile EDIs were below the JECFA ADI for all assessment scenarios and all subpopulations, except for toddlers for the BLD-1 (90th and 95th percentiles) and the BLD-2 (95th percentile), and for the elderly 65–74 y for the BLD-1 (95th percentile) (see ). All per consumer EDIs for saccharin were below the JECFA ADI for all sub-populations in the MSD tier.
UK NDNS
The per consumer daily intake of the five LNCS based on the UK NDNS were similarly developed for six UK subpopulations: toddlers 18–35 months, young children 3–9 y, adolescents 10–17 y, adults 18–64 y, elderly 65–74 y, very elderly 75 + y. Consistent with findings for aspartame from the US NHANES, the per consumer mean, 90th and 95th percentiles EDI for all subpopulations for aspartame were below its JECFA ADI. Similarly, for AceK, steviol glycosides, and sucralose, the mean, 90th and 95th percentiles EDIs were below their respective JECFA ADIs for all assessment scenarios and almost all subpopulations except among toddlers and young children 3–9 y in the BLD-1 scenario at the 90th (in some cases) and the 95th percentile (in all cases). For steviol glycosides and sucralose among young children, 3–9 y in the BLD-1 scenario, the 90th percentile EDIs were below their corresponding JECFA ADIs. It is worth noting that the BLD-1 exceedances at the 95th EDI for these sweeteners among children 3–9 y ranged from only 7% to ~30% of the corresponding JECFA ADIs (see and Supplementary Materials Appendix IV).
Figure 4. Per consumer estimated daily intake of acesulfame potassium (AceK), aspartame, saccharin, steviol glycosides (as steviol equivalents), and sucralose, mg kg-bw−1 day−1, 4-day average; UK NDNS RP 1–9
For saccharin, exceedances of the JECFA ADI occur at the 90th and 95th EDIs for toddlers and children 3–9 y and at the 95th EDI for elderly 65–74 y in the BLD-1 assessment. In scenario 2 (BLD-2), exceedances of the JECFA ADI occur at the 90th and 95th EDIs for toddlers and at the 95th EDI for children 3–9 y (see ). Similar to the US NHANES findings, all per consumer EDIs for saccharin were below the JECFA ADI for all sub-populations in the MSD tier.
Consumption of LNCS-Containing Foods/Beverages by Diabetes Status
summarise the consumption of LNCS-containing foods, beverages, and food/beverage additions by diabetes status among LNCS consumers in the US and UK, respectively. There were statistically significant differences in the mean consumption of LNCS-containing food beverage additions (FBA) (such as tabletop sweeteners, creamers, etc.) between individuals with diabetes and without diabetes among US and UK LNCS consumers. However, neither the mean consumption of LNCS-containing foods, LNCS-containing beverages, or the combined intake of LNCS-containing foods, beverages and FBA were significantly different between individuals with or without diabetes among either the US LNCS-consumers or the UK LNCS consumers. Due to the small sample sizes for specific sub-populations, only data for all adults, 19 + y, are summarised.
Table 7. US Daily intake of LNCS foods, beverages, food/beverage additions (FBA) by diabetes status, g day-1, day 1; NHANES 2013–2016
Table 8. UK Daily intake of LNCS foods, beverages, food/beverage additions (FBA) by diabetes status; g day-1, 4-day average; NDNS RP 1–9
Discussion
This study presents a tiered assessment approach to derive conservative global intake estimates for LNCS. The “refined” budget method, as an alternative to the traditional budget method, presents a streamlined yet conservative method for an effective screening tier that appropriately prioritises beverage additives that may require further refined intake assessments, saving significant time and resources. There is confidence in the output of the “refined” budget method (which factors in both foods and beverages) in view of good concordance with the conservative brand-loyal deterministic assessments (BLD-1) in almost all cases and strong concordance with the slightly refined yet still conservative BLD-2 assessments in all cases.
Tier 1 – Budget method
For all sub-populations, the reported maximum global aspartame use level in beverages was below all budget method (i.e., default and “refined”) calculated TMBCs, except for US and UK toddlers and young children in the default method. For AceK, steviol glycosides and sucralose, the ‘refined’ budget method provides a pass for each of these for both toddlers and the general population. In contrast, only saccharin would have been prioritised by the ‘refined’ budget method for a more resource-intensive refined intake assessment.
The refined budget method for beverages has good concordance with most BLD-1 estimates (for further discussion see Supplemental Materials Appendix V), further substantiate the utility of the refined budget method approach as an appropriate and valid first-tier screening tool.
Douglass et al. (Citation1997) and Bär and Würtzen (Citation1990) (as referenced in Douglass et al. Citation1997) questioned the suitability of the default budget method for all additives under all conditions, particularly for beverages. Douglass et al. (Citation1997) argued that the theoretical maximum daily intake estimates of the additives would be extremely exaggerated especially from a beverage contribution standpoint. They noted that the default budget method could be associated with extensive false-positive errors for additives typically used in non-alcoholic beverages which would consequently undermine effective and efficient screening and prioritisation in these instances. Douglass et al. (Citation1997) recognised the limitations associated with the underlying default budget method assumptions for the beverage category, including the default 0.1 L/kg bw/day beverage volume consumption amount and the assigned fraction of 25% of the non-milk beverage category containing the additive. Similarly, Bär and Würtzen (Citation1990) (as referenced in Douglass et al. Citation1997) conclude, “[A] daily liquid consumption of 100 mL/kg body weight is not a reasonable starting point for budget calculations. Instead, it appears that a daily liquid intake of 50 mL/kg will cover the needs under extreme conditions, and of heavy consumers.” The minor enhancements to the budget method approach for beverages (as noted previously, 0.06 L/kg for US and 0.04 L/kg for UK) – i.e., the ‘refined’ budget method approach – align well with the recommended 0.05 L/kg non-milk beverage consumption amount and have been shown to increase the utility of the ‘refined’ budget method approach, here and elsewhere (Tran et al. Citation2020).
Tier 2 – Estimated daily intakes, deterministic
Relative to the next tier brand-loyal deterministic refined intake assessments, the current study selected the US and UK food consumption data based generally on: (i) anticipated higher beverage consumption rates compared to other markets and regions (EFSA Citation2009a, Citation2009b, Citation2009c, Citation2009d, Citation2010a, Citation2010b, Citation2010c; Popkin and Hawkes Citation2016), and (ii) availability of respective current and robust national survey data. Utilising these higher beverage consumption markets as representative markets for the world or the European Union, respectively, enables identification of the maximum potential LNCS intake estimates and consequently sets the maximum for global estimates such that if safety is achieved for these ‘high intake’ representative markets based on the maximum global LNCS use levels, then no safety concerns should exist for any market across all geographies. Further, national survey data – preferred to regional (or global) summary statistics because of the level of granularity afforded by national survey data – enable more precise, reliable and realistic intake assessments (IPCS Citation2009b).
As noted previously, the focus on “beverage only” consumers in the tiered and refined brand-loyal deterministic assessments (including for BLD-1, BLD-2, MSD) further elevates the global maximum intake estimates because of a narrower consumer base when compared to ‘food and beverage’ consumers which would otherwise generally dilute the overall EDI (Tran et al. Citation2020). Thus, there is a high confidence in the conservative nature of the refined brand-loyal ‘beverage only’ consumer deterministic approach presented herewith.
These findings also suggest that the UK BLD-1 estimates for toddlers may be extremely conservative. This conservatism is likewise observed when comparing the aspartame UK BLD-1 ‘beverage only’ 95th percentile EDI estimates to EFSA’s food and beverage brand-loyal 95th percentiles EDI estimates (see Supplemental Materials Appendix VI). Although estimates between BLD-1 and EFSA brand-loyal assessments overlap, the UK BLD-1 95th percentile EDI estimate for toddlers is nearing the maximum of the corresponding EFSA brand-loyal estimate range. All other BLD-1 EDI estimates across sub-populations (except toddlers) and representative markets seem to have good concordance with the refined budget method output.
Refining exposure estimates by assigning reported maximum global use levels to the brand-loyal beverage type that contributes most to LNCS intake (i.e., LNCS-CSD) and average use levels to the other beverage types (BLD-2), or by incorporating market volume share data in the MSD deterministic scenario – in which it was conservatively assumed that the entire volume for a particular brand was attributed to a given LNCS even if it was reported in only one flavoured version of that brand – the EDI’s for AceK, aspartame, saccharin, steviol glycosides and sucralose fell at or well below their respective JECFA ADIs in almost all cases, including for the 95th percentile estimates (considered extremely high consumers) among toddlers. In view of the conservative nature of these refined models, including the conservative assumption that global maximum use levels are used across 100% of the brand-loyal LNCS-CSD beverage type among the 95th percentile consumers, these findings should re-affirm the safe use of LNCS in water-based flavoured non-alcoholic beverages.
General discussion
Together, these findings demonstrate that the “refined” budget method offers a meaningful opportunity to prioritise LNCS needing further in-depth resource- and time-intensive dietary intake assessment. Safety conclusions from the “refined” budget method closely approximate those from the conservative brand-loyal deterministic assessments. Since the budget method is intended to serve as a first-tier screening assessment, more robust and refined intake assessments would be warranted for LNCS with reported (or proposed) maximum use levels significantly exceeding the “refined” budget method-calculated TMBC. The next tiers of refined intake assessments – using the estimated daily intake deterministic approach as described in the 2009 International Programme on Chemical Safety (IPCS) guidance on dietary exposures to substances – would include the use of the preferred and more precise national survey consumption data over summary statistics (IPCS Citation2009b).
Relative to the risk assessment paradigm, some concepts that should not be overlooked include the conservative nature of the ADI (IPCS Citation2009a)
The ADI is derived from a No Observed Adverse Effect Level (NOAEL);
The NOAEL may be based on chronic exposure over one’s lifetime and could assume exposure at that level every day for 25,550 days (for a 70-year average lifespan);
The ADI applies a 100-fold default safety factor to the NOAEL, accounting for interspecies differences (i.e., extrapolating from relevant animal models to humans) and intraspecies variability (i.e., extrapolating from adults to toddlers and across sensitive subpopulations).
Slight ADI exceedances when estimating daily intake should not immediately signal a safety concern.
Moreover, additional layers of conservatism are also introduced into the risk assessment paradigm when determining the EDI (IPCS Citation2009b). The degree of conservatism in the EDI depends ultimately on the approach utilised. For example, to attain a more realistic EDI, ‘usual’ intakes across days should be calculated rather than acute single day intakes, especially when comparing to a ‘chronic’ ADI. Additional conservative assumptions may include 100% presence of the additive across the entire food category of interest; the food additive is present at the maximum reported level across the non-milk water-based flavoured non-alcoholic beverage category or even in specified beverage types, etc.
Thus, the combined effect of the conservative nature of the ADI and the conservative approach to the EDI yields an extremely conservative risk assessment (even if multiple refinements are implemented). These conservative assumptions (built into the risk assessment paradigm) afford flexibility in choosing the appropriate use levels for ingredients/additives in wide-ranging food or beverage applications.
Additionally, no statistically significant differences in the total consumption of LNCS-containing foods, beverages, and food and beverage additions were observed between individuals (19 + y) with or without diabetes, which suggests the assessments herein for the combined LNCS-consuming subpopulation would be representative of the intake for all subpopulations including individuals with diabetes.
Some limitations exist in the present assessment. The same general limitations found in cross-sectional studies such as the accuracy of the consumption estimates based on dietary recalls from survey participants apply to this study. An additional limitation (perhaps viewed as a strength by some) is the limited number of recall days – 2 or 4 days – which would yield more conservative beverage consumption amounts. Finally, only the MSD scenario leveraged the market volume share information which was solely based on the US market. The relevant highest average and/or maximum use levels as reported in were used in the relevant tiers of the current tiered intake assessments. As verification of reported use levels against all globally marketed beverages is not feasible, it is possible that a few products for which higher LNCS use levels may exist in certain jurisdictions. Multiple strengths of the study include application of the maximum-reported global LNCS use levels as noted in the Materials and methods to all deterministic scenarios – i.e., BLD-1 (all beverages) and BLD-2 (brand-loyal LNCS-CSD) and MSD (market volume-weighted LNCS-CSD) assessments – and utilisation of national consumption surveys from high beverage-consuming markets (i.e., US, UK).
Overall, this study shows that the “refined” budget method is a useful first-tier screening assessment. The refined budget method provides a more reasonable alternative to the traditional default budget method to better prioritise only those LNCS that may benefit from further detailed in-depth intake assessments, consequently maximising limited resources. Based on screening-level assessments with the “refined” budget method, and further refined dietary exposure assessments using national food consumption surveys from high beverage-consuming markets serving as representative markets for the world or the European Union region, this study continues to support the safe use (or proposed use) of AceK, aspartame, saccharin, steviol glycosides and sucralose in beverages generally at the maximum-reported global use levels.
Supplemental Material
Download MS Word (60.6 KB)Supplemental Material
Download MS Word (15.6 KB)Supplemental Material
Download MS Word (41.5 KB)Supplemental Material
Download MS Word (44.5 KB)Disclosure statement
NLT, LMB and APH do not report any conflicts of interest. MMJ is employed by the American Beverage Association.
Supplementary material
Supplemental data for this article can be accessed on the publisher’s website.
Correction Statement
Please add the major correction line: This article was originally published with errors, which have now been corrected in the online version. Please see Correction (http://dx.doi.org/10.1080/19440049.2022.2160593)
Additional information
Funding
References
- Bär A, Würtzen G. 1990. Assessing the use of additives in food: a reappraisal of the Danish budget method. Lebensmittel-Wissenshaft und-Technologie. 23:193–202. (as cited in Douglass et al 1997).
- [BMC] Beverage Marketing Corporation. 2019. Who we are. New York (NY): Beverage Marketing Corporation. accessed 2019 Dec 14. https://www.beveragemarketing.com/who-we-are.asp.
- [DGAC] Dietary Guidelines Advisory Committee. 2020. Scientific report of the 2020 dietary guidelines advisory committee: advisory report to the secretary of agriculture and the secretary of health and human services. Washington (DC): US Department of Agriculture, Agricultural Research Service.
- Douglass JS, Barraj LM, Tennant DR, Long WR, Chaisson CF. 1997. Evaluation of the budget method for screening food additive intakes. Food Addit Contam. 14(8):791–802. doi:10.1080/02652039709374590.
- [EFSA] European Food Safety Authority. 2009a. Scientific opinion on the re-evaluation tartrazine (E 102) on request from the European commission. Efsa J. 7:1331.
- [EFSA] European Food Safety Authority. 2009b. Scientific opinion on the re-evaluation of azorubine/carmoisine (E 122) as a food additive on request the European commission. Efsa J. 7:1332.
- [EFSA] European Food Safety Authority. 2009c. Scientific opinion on the re-evaluation of sunset yellow FCF (E 110) as a food additive on request from the European commission. Efsa J. 7:1330.
- [EFSA] European Food Safety Authority. 2009d. Scientific opinion on the re-evaluation of quinoline yellow (E 104) as a food additive on request from the European commission. Efsa J. 7:2579.
- [EFSA] European Food Safety Authority. 2010a. Scientific opinion on the reevaluation of brilliant black BN (E 151) as a food additive on request from the European commission. Efsa J. 8:1540.
- [EFSA] European Food Safety Authority. 2010b. Scientific opinion on the reevaluation of brilliant blue FCF (E 133) as a food additive. Efsa J. 8:1853.
- [EFSA] European Food Safety Authority. 2010c. Scientific opinion on the re-evaluation of curcumin (E 100) as a food additive on request from the European commission. Efsa J. 8:1679.
- [EFSA] European Food Safety Authority. 2013. Scientific Opinion on the re-evaluation of aspartame (E 951) as a food additive. Efsa J. 11(12):3496.
- [EFSA] European Food Safety Authority. 2015. Scientific opinion on the safety of the extension of use of steviol glycosides (E 960) as a food additive. Efsa J. 13(6):4146.
- [FDA] Food and Drug Administration. GRAS Notice (GRN) No. 768. accessed 2019 Jul 31. https://www.accessdata.fda.gov/scripts/fdcc/index.cfm?set=GRASNotices&id=768.
- Gardner C, Wylie-Rosett J, Gidding SS, Steffen LM, Johnson RK, Reader D, Lichtenstein AH. 2012. Nonnutritive sweeteners: current use and health perspectives. Diabetes Care. 35:1798–1808.
- Glendinning JI. 2018. Oral and post-oral actions of low-calorie sweeteners: a tale of contradictions and controversies. Obesity. 26(Suppl 3):S9–S17.
- Hansen SC. 1979. Conditions for use of food additives based on a budget for an acceptable daily intake. J Food Prot. 42 (5):429–434.
- [IPCS] International Programme on Chemical Safety. 2009a. Environmental health criteria 240: principles and methods for the risk assessment of chemicals in food. Chapter 5: dose-response assessment and derivation of health-based guidance values. Geneva (Switzerland): World Health Organization.
- [IPCS] International Programme on Chemical Safety. 2009b. Environmental health criteria 240: principles and methods for the risk assessment of chemicals in food. Chapter 6: dietary exposure assessment of chemicals in food. Geneva (Switzerland): World Health Organization.
- [JECFA] Joint FAO/WHO Expert Committee on Food Additives. 2001. Guidelines for the preparation of working papers on intake of food additives for the Joint FAO/WHO Expert Committee on Food Additives. accessed 2019 Dec 15. http://www.who.int/foodsafety/chem/jecfa/en/intake_guidelines.pdf.
- [JECFA] Joint FAO/WHO Expert Committee on Food Additives. 2019. Evaluations of the joint FAO/WHO Expert Committee on Food Additives (JECFA). [accessed 2019 Nov]. (https://apps.who.int/food-additives-contaminants-jecfa-database/search.aspx?fc=66.
- Malek AM, Hunt KJ, DellaValle DM, Greenberg D, St. Peter JV, Marriott BP. 2018. Reported consumption of low-calorie sweetener in foods, beverages, and food and beverage additions by US adults: NHANES 2007–2012. Curr Dev Nutr. 2(9):nyz054.
- Martyn D, Darch M, Roberts A, Youl Lee H, Yaqiong Tian T, Kaburagi N, Belmar P. 2018. Low-/no-calorie sweeteners: a review of global intakes. Nutrients. 10:357. doi:10.3390/nu10030357
- Martyn D, Lau A, Darch M, Roberts A. 2017. Benzoates intakes from non-alcoholic beverages in Brazil, Canada, Mexico and the United States. Food Addit Contam Part A Chem Anal Control Expo Risk Assess. 34(9):1485–1499.
- [NCHS] National Center for Health Statistics. 2016. NHANES data 2013‐2014. Hyattsville (MD): US Department of Health and Human Services, Centers for Disease Control and Prevention. https://wwwn.cdc.gov/nchs/nhanes/continuousnhanes/default.aspx?BeginYear=2013
- [NCHS] National Center for Health Statistics. 2018. NHANES Data 2015-2016. Hyattsville (MD): US Department of Health and Human Services, Centers for Disease Control and Prevention. https://wwwn.cdc.gov/nchs/nhanes/ContinuousNhanes/Default.aspx?BeginYear=2015.
- [PHE] Public Health England. (2020). UK National Diet and Nutrition Survey (NDNS) Rolling Programme (RP). https://www.gov.uk/government/collections/national-diet-and-nutrition-survey.
- Popkin BM, Hawkes C. 2016. The sweetening of the global diet, particularly beverages: patterns, trends and policy responses for diabetes prevention. Lancet Diabetes Endocrinol. 4(2):174–186.
- Roberts A. 2016. The safety and regulatory process for low calorie sweeteners in the United States. Physiol Behav. 164(Pt B):439–444.
- Serra-Majem RA, Aranceta-Bartrina J, Varela-Moreiras G, Logue C, Laviada H, Socolovsky S, Pérez-Rodrigo C, Aldrete-Velasco JA, Meneses Sierra E, López-García R, et al. 2018. Ibero⁻American consensus on low- and no-calorie sweeteners: safety, nutritional aspects and benefits in food and beverages. Nutrients. 10(818). doi:10.3390/nu1007081.
- Sylvetsky AC, Jin Y, Clark EJ, Welsh JA, Rother KI, Talegawkar SA. 2017. Consumption of low-calorie sweeteners among children and adults in the United States. J Acad Nutr Diet. 117(3):441–448.
- Tran NL, Barraj LM, Hearty AP, Jack MM. 2020. Tiered intake assessment for food colours [published online ahead of print, 2020 Mar 30]. Food Addit Contam Part A. 37:1118–1134. doi:10.1080/19440049.2020.1736341
- [USDA] United State Department of Agriculture. Center for Nutrition Policy and Promotion. 2016. Make better beverage choices. Dietary Guidance (DG) TipSheet No. 19 May 2012. Oct.
- Venditti C, Musa-Veloso K, Lee HY, Poon T, Mak A, Darch M, Juana J, Fronda D, Noori D, Pateman E, et al. 2020. Determinants of sweetness preference: a scoping review of human studies. Nutrients. 12(3):718.
- [WHO] World Health Organization. 2015. Guideline: sugars intake for adults and children. Geneva (Switzerland): WHO.