
ABSTRACT
European Snacks Association (ESA) data on acrylamide in potato crisps from 2002 to 2019 (99704 observations) were analysed. Acrylamide levels have plateaued since 2011, although the lowest mean so far was attained in 2018 at 353 ± 2.7 ng g−1: a 54% reduction since 2002. The 85th, 90th and 95th quantiles did show evidence of continued downward progress, the 90th quantile being lower than the 750 ng g−1 European Benchmark Level from 2017 to 2019. A smaller dataset from the European Food Safety Authority (2124 observations) for 2011–2018 was also analysed. The yearly means were higher than those of the ESA data but showed a fall in average acrylamide from 715 ± 40.5 ng g−1 in 2015 to 505 ± 28.5 ng g−1 in 2018, as well as steep falls in the 85th, 90th and 95th quantiles. Nevertheless, even the 85th quantile remained above the 750 ng g−1 Benchmark Level. The ESA data showed a reduction in the proportion of samples with acrylamide exceeding 750 ng g−1, from over 40% in 2002 to 7.75% in 2019. Seasonality was evident, with highest acrylamide levels from November to May. Crisp type had little effect except that thicker types had a higher proportion of samples containing >750 ng g−1 acrylamide. Analysis of the region of origin in Europe of the final product revealed improvements in the east and north. Geographical factors combined with seasonality continued to be problematic but was also an aspect in which progress was most evident. The findings show that improvements have been made in reducing the number of samples with very high levels of acrylamide, but do not suggest that mean acrylamide levels could be reduced substantially below where they have been since 2011, or that levels could be kept consistently below the current Benchmark Level.
Graphical Abstract
Introduction
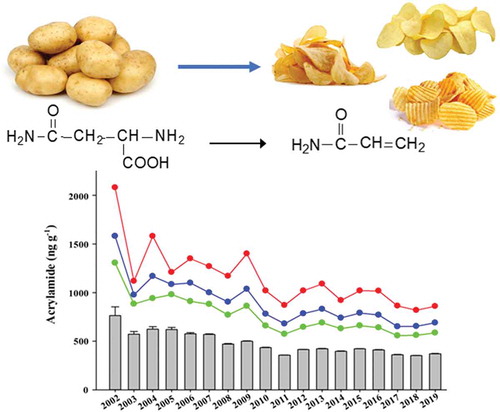
Acrylamide (CH2=CHC(O)NH2) is a chemical contaminant present in many common cooked foods, in particular those derived from the grains, beans, tubers and storage roots of plants (reviewed by Raffan and Halford Citation2019). It is classified as a processing contaminant, defined as a substance that is produced in food during cooking or processing, is not present or is present at much lower concentrations in the raw, unprocessed food, and is undesirable either because it has adverse effects on product quality or because it is potentially harmful (Curtis et al. Citation2014). Acrylamide does not form at detectable levels during boiling and is associated predominantly with fried, baked, roasted or toasted foods.
Acrylamide’s discovery in common foods in 2002 (Tareke et al. Citation2002) caused widespread concern in the food industry, its suppliers and regulatory authorities because studies using laboratory animals have shown it to be neurotoxic and carcinogenic, detrimental to male fertility and causal of birth defects (reviewed by Friedman Citation2003; European Food Safety Authority (EFSA) Panel on Contaminants in the Food Chain (CONTAM Panel) Citation2015). It is classified as a hazardous substance in the USA, a serious health hazard with acute toxicity in the European Union, and a Group 2A carcinogen (probably carcinogenic to humans) by the International Agency for Research on Cancer (IARC Citation1994).
The CONTAM Panel (Citation2015) concluded that the level of exposure to acrylamide from the diet was insufficient to cause neurological, reproductive or developmental effects, but that the margins of exposure indicated ‘a concern for neoplastic effects’ (CONTAM Panel Citation2015). This conclusion was very similar to that reached by the United Nations’ Food and Agriculture Organisation (FAO) and World Health Organisation (WHO) Joint Expert Committee on Food Additives (JECFA) in 2006 (JECFA Citation2006). The CONTAM Panel (Citation2015) based their opinion on the risk posed by dietary acrylamide exposure on toxicological evidence, mostly acquired from studies on rodents, because they considered the epidemiological evidence to be too inconsistent to support firm conclusions. It is fair to say that there is still disagreement on the toxicology of acrylamide and its metabolic derivative, the epoxide glycidamide. Zhivagui et al. (Citation2019), for example, identified a unique mutational ‘signature’ linked to acrylamide and glycidamide in 184 liver tumours and 217 tumours of 15 other cancer types after analysing 1600 human tumour genomes. Eisenbrand (Citation2020), on the other hand, reviewed the evidence for a genotoxic mode of action for acrylamide/glycidamide and found that ‘compelling evidence is lacking’. He concluded that any genotoxicity of acrylamide occurred at doses that were irrelevant to dietary exposure, and that while there was evidence for tumour formation in rodents as a result of non-genotoxic action of acrylamide it was ‘not likely predictive for humans’. Despite this uncertainty, the data reported by the CONTAM Panel (Citation2015) and the conclusions drawn prompted the European Commission to draft new regulations on the presence of acrylamide in food, and Commission Regulation (EU) 2017/2158 (European Commission Citation2017) came into force on 11 April 2018.
Whereas the CONTAM Panel report (CONTAM Panel Citation2015) expressed concern for the potential neoplastic effects of dietary acrylamide, Commission Regulation (EU) 2017/2158 used stronger language, stating that the Panel’s assessment had ‘confirmed previous evaluations that acrylamide in food potentially increases the risk of developing cancer for consumers in all age groups’. The Regulation set Benchmark Levels for the presence of acrylamide, replacing the Indicative Values that had been in place previously, with the Benchmark Level for almost all product types lower than the Indicative Value that it replaced. For potato crisps, for example, the Indicative Value of 1000 ng g−1 was replaced with a Benchmark Level of 750 ng g−1. The justification given for this reduction, which did not reflect any change in the data on acrylamide levels in food products, was that Benchmark Levels were performance indicators, whereas Indicative Values had been triggers for investigation.
Commission Regulation (EU) 2017/2158 also contains an explicit threat that ‘Complementary to the measures provided for in this Regulation, the setting of Maximum Levels for acrylamide in certain foods should be considered in accordance with Regulation (EEC) No 315/93 following the entry into force of this Regulation’. Regulation 315/93, which came into force in February 1993, states that: ‘Food containing a contaminant in an amount which is unacceptable from the public health viewpoint and in particular at a toxicological level shall not be placed on the market’ (European Commission Citation1993). At a meeting of the European Parliament’s Environment, Public Health and Food Safety Committee in January 2017 (European Parliament Citation2017), it was stated that the intention was to impose Maximum Levels on sectors of the food industry that do not show ‘sufficient progress’ in reducing acrylamide in their products.
Regulation (EU) 2017/2158 also includes annexes in which mitigation measures to reduce acrylamide formation in different product types are described, from variety selection through crop management to a range of measures that have been shown to be effective during food processing. These are effectively codes of practice, and the wording of the regulation makes it clear that the adoption of these measures is compulsory: food businesses ‘shall’ apply the measures that are set out. Another key aspect of the regulation is the requirement for all food businesses to monitor the levels of acrylamide in their products, although businesses that perform retail activities and/or directly supply only local retail establishments are exempt from this requirement. Member States are also required to ensure compliance with the law.
The predominant route for acrylamide formation during cooking and processing is from free (soluble, non-protein) asparagine and reducing sugars within the Maillard reaction (Mottram et al. Citation2002; Stadler et al. Citation2002; Zyzak et al. Citation2003; Mottram Citation2007). The most abundant reducing sugars in crop plants are glucose, fructose and maltose (Halford et al. Citation2011), but there is very little maltose in potato tubers (Elmore et al. Citation2005). One approach to reducing the amount of acrylamide that forms in food is to reduce the concentrations of these metabolites in crop products using genetic (including biotech) and agronomic approaches (reviewed by Raffan and Halford Citation2019). In potatoes, which have a relatively high molar concentration of free asparagine compared with reducing sugars, the major factor determining acrylamide formation is the concentration of reducing sugars, although free asparagine concentration has been shown to contribute to the variance in acrylamide formation in some studies (Amrein et al. Citation2003; Becalski et al. Citation2004; Shepherd et al. Citation2010; Halford et al. Citation2012; Muttucumaru et al. Citation2014). In addition, sugars react with other free amino acids, as well as asparagine, and kinetic studies on potato fries have shown that the ratio of asparagine to other free amino acids should also be taken into account when considering factors affecting acrylamide formation (Parker et al. Citation2012).
The other approach to the problem is to modify processing methods, and such modifications have been compiled in a ‘Toolbox’ produced by FoodDrinkEurope, the latest update of which was published in 2019 (FoodDrinkEurope Citation2019). Many of the measures described in the Toolbox were incorporated into the compulsory mitigation methods described in Regulation (EU) 2017/2158. Our analysis of manufacturers’ data on acrylamide levels in potato crisps in Europe from 2002 to 2011 showed that this approach was initially successful, at least for that product, bringing about a statistically significant downward trend for mean levels of acrylamide from 763 ± 91.1 ng g−1 in 2002 to 358 ± 2.5 ng g−1 in 2011, a decrease of 53% (Powers et al. Citation2013). However, a later analysis (Powers et al. Citation2017) showed that acrylamide concentrations levelled off in subsequent years, with the mean concentration in potato crisps in 2016 being 412 ± 3.8 ng kg−1, slightly higher than that of 2011. This suggested that the most effective methods to reduce acrylamide levels had already been implemented by 2011 and further improvement was turning out to be difficult to achieve (Powers et al. Citation2017).
The problem of reducing acrylamide in food is made more difficult by the fact that the Maillard reaction is responsible for generating desirable attributes in cooked food, including colour from melanoidin pigments and flavour and aroma from a wide variety of compounds including pyrazines, pyrroles, furans, oxazoles, thiazoles and thiophenes (Mottram et al. Citation2007). These compounds give different cooked foods their signature flavours and aromas, define product types and distinguish one brand from another. Measures that reduce acrylamide formation, therefore, may well affect product quality as well (Elmore et al. Citation2010), although the fact that colour forms via similar pathways to acrylamide means that colour has become an important quality control parameter as an indicator of acrylamide formation (Halford et al. Citation2012; Elmore et al. Citation2015).
Our previous analyses (Powers et al. Citation2013, Citation2017) revealed another difficult problem for potato crisp manufacturers in the form of a pronounced seasonal effect on acrylamide levels, with acrylamide in the first 6 months of the year being much higher than in the second 6 months. The effect arises from the fact that European potatoes are harvested between July and October, and for the rest of the year are used from storage. Potatoes in storage are prone to cold and senescent sweetening, caused by an increase in vacuolar invertase (VInv) activity (Zhu et al. Citation2014; Clasen et al. Citation2016; Wiberley-Bradford and Bethke Citation2018) and, in the case of senescent sweetening, the breakdown of starch by phosphorylase L (PhL) and the starch-associated R1 enzyme. Indeed, several studies have shown an effect of storage on the potential for acrylamide formation in potatoes (De Wilde et al. Citation2005; Halford et al. Citation2012; Muttucumaru et al. Citation2014; Elmore et al. Citation2015). Potato storage facilities have typically kept potatoes to be used for crisping at 8.5–9.5 °C, and crisp manufacturers have been careful to use potatoes within their optimum storage window, which differs between varieties. Regulation (EU) 2017/2158 (European Commission Citation2017) includes these measures and stipulates a minimum storage temperature of 6°C. However, storing potatoes at temperatures high enough to avoid cold sweetening has only been possible because of the use of chemical sprout suppressants such as chlorpropham (CIPC; isopropyl N-(3-chlorophenyl)carbamate), but the European Commission’s Standing Committee on Plants, Animals, Food and Feed has recently declined to approve the renewal of chlorpropham’s authorisation for use as a sprout suppressant.
Our analyses also revealed a pronounced geographical factor, with potatoes grown in northern Europe having a higher acrylamide-forming potential than potatoes grown elsewhere (Powers et al. Citation2017). The combination of seasonal and geographical factors meant that acrylamide levels in 30% of crisp samples from northern Europe exceeded the current Benchmark Level of 750 µg kg−1 for the whole of the first half of every year from 2011 to 2016 (Powers et al. Citation2017). Even for the other regions of Europe, the seasonality effect meant that the ‘failure rate’ of crisps with respect to the Benchmark Level exceeded 10% in some months.
Here, we analyse manufacturers’ data from 2017 to 2019, together with the 2002 to 2016 data, to enable the trends over the whole period from 2002 to 2019 to be considered. We examine the effects of seasonality and geography, as well as crisp type, and compare the manufacturers’ data with data compiled by EFSA.
Materials and methods
Analysis of data provided by the European snacks association
European manufacturers’ data on acrylamide levels in potato crisps from 2002, when the presence of acrylamide in food was first reported, to 2019 were supplied by the European Snacks Association. The data covering the years 2002 to 2016 had been analysed previously (Powers et al. Citation2013, Citation2017) but were included to enable trends in the data to be considered for the full period. These data will be referred to as the ESA data set.
All analyses were carried out using procedures based on liquid chromatography tandem mass spectrometry (LC-MS/MS) or gas chromatography mass spectrometry (GC-MS) after derivatisation. All the laboratories that conducted the analyses had carried out validations on the methods used. The methods were compatible with the Comité Européen de Normalisation (European Committee for Standardisation) (CEN) standard methods: EN 16618:2015 (Food analysis – Determination of acrylamide in food by liquid chromatography tandem mass spectrometry (LC-ESI-MS/MS)), or CEN/TS 17083:2017 (Foodstuffs – Determination of acrylamide in food and coffee by gas chromatography-mass spectrometry (GC-MS) (https://www.cen.eu/work/areas/food/Pages/default.aspx)). The data were filtered to ensure that only data obtained using these methods were retained, resulting in a dataset for analysis comprising 99704 observations.
The GenStat (2018, 19th edition, © VSN International Ltd, Hemel Hempstead, UK) statistical package was used for all analyses. SigmaPlot (version 14, © Systat Software Inc. San Jose, California, US) was used for graphs. Excel (2016, © Microsoft Corporation, US) was used to store the data. In order to assess the overall trend over years and for different types, analysis of variance (ANOVA) was applied to the natural log (to base e) of the acrylamide data to test for an overall change in mean acrylamide over years (F-test). The log transformation was applied to stabilise the underlying variance in the data over the years so that the assumptions of ANOVA (homogeneous underlying variance over treatments, additivity of effects and a Normal distribution) were met. Specific comparisons of pairs of years of most interest were then enabled by application of the least significant difference (LSD) value at the 5% level of significance (p = .05).
Summary statistics were calculated for the whole data set of 99704 observations and for assigned types of crisp (standard, ridge/wave and thick cut) over years. Seasonality in the acrylamide values was considered by calculating summary statistics per month over years, with ANOVA being applied to test for overall statistical differences (p < .05, F-test) between months. Means and standard errors for all year by month combinations were also calculated, to consider both the variation in the seasonality and the overall trend in the time series.
Geographical effects were considered by grouping the samples into subsets according to the region of Europe (north, south, east or west) they had originated from. Tables of means, standard errors of means and numbers of observations were derived for the region by year combinations using the full set of data and then for each of the three types of product separately.
Analysis of data provided by the European Food Safety Authority (EFSA)
Data on acrylamide levels in potato crisps supplied to EFSA by European Union Member States for the years 2015 to 2018 were obtained through a public access to documents request. The data comprised 1334 observations, but 113 of these were omitted because they had been made without a classifiable method of measuring acrylamide concentrations, and another 55 were omitted because they had not been made using a method deemed to comply with the CEN standards, leaving 1166 usable observations. These included 48 cases where the acrylamide value was missing due to it being below the limit of quantification (LOQ) or limit of detection (LOD) values. Acrylamide for these 48 observations was set at the recorded LOQ to be conservative, and to avoid exclusion of such important data. The 1166 usable observations from 2015 to 2018 were combined with the 958 observations of potato crisp acrylamide results from 2011 to 2014 that were included in the previous analysis of EFSA data (Powers et al. Citation2017) to allow trends over the whole period from 2011 to 2018 to be considered. The total number of EFSA observations for 2011–2018 was therefore 2124.
Summary statistics were calculated over years and months and ANOVA was applied. Pearson correlation was used to test (F-test) the strength of association between the EFSA and ESA yearly means overall.
Results
Acrylamide levels in potato crisps from 2002 to 2019
European manufacturers’ data on acrylamide levels in potato crisps were provided for the period 2002 to 2019. The data set included observations from every European Union country apart from Estonia, Luxembourg, Malta and Slovenia, as well as observations from Switzerland and Norway. Only observations that had been obtained using LC-MS/MS or GC-MS according to CEN standards EN 16618:2015 or CEN/TS 17083:2017 were retained for analysis, comprising 99704 observations in total (Supplementary File S1). Note that a potato crisp is defined here as a thin slice of potato (Solanum tuberosum) tuber which has been fried to a ‘crisp’ texture through the absorption of hot oils into the potato base and the reduction of moisture content to a specified level. In American English, this is known as a potato chip.
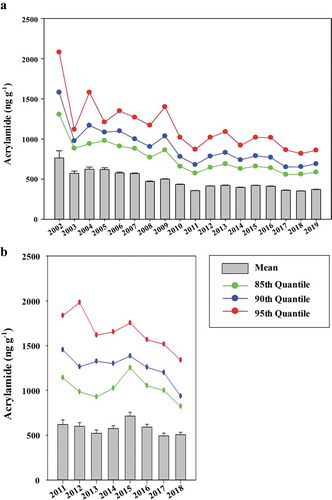
For the full set of data, the means, SEs, numbers of observations, 85th, 90th and 95th quantile values, maximum values and % of samples with more than 750, 1000 and 2000 ng g−1 acrylamide for each year are given in . The analysis showed that the plateauing of acrylamide levels which was observed previously for the period from 2011 to 2016 continued through to 2019 ()), with the level in 2019 being slightly higher than that in 2011 (372 ± 2.6 ng g−1 compared with 358 ± 2.5 ng g−1). However, the lowest mean observed so far was attained in 2018 at 353 ± 2.7 ng g−1, representing a 54% reduction since 2002. Despite the mean plateauing from 2011 onwards, the 85th, 90th and 95th quantiles did show evidence of downward progress ()), the 90th quantile being lower than the 750 ng g−1 Benchmark Level for potato crisps set in Commission Regulation (EU) 2017/2158 for 2017 through to 2019. Previously it had only been below the 750 ng g−1 mark in 2011 and 2014, so this was the first time it had been below the Benchmark Level for consecutive years. It has been lower than 1000 ng g−1 since 2010. The 95th quantile ranged from 819 to 863 ng g−1 in 2017 to 2019, compared with 2080 ng g−1 in 2002 (a 60.6% decrease) and 870 ng g−1 in 2011, the first year that it was below 1000 ng g−1. The numbers of samples with more than 1000 ng g−1 and 2000 ng g−1 were also reduced, with only 17 of 9749 samples having more than 2000 ng g−1 acrylamide in 2019. Nevertheless, the highest observed value in 2019 was 3000 ng g−1, four-fold greater than the Benchmark Level.
Table 1. Acrylamide (ng g−1) in samples of potato crisps over years, showing mean, standard error of mean (SE), number of observations (n), 85%, 90% and 95% quantiles (Q85, Q90 and Q95), maximum levels, and proportion (%) of samples containing greater than 750, 1000 and 2000 ng g−1. (a) Data provided by the European Snacks Association (ESA), compiled from data supplied by European manufacturers. (b) Data provided by the European Food Standards Agency (EFSA), compiled from data supplied by European Union Member States. (c) The yearly means for the ESA and EFSA data shown together, and the fold-difference
Figure 1. Overall mean acrylamide levels (ng g−1) in samples of potato crisps shown over years, with standard errors and trends in 85%, 90% and 95% quantiles. (a) European Snacks Association data for years 2002–2019, compiled from data supplied by European manufacturers. (b) European Food Safety Authority data for years 2011–2018, compiled from data supplied by European Union Member States
Analysis of variance (ANOVA) was applied to the data on the natural log (to base e) scale and revealed significant differences in acrylamide levels between the years (p < .001, F-test) (). Looking at the data since 2011, the mean level of acrylamide was significantly higher (p < .05, LSD) in years 2012–2017 when compared to the mean seen in 2011, although the difference in 2017 was marginal. The mean values in 2011 and 2018 were not significantly different (p > .05, LSD), but there was a statistically significant rise again in 2019 (p < .05, LSD). It is clear that further reductions in acrylamide levels are proving hard to achieve, and while that is the case we would expect fluctuations to occur due to the inconsistent nature of potatoes from one season to the next, so the data were consistent with this expectation.
Table 2. Analysis of variance of European Snacks Association acrylamide data for samples of potato crisps from Europe for 2002 to 2019 to show differences between years. (a) Mean acrylamide (ng g−1) for each year on the natural log (to base e) scale and number of observations (n). (b) Least significant difference (LSD) values on 99686 degrees of freedom at the 5% (p < .05) level of significance. The value for a particular comparison of the means in Table 2 is given by reading along the appropriate row and up the appropriate column
Data were also obtained from the European Food Safety Authority (EFSA). European Union Member States have been obliged to screen foods for the presence of acrylamide since 2007 and to send the data to EFSA for compilation. EFSA’s reports based on these data (EFSA Citation2009, Citation2010, Citation2011, Citation2012; CONTAM Panel Citation2015) have informed the development of the European Commission’s risk management measures for acrylamide, including Commission Regulation (EU) 2017/2158 (European Commission Citation2017). A total of 958 observations of potato crisp acrylamide results from 2011 to 2014 that were included in the previous analysis of EFSA data (Powers et al. Citation2017) were combined with the data for 2015–2018, making a total number of 2124 observations for 2011–2018 (Supplementary File S2), giving a combined data set that was much smaller than the ESA data set.
The data set included observations from 19 European Union countries, the Member States that provided no data being Bulgaria, Croatia, Czech Republic, France, Latvia, the Netherlands, Portugal, Romania and Slovakia, although the origin of 53 observations was withheld. There were also data from Norway but not Switzerland. The origins of the data therefore substantially overlapped those of the ESA dataset but were not identical.
The means, SEs, numbers of observations, 85th, 90th and 95th quantile values, maximum values and % of samples with more than 750, 1000 and 2000 ng g−1 acrylamide for each year are given in . Previous analysis of EFSA’s data from 2011 to 2014 showed a consistently higher level of acrylamide than for the ESA data (Powers et al. Citation2017). This puzzling trend continued in the more recent data (2015 to 2018) ()). The means for the two data sets and the fold-difference for each year are shown together in , with the EFSA mean ranging from 1.74 times the ESA mean in 2011 to 1.23 times the ESA mean in 2013.
The EFSA data did show an overall slight fall in the average acrylamide over the years 2011–2018, and ANOVA () showed that from 2015, when the mean was 715 ± 40.5, there was a significant fall in acrylamide (p < .05, LSD) to 2016 (591 ± 31.5), and again from 2016 to 2017 (493 ± 31.1). A slight rise from 2017 to 2018 (505 ± 28.5) was only marginally significant (p < .05, LSD). As with the ESA data, the 85th, 90th and 95th quantiles decreased more noticeably; indeed, this was even more pronounced in the EFSA data ()). Nevertheless, even the 85th quantile remained well above the 750 ng g−1 Benchmark Level at 821 ng g−1 in 2018.
Table 3. Analysis of variance of EFSA acrylamide data for potato crisps from 2011 to 2018 to show differences between years. (a) Mean acrylamide (ng g−1) for each year on the natural log (to base e) scale and number of observations (n). (b) Least significant difference (LSD) values on 2119 degrees of freedom at the 5% (p < .05) level of significance. The value for a particular comparison of the means is given by reading along the appropriate row and up the appropriate column
Observations exceeding the Benchmark Level for acrylamide of 750 ng g−1
The ESA data show a steady reduction in the proportion of samples with acrylamide exceeding 750 ng g−1, the Benchmark Level set for potato crisps in Commission Regulation (EU) 2017/2158 (European Commission Citation2017) (, )). In 2002, more than 40% of samples contained more than 750 ng g−1 acrylamide but by 2011 the proportion had fallen to 7.71%. Although the proportion rose again in 2012 to 2016, it fell again after that, with years 2017 to 2019 having the three lowest proportions recorded (7.35%, 6.46% and 7.75%). The distribution of the 2019 data with respect to the 750 ng g−1 level is shown in ). Notably, the mean of the observations greater than 750 ng g−1 for each year has not yet fallen below 1000 ng g−1 (it was 1006 ± 10.9 ng g−1 in 2019), so a small number of very large observations of acrylamide are still occurring.
Figure 2. (a) Proportion (%) of samples of potato crisps containing more than 750 ng g−1 acrylamide (the Benchmark Level set for potato crisps in Commission Regulation (EU) 2017/2158 (European Commission Citation2017)) in European Snacks Association data for years 2002–2019. (b) Histogram of data on acrylamide in potato crisps (ng g−1) provided by the European Snacks Association for 2019, showing frequencies of observations within 50 ng g−1 bands. The Benchmark Level of 750 ng g−1 set in Commission Regulation (EU) 2017/2158 (European Commission Citation2017) is indicated. The percentage of observations greater than 750 ng g−1 is shown
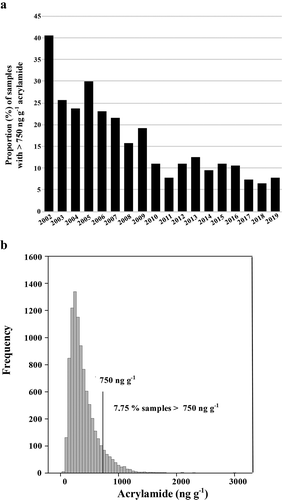
The EFSA data, which only cover the more recent period of 2011 to 2018, also show evidence of progress, with 19.32% of samples over 750 ng g−1 in 2019, compared with 25.11% in 2011, although the lowest figure was 19.00% in 2013 (). However, the most striking aspect of these numbers is how much higher they are than for the ESA data ().
Seasonality
Considering the time series over years of the month-by-month averages ()) and averaging over months for the years 2002 to 2019 ()) for the ESA data, there was a strong trend of higher acrylamide levels from November to June, followed by lower acrylamide from July to October, when new season potatoes start to become available (). May was the month when acrylamide levels were greatest, while the lowest level of acrylamide was attained in August ()). ANOVA revealed highly significant (p < .001, F-test) differences between the months. shows the monthly loge data means and LSDs for their comparison. The mean for August was only marginally statistically lower than the mean for July (p < .05, LSD), but both of these were statistically different (p < .05, LSD) from the mean for September, being the month with the next lowest acrylamide levels.
Table 4. Number of observations (n), mean (ng g−1), standard error of mean (SE), 85%, 90% and 95% quantile (Q85, Q90 and Q95) values and proportion (%) of samples containing greater than 750 ng g−1 for acrylamide in samples of potato crisps from Europe for each month. (a) Data from 2002 to 2019 provided by the European Snacks Association (ESA), compiled from data supplied by European manufacturers. (b) Data from 2011 to 2018 provided by the European Food Standards Agency (EFSA), compiled from data supplied by European Union Member States
Table 5. Analysis of variance of European Snacks Association acrylamide data for samples of potato crisps from Europe for 2002 to 2019 to show differences between months. (a) Mean acrylamide (ng g−1) for each month on the natural log (to base e) scale and number of observations (n). (b) Least significant difference (LSD) values on 99692 degrees of freedom at the 5% (p < .05) level of significance. The value for a particular comparison of the means is given by reading along the appropriate row and up the appropriate column
Figure 3. Seasonality in acrylamide levels in samples of potato crisps from European Snacks Association data for years 2002–2019. (a) Mean acrylamide levels over time (2002–2019) with standard errors, plotted monthly. (b) Mean acrylamide levels per month over all years with standard errors and with trend in 85%, 90% and 95% quantiles. (c) Proportion of samples each month containing more than 750 ng g−1 acrylamide (the Benchmark Level set for potato crisps in Commission Regulation (EU) 2017/2158 (European Commission Citation2017)), over the period 2017–2019
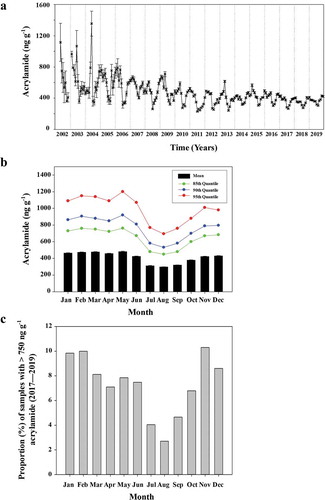
This seasonality illustrates very clearly the problems caused by the natural variability in the potatoes that represent the primary raw material for the manufacture of potato crisps. Inevitably, it affects the proportion of samples each month with more than the Benchmark Level of 750 ng g−1, and this is shown graphically for the years 2017 to 2019 in ). Hence, while the overall proportion of samples with more than the Benchmark Level of acrylamide in those years was between 6.46% and 7.75%, the monthly proportions ranged from 2.70% in August to 10.31% in November.
Despite the greater variability in the EFSA data, seasonality was still apparent (), with summer mean acrylamide levels lowest in July at 443 ± 45.9 ng g−1 and winter levels highest in March at 721 ± 38.3 ng g−1. However, the pattern did diverge from that seen in the ESA data in that the levels observed in January and February were relatively low at 427 ± 43.4 ng g−1 and 454 ± 33.8 ng g−1, respectively, these being the only 2 months where the levels in the EFSA data were lower than in the ESA data. A higher percentage of observations were greater than 750 ng g−1 in every month except February for the EFSA data, with a maximum of 34.04% being more than the Benchmark Level in December. ANOVA revealed highly significant (p < .001, F-test) differences between the months. shows the monthly loge data means and LSDs for their comparison. The highest mean, in March, was significantly greater (p < .05, LSD) than the means in May and November.
Table 6. Analysis of variance of EFSA acrylamide data for potato crisps from 2011 to 2018 to show differences between months. (a) Mean acrylamide (ng g−1) for each month on the natural log (to base e) scale and number of observations (n). (b) Least significant difference (LSD) values on 1887 degrees of freedom at the 5% (p < .05) level of significance. The value for a particular comparison of the means is given by reading along the appropriate row and up the appropriate column
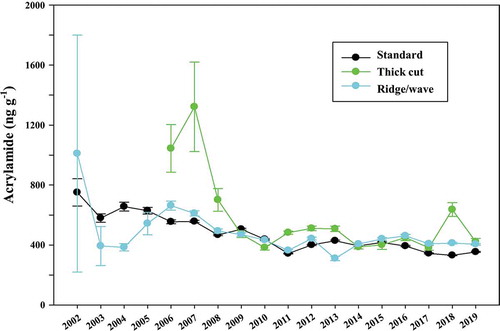
Crisp types
Three crisp types were represented in the ESA data set: standard, thick cut, and ridge/wave. The standard and thick cut types had been produced from a slice of potato with a flat or straight surface on both sides (the two largest surface areas) of the slice. Slice thickness for the standard type was typically between 0.127 cm and 0.165 cm, while the thickness of the thick cut type was from 0.165 cm to 0.216 cm. The ridge/wave type had been produced from a slice of potato of the same thickness as the thick cut type but had a wave-, ridge- or crinkle-cut design on one or both sides of the slice.
The mean, standard error of the mean, number of values, mean of loge data, Q85, Q90 and Q95 quantiles, maximum values and the proportion of samples with more than 750 ng g−1 acrylamide for the three different types for each year (2002 to 2019) in the ESA data set are given in . The average LSD (5%) for comparing the means on the loge scale is 0.1716. The raw means and standard errors for each year are plotted in , showing that in recent years there have been no major differences between the crisp types apart from a spike in thick cut crisps in 2018. However, the thick cut and ridge/wave types had a higher proportion of samples containing more than 750 ng g−1 acrylamide: 10.2% and 9.9%, respectively, in 2019, compared with 6.7% for standard crisps, and 22.2% and 10.9 %, respectively, in 2018, compared with 4.9% for standard crisps ().
Table 7. Mean (ng g−1), standard error of mean (SE), number of values (n), mean of loge data, Q85, Q90, Q95, maximum value and proportion (%) of samples >750 ng g−1 for acrylamide by type and year in samples of potato crisps from Europe 2002 to 2019
Figure 4. Overall mean acrylamide levels (ng g−1) in samples of potato crisps of different types (standard, thick cut and ridge/wave) shown over years from 2002–2019, with standard errors
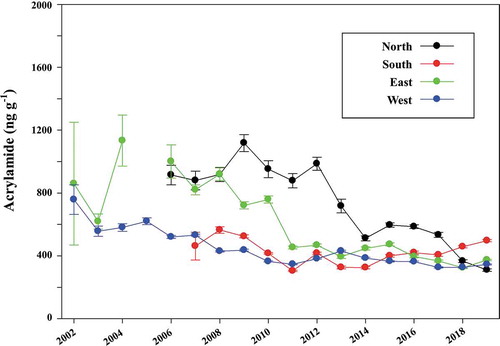
Geographical effects
The ESA dataset was subdivided according to the region of Europe (north, south, east or west) from which the samples originated. The assignment of countries to regions is shown in . The mean, standard error of the mean, number of values, proportion of samples with more than 750 ng g−1 acrylamide and mean of loge data for acrylamide in crisps originating from each region for each year are given in . The average LSD (5%) for comparing means on the loge scale is 0.1266.
Table 8. Grouping of 25 European countries into geographic regions (north, south, east and west) that formed the basis of the regional analysis of acrylamide levels. Note that there were no observations from Estonia, Luxembourg, Malta or Slovenia in the dataset
Table 9. Mean (ng g−1), standard error of mean (SE), number of values (n), proportion (%) of samples with more than 750 ng g−1 and mean of loge data for acrylamide by region and year in samples of potato crisps from Europe, 2002 to 2019
The raw means and standard errors are plotted in , revealing important trends over the most recent years. Our previous analysis (Powers et al. Citation2017) showed levels of acrylamide in the north and east to be generally higher than in the south and west, and despite the levels in the north and east moving progressively towards those in the south and west, those in the north remained higher than in the other regions right up to 2016. Analysis of the more recent data showed the north continued to have the highest average value in 2017, but by 2018 and 2019 the south had the greatest average value, due partly to a striking improvement in the north and partly to values in the south rising slightly.
Figure 5. Overall mean acrylamide levels (ng g−1) in samples of potato crisps in the ESA dataset from different regions of Europe (north, south, east and west; Table 9), shown over years from 2002–2019, with standard errors
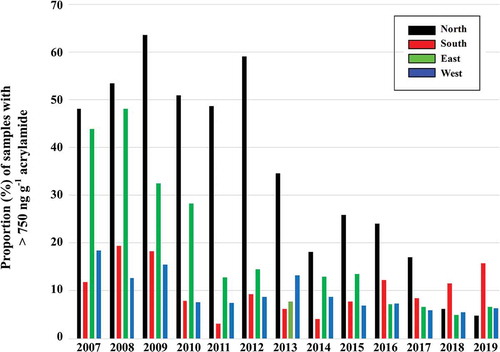
The progress made in the north and east was also reflected in the proportion of samples with more than 750 ng g−1 acrylamide, which fell in the north from 59.15% in 2012 to just 4.86% in 2019 and in the east from 48.11% in 2008 to 4.90% in 2018 (). In contrast, the lowest proportion of samples with more than 750 ng g−1 acrylamide in the south was achieved in 2011, at just 3.06%, but this had risen to 15.75% by 2019 ().
Figure 6. Proportion (%) of samples in the ESA dataset from different regions of Europe (north, south, east and west; Table 9) with more than 750 ng g−1 acrylamide over years from 2007 (the first year in which there was data from all four regions) to 2019
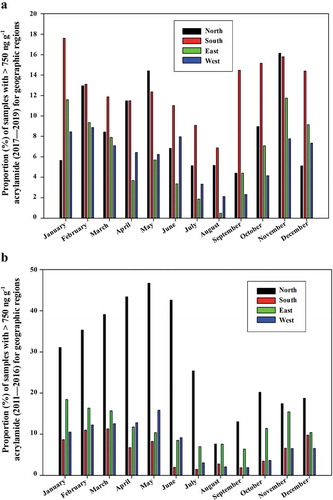
Geographical factors combined with seasonality to exacerbate the problem for manufacturers, with the proportion of samples exceeding 750 ng g−1 acrylamide in the south, for example, averaging 17.60% in January over the period 2017 to 2019, and in the north averaging 16.14% in November over the same period (). This is shown graphically in ), illustrating how seasonality affects all of the regions, with acrylamide levels rising slightly earlier in the year in the south than in the other regions. ) shows similar data from the 2011 to 2016 period (Powers et al. Citation2017). Comparing the two plots shows how much progress has been made, particularly in the north, where the average proportion of samples exceeding 750 ng g-1 acrylamide in May over the earlier period approached 50%, and exceeded 30% over the whole of the first half of the year.
Table 10. Proportion (%) of samples of potato crisps with more than 750 ng g−1 acrylamide for each month for the period 2017 to 2019
Figure 7. Proportion (%) of samples in the ESA dataset with more than 750 ng g−1 acrylamide each month for geographic regions of Europe over periods. (a) 2017–2019. (b) 2011–2016 (Powers et al. Citation2017)
Discussion
Previous analyses of data provided by the European Snacks Association on acrylamide levels in potato crisps showed a clear downward trend from 2002, the year in which the presence of acrylamide in food was first reported (Tareke et al. Citation2002), to 2011, followed by a plateau (Powers et al. Citation2013, Citation2017). The inclusion of more recent data in the present study showed that the plateau continued through to 2019, although the mean for 2018 was the lowest yet recorded at 353 ± 2.7 ng g−1. This represented a 54% decrease from 2002. Despite the plateau in overall means, there was evidence of downward progress in the Q85, Q90 and Q95 quantiles, the proportion of samples with more than 750 ng g−1 acrylamide and the number of samples with very high levels.
The progress made between 2002 and 2011 was due to measures such as improved control of cooking temperature and duration, blanching (removal of sugars and other soluble metabolites in hot water before frying), vacuum frying, control of moisture levels in the finished product, selecting appropriate varieties for specific end uses, which for crisps meant very low-sugar varieties used only within their optimum storage window, and the careful control of potato storage temperature and conditions, as well as post-frying quality control based on colour. Manufacturers also introduced checks on potato sugar concentration at harvest, during storage and at the factory gate. The progress made in recent years in reducing the number of samples with more than 750 ng g−1 acrylamide and the number with very high acrylamide levels, compared with the plateauing of the overall mean, suggests that improvements in quality control measures were responsible, rather than changes to processing that would lower the amount of acrylamide forming per se.
Processing measures introduced by manufacturers in recent years include pulsed electric field technology. Our analysis showed no evidence that this has been effective in reducing overall mean acrylamide levels, perhaps because it has not been adopted widely enough due to its impact on product quality. Indeed, there was no suggestion from the data that the mean could be reduced substantially below where it has been since 2011, or that acrylamide levels could be kept at or below the Benchmark Level of 750 ng g−1 all of the time. We have stated previously that further progress in reducing acrylamide levels in potato products will require a step-change in the composition of potatoes; in other words the development of potato varieties with much lower concentrations of reducing sugars and/or free asparagine, that can be stored cold without accumulating reducing sugars. Such varieties, Innate® and Innate® Generation 2 (USDA-APHIS Citation2013, Citation2014), produced by the Simplot Company, are already on the market in the USA. These are genetically modified to reduce expression of a tuber-specific asparagine synthetase gene, ASN1, a phosphorylase L gene (PhL) and starch-associated R1 gene (R1), as well as a gene (PPO5) encoding polyphenol oxidase, an enzyme involved in bruising (Rommens et al. Citation2008; Chawla et al. Citation2012). Innate® Gen. 2 also carries resistance to late blight disease (Phytophthora infestans) and has reduced expression of a vacuolar invertase gene (VInv) (USDA-APHIS Citation2014), which is linked to cold and senescent sweetening in potatoes. The VInv gene has also been targeted using a genome editing technique, TALENs (transcription activator-like effector nuclease) (Clasen et al. Citation2016). However, there is currently no prospect of GM or genome edited potatoes being grown commercially in the European Union (Halford Citation2019).
There was more evidence of progress when the data were broken down into regions, with the north and east regions showing strong improvement both in the overall mean and in the proportion of samples below the 750 ng g−1 Benchmark Level. On the other hand, there was a suggestion of a slight increase in levels in the south. The improvement in the north in recent years was particularly striking. Previously, we have suggested that potatoes grown in the north of Europe could be higher in acrylamide-forming potential than those grown in the other regions (Powers et al. Citation2017), with potato composition perhaps being affected by the relatively long day length of the northern summer, or the shorter growing season, with potatoes being harvested while still immature. The recent improvement suggests that improved varieties have become available, or that crisp manufacturers have switched to imported potatoes. Alternatively, it is possible that new technologies and more stringent quality control measures have enabled manufacturers in the north to compensate for the problems presented by the composition of the potatoes they use. The origin of the potatoes used in the production of the samples that were analysed was only provided in a very small proportion of the total, so it was not possible to conclude which, if any, of these explanations accounted for the improvement.
Seasonality continued to exacerbate the problem for manufacturers, as a result of the entirely natural tendency for potatoes to accumulate glucose and fructose in response to cold storage (cold sweetening) and the emergence from dormancy (senescent sweetening), caused in both cases by an increase in vacuolar invertase (VInv) activity (Zhu et al. Citation2014; Clasen et al. Citation2016; Wiberley-Bradford and Bethke Citation2018). Senescent sweetening also involves starch breakdown by phosphorylase L (PhL) and starch-associated R1. Potato storage in the European Union has recently been made more difficult by the loss of the storage industry’s preferred sprout suppressant, chlorpropham (CIPC; isopropyl N-(3-chlorophenyl)carbamate), which did not gain re-approval for use from the European Commission’s Standing Committee on Plants, Animals, Food and Feed in 2019. CIPC was used together with maleic hydrazide, another growth regulator applied as an in-field foliar spray. An effective alternative to CIPC, 1,4-dimethylnapthalene (DMN), which has been used in the USA for many years, has been approved at EU level but has not received national registration in all EU Member States as yet. Another possible alternative is ethylene, which is effective in cold storage but becomes ineffective as soon as the potatoes are removed from the store. Previously it has been used for French fry but not crisping potatoes. Another alternative is spearmint oil, the active ingredient of which is a terpenoid, R-carvone (C10H14O), but spearmint oil is relatively expensive compared with CIPC, less effective, particularly for medium and long-term storage, and has a strong aroma with the potential for tainting the final product.
It may take some time for the storage industry to come to terms with the loss of CIPC (Paul et al. Citation2016), and it is possible that some of the progress made in reducing acrylamide levels in potato products may be reversed until it does. In any case, seasonality will remain a problem and must be taken into account if changes to the regulatory situation are being considered.
The combination of geographical and seasonal factors continued to have a profound effect on the proportion of samples exceeding the 750 ng g−1 Benchmark Level for acrylamide, with the proportion reaching almost 18% in the south over the 2017 to 2019 period. However, this aspect of the data showed perhaps the most striking illustration of progress when compared with the 2011 to 2016 period, during which the proportion of samples exceeding 750 ng g−1 acrylamide in the north was more than 30% for the whole of the first half of the year, peaking at almost 50% in May.
In 2017 we reported that the type of crisp, i.e. standard, thick cut, or ridge/wave, had little effect on the level of acrylamide that forms (Powers et al. Citation2017). Acrylamide levels were higher in the thicker types of crisp in the first years for which data were available, despite the thicker types (thick cut and ridge/wave) having a lower surface area to volume ratio, but the difference had disappeared by 2016, suggesting that manufacturers had devised and applied measures to counterbalance any effects of the different crisp designs. The present study showed that this continued from 2017 to 2019, but did reveal that the thicker crisp types had a higher proportion of samples with more than the 750 ng g−1 Benchmark Level than standard crisps. Notably, the proportion of thick cut crisp samples that exceeded the 750 ng g−1 Benchmark Level in 2018 was 22.2%.
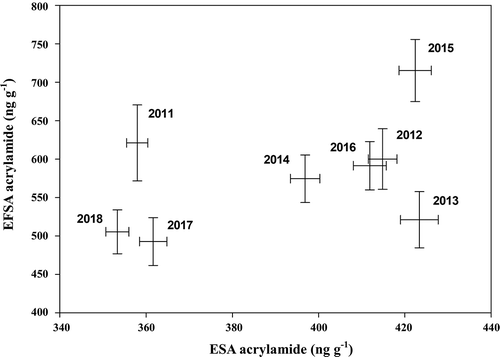
In previous studies (Powers et al. Citation2013, Citation2017) we noted a marked discrepancy between the data provided by ESA and the data compiled by EFSA. The trend of levels of acrylamide in the EFSA data being consistently higher than in the ESA data continued through the 2017 to 2019 period. The Pearson correlation between EFSA and ESA mean data is not strong, r = 0.458 (n = 8, p = .254, F-test), but the plot of the pairs of means () shows general positive correspondence over the years apart from 2011 and 2013. In particular, the two most recent years where data were available for both organisations, 2017 and 2018, conform somewhat better, albeit of course with the discrepancy between the overall magnitudes. We have suggested previously (Powers et al. Citation2017) that the discrepancy could be partly explained by the fact that the EFSA sampling is not carried out evenly throughout the year, with relatively few samples coming from July to September, when acrylamide levels would be expected to be at their lowest. However, comparing the monthly means for the two datasets () shows the EFSA mean to be higher than the ESA mean for every month except January and February, so sampling time can be ruled out. The ESA data were supplied entirely by companies that are members of the European Snacks Association (ESA), and awareness of the FoodDrinkEurope Toolbox measures (FoodDringEurope 2019) amongst those companies is high. However, if that were the explanation, the gap between the ESA and EFSA means might be expected to narrow as more non-ESA manufacturers adopted the measures described in the Toolbox. The EFSA data set is, of course, a fraction of the size of the ESA data set, and therefore more likely to show statistical bias, and that could be part of the explanation. We therefore strongly recommend that the EFSA data set should not be the only one to be taken into consideration when important decisions on regulations or other risk management measures are made. However, one aspect that both data sets shared was the decline in the Q85, Q90 and Q95 quantiles, illustrating the progress that has been made in reducing the number of samples containing very high levels of acrylamide.
Figure 8. Correlation between yearly means for ESA and EFSA data (r = 0.458, n = 8, p = .254, F-test). The pairs of means are plotted with standard errors and labelled by year
Acknowledgments
Rothamsted Research receives grant-aided support from the Biotechnology and Biological Sciences Research Council (BBSRC) of the United Kingdom, and NGH is supported at Rothamsted Research by the Designing Future Wheat programme (BB/P016855/1). The European Snacks Association (ESA) is a trade association representing the European savoury snacks industry on behalf of member snack manufacturers and suppliers to the industry. ESA is guided by a board of directors drawn from member companies. The data presented in this report were provided anonymously by member companies via the ESA Secretariat. ESA member companies had no influence over the data analysis and the views expressed in the paper do not necessarily reflect the views of those ESA member companies.
References
- Amrein TM, Bachmann S, Noti A, Biedermann M, Barbosa MF, Biedermann-Brem S, Grob K, Keiser A, Realini P, Escher F, et al. 2003. Potential of acrylamide formation, sugars, and free asparagine in potatoes: a comparison of cultivars and farming systems. J Agric Food Chem. 51(18):5556–5560. doi:10.1021/jf034344v.
- Becalski A, Lau BPY, Lewis D, Seaman SW, Hayward S, Sahagian M, Ramesh M, Leclerc Y. 2004. Acrylamide in French fries: influence of free amino acids and sugars. J Agric Food Chem. 52(12):3801–3806. doi:10.1021/jf0349376.
- Chawla R, Shakya R, Rommens CM. 2012. Tuber-specific silencing of asparagine synthetase-1 reduces the acrylamide-forming potential of potatoes grown in the field without affecting tuber shape and yield. Plant Biotech J. 10:913–924. doi:10.1111/j.1467-7652.2012.00720.x.
- Clasen BM, Stoddard TJ, Luo S, Demorest ZL, Li J, Cedrone F, Tibebu R, Daviso S, Ray EE, Daulhac A, et al. 2016. Improving cold storage and processing traits in potato through targeted gene knockout. Plant Biotech J. 14:169–176. doi:10.1111/pbi.12370.
- [CONTAM Panel] EFSA Panel on Contaminants in the Food Chain. 2015. Scientific opinion on acrylamide in food. EFSA J. 13:4104. doi:10.2903/j.efsa.2015.4139
- Curtis TY, Postles J, Halford NG. 2014. Reducing the potential for processing contaminant formation in cereal products. J Cereal Sci. 59:382–392. doi:10.1016/j.jcs.2013.11.002.
- De Wilde T, De Meulenaer B, Mestdagh F, Govaert Y, Vandeburie S, Ooghe W, Fraselle S, Demeulemeester K, van Peteghem C, Calus A, et al. 2005. Influence of storage practices on acrylamide formation during potato frying. J Agric Food Chem. 53:6550–6557. doi:10.1021/jf050650s.
- [EFSA] European Food Safety Authority. 2009. Results on the monitoring of acrylamide levels in food. EFSA Sci Rep. 285:1–26.
- [EFSA] European Food Safety Authority. 2010. Results on acrylamide levels in food from monitoring year 2008. Sci Rep EFSA J. 8:1599. doi:10.2903/j.efsa.2010.1599
- [EFSA] European Food Safety Authority. 2011. Results on acrylamide levels in food from monitoring years 2007-2009 and exposure assessment. EFSA J. 9:2133. doi:10.2903/j.efsa.2011.2133
- [EFSA] European Food Safety Authority. 2012. Update on acrylamide levels in food from monitoring years 2007 to 2010. EFSA J. 10:2938. doi:10.2903/j.efsa.2012.2938
- Eisenbrand G. 2020. Revisiting the evidence for genotoxicity of acrylamide (AA), key to risk assessment of dietary AA exposure. Arch Toxicol. 94:2939–2950. doi:10.1007/s00204-020-02794-3.
- Elmore JS, Dodson AT, Briddon A, Halford NG, Mottram DS. 2010. The effects of storage on the formation of aroma and acrylamide in heated potato. In: Mottram DS, Taylor AJ, editors. Controlling Maillard pathways to generate flavors. Washington (DC): American Chemical Society; p. 95–109.
- Elmore JS, Briddon A, Dodson AT, Muttucumaru N, Halford NG, Mottram DS. 2015. Acrylamide in potato crisps prepared from 20 UK-grown varieties: effects of variety and tuber storage time. Food Chem. 182:1–8. doi:10.1016/j.foodchem.2015.02.103.
- Elmore JS, Koutsidis G, Dodson AT, Mottram DS, Wedzicha BL. 2005. Measurement of acrylamide and its precursors in potato, wheat, and rye model systems. J Agric Food Chem. 53:1286–1293. doi:10.1021/jf048557b.
- European Commission. 1993. Council regulation (EEC) No 315/93 of 8 February 1993 laying down community procedures for contaminants in food. Brussels (Belgium):European Commission.
- European Commission. 2017. Establishing mitigation measures and benchmark levels for the reduction of the presence of acrylamide in food. Brussels (Belgium):European Commission.
- European Parliament. 2017. http://www.emeeting.europarl.europa.eu/emeeting/committee/agenda/201701/ENVI?meeting=ENVI-2017-0130_1&session=01-31-14–00.
- [IARC] International Agency for Research on Cancer. 1994. IARC monographs on the evaluation of carcinogenic risks to humans vol 60. Some industrial chemicals. Lyon (France): International Agency for Research on Cancer (IARC).
- [JECFA] Joint FAO/WHO Expert Committee on Food Additives. 2006. Evaluation of certain food contaminants. Sixty-fourth report of the Joint FAO/WHO Expert Committee on Food Additives. [Rome, 2005 Feb 8–17]; Geneva (Switzerland): WHO Technical Reports Series 930.
- FoodDrinkEurope. 2019. Acrylamide toolbox 2019. Brussels (Belgium): FoodDrinkEurope.
- Friedman M. 2003. Chemistry, biochemistry and safety of acrylamide. A review. J Agric Food Chem. 51:4504–4526.
- Halford, NG. 2019. Legislation governing genetically modified and genome‐edited crops in Europe: the need for change. J. Sci. Food Agric. 99:8–12.
- Halford NG, Curtis TY, Muttucumaru N, Postles J, Mottram DS. 2011. Sugars in crop plants. Ann Applied Biol. 158:1–25. doi:10.1111/j.1744-7348.2010.00443.x.
- Halford NG, Muttucumaru N, Powers SJ, Gillatt PN, Hartley S, Elmore JS, Mottram DS. 2012. Concentrations of free amino acids and sugars in nine potato varieties: effects of storage and relationship with acrylamide formation. J Agric Food Chem. 60:12044–12055. doi:10.1021/jf3037566.
- Mottram DS. 2007. The Maillard reaction: source of flavour in thermally processed foods. In: Berger RG, editor. Flavours and fragrances: chemistry, bioprocessing and sustainability. Berlin (Germany): Springer-Verlag; p. 269–284.
- Mottram DS, Wedzicha BL, Dodson AT. 2002. Acrylamide is formed in the Maillard reaction. Nature. 419:448–449. doi:10.1038/419448a.
- Muttucumaru N, Powers SJ, Briddon A, Elmore JS, Mottram DS, Halford NG. 2014. Evidence for the complex relationship between the concentrations of free amino acids, sugars and acrylamide-forming potential in potato. Ann Applied Biol. 164:286–300. doi:10.1111/aab.12101.
- Parker JK, Balagiannis DP, Higley J, Smith G, Wedzicha BL, Mottram DS. 2012. Kinetic model for the formation of acrylamide during the finish-frying of commercial French fries. J Agric Food Chem. 60:9321–9331. doi:10.1021/jf302415n.
- Paul V, Ezekiel R, Pandey R. 2016. Sprout suppression on potato: need to look beyond CIPC for more effective and safer alternatives. J Food Sci Technol. 53:1–18. doi:10.1007/s13197-015-1980-3.
- Powers SJ, Mottram DS, Curtis A, Halford NG. 2013. Acrylamide concentrations in potato crisps in Europe from 2002 to 2011. Food Addit Contam Part A. 30:1493–1500. doi:10.1080/19440049.2013.805439.
- Powers SJ, Mottram DS, Curtis A, Halford NG. 2017. Acrylamide levels in potato crisps in Europe from 2002 to 2016. Food Addit Contam Part A. 34:2085–2100. doi:10.1080/19440049.2017.1379101.
- Raffan S, Halford NG. 2019. Acrylamide in food: progress in and prospects for genetic and agronomic solutions. Ann Applied Biol. 175:259–281. doi:10.1111/aab.12536.
- [USDA-APHIS] United States Department of Agriculture Animal and Plant Health Inspection Service. 2013. J.R. simplot company petition (13-022-01p) for determination of non-regulated status of low acrylamide potential and reduced black spot bruise potato events F10, F37, E12, E24, J3, J78, G11, H37, and H50: plant pest risk assessment. Riverdale Park (MD): USDA-APHIS.
- [USDA-APHIS] United States Department of Agriculture Animal and Plant Health Inspection Service. 2014. J.R. simplot company petition (14-093-01p) for determination of nonregulated status for innateTM potatoes with late blight resistance, low acrylamide potential, reduced black spot and lowered reducing sugars: russet burbank event W8. Riverdale Park (MD): USDA-APHIS.
- Rommens CM, Yan H, Swords K, Richael C, Ye J. 2008. Low-acrylamide French fries and potato chips. Plant Biotech J. 6:843–853. doi:10.1111/j.1467-7652.2008.00363.x.
- Shepherd LVT, Bradshaw JE, Dale MFB, McNicol JW, Pont SDA, Mottram DS, Davies HV. 2010. Variation in acrylamide producing potential in potato: segregation of the trait in a breeding population. Food Chem. 123:568–573. doi:10.1016/j.foodchem.2010.04.070.
- Stadler RH, Blank I, Varga N, Robert F, Hau J, Guy PA, Robert M-C, Riediker S. 2002. Acrylamide from Maillard reaction products. Nature. 419:449–450. doi:10.1038/419449a.
- Tareke E, Rydberg P, Karlsson P, Eriksson S, Törnqvist M. 2002. Analysis of acrylamide, a carcinogen formed in heated foodstuffs. J Agric Food Chem. 50:4998–5006. doi:10.1021/jf020302f.
- Wiberley-Bradford AE, Bethke PC. 2018. Suppression of the vacuolar invertase gene delays senescent sweetening in chipping potatoes. J Sci Food Agric. 98:354–360. doi:10.1002/jsfa.8478.
- Zhivagui M, Ng AWT, Ardin M, Churchwell MI, Pandey M, Renard C, Villar S, Cahais V, Robitaille A, Bouaoun L, et al. 2019. Experimental and pan-cancer genome analyses reveal widespread contribution of acrylamide exposure to carcinogenesis in humans. Genome Res. 29:521–531. doi:10.1101/gr.242453.118.
- Zhu XB, Richael C, Chamberlain P, Busse JS, Bussan AJ, Jiang JM, Bethke PC. 2014. Vacuolar invertase gene silencing in potato (Solanum tuberosum L.) improves processing quality by decreasing the frequency of sugar-end defects. PLoS ONE. 9:e93381. doi:10.1371/journal.pone.0093381.
- Zyzak DV, Sanders RA, Stojanovic M, Tallmadge DH, Eberhart BL, Ewald DK, Gruber DC, Morsch TR, Strothers MA, Rizzi GP, et al. 2003. Acrylamide formation mechanism in heated foods. J Agric Food Chem. 51:4782–4787. doi:10.1021/jf034180i.