
ABSTRACT
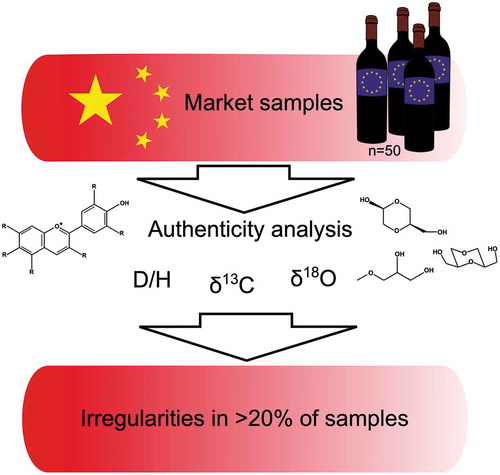
The international wine market has been repeatedly hit by cases of fraud in recent decades. While several studies attested a special vulnerability of the fast growing wine business in China, reports on chemical analyses of commercial wine samples are rare. We examined 50 predominantly red wines with European labelling, which were purchased on the Chinese market, for fraud-relevant parameters. More than 20% of the tested samples revealed anomalies in relation to the stable isotope ratios of D/H, 18O/16O and 13C/12C, contents of technical glycerol by-products or anthocyanin composition. These results strongly suggested watering of the wines, chaptalisation, glycerol addition or the use of non-Vitis anthocyanin sources, respectively. Some of these samples also showed suspicious spelling errors or other irregularities in the labelling, but the majority appeared genuine to the eye. Hence, this spot check demonstrates the importance of chemical authenticity analysis of market samples in order to detect fraudulent products. Moreover, we used the same sample set for an evaluation of the Chinese standard method for carbon stable isotope determination of wine ethanol in comparison to the current OIV (International Organisation of Vine and Wine) standard method. The results of a Bland-Altman analysis indicated that the methods can be applied interchangeably. As the two methods differ in their workflow and in the requested equipment, this might eventually enable more laboratories to perform 13C/12C analysis of wine and spirits.
Graphical abstract
Introduction
On 14 September 2020, the European Union (EU) and the government of the People’s Republic of China (PRC) officially signed an agreement on cooperation for the protection of geographic indications (GI), expressing their will to improve the recognition of each other’s agro-food products. The deal includes the acknowledgement of 100 of each other’s registered GIs (Press release IP/20/1602, European Commission Citation2020). With 54 GIs on the EU list referring to wines, the agreement also highlights the importance of the Chinese wine market for Europe’s wine exports.
In recent years, several reports have emphasised the wine markets’ relatively high vulnerability to fraud, typically addressing intellectual property infringement (Holmberg Citation2010; Anderson and Harada Citation2018; Shen Citation2018; Muhammad and Countryman Citation2019) rather than the actual chemical composition of wines. Yet, while some studies describe the fraud-related analysis of Chinese grape wines (Zhang et al. Citation2010; Zhao et al. Citation2010; Fan et al. Citation2018a, Citation2018b; Su et al. Citation2020), analytical data on the integrity of European wine distributed in China is rare. Just recently, Epova et al. described the strontium and lead isotopic profiles of 14 Bordeaux wine samples from China with conspicuous labelling (Epova et al. Citation2019, Citation2020) in comparison to authentic Bordeaux wines and discussed the significance of these parameters for wine authenticity analysis.
In this study, 50 samples of European labelled wine collected from the Chinese market were analysed with the aim of gaining a snapshot of the nature of current fraud practices on the Chinese wine market. To determine standard authenticity parameters, namely the stable isotope ratios of oxygen (in wine water), carbon and deuterium (both from wine ethanol), as well as the anthocyanin composition in the wines and the presence of by-products of technical glycerol, standard OIV methods (OIV Method Compendium, OIV Citation2020) were applied. When it comes to chemical analytical controls, differences in national standard methods and the consequential lack of multi-lateral acceptance of analysis results may be significant trade barriers. Method comparison experiments and international ring trials/proficiency tests are tools to achieve a higher degree of harmonisation of the quality control of intercontinental traded food products (Mao and Yan Citation2014). In order to evaluate the potential of the Chinese standard method for 13C/12C determination in wine ethanol as a possible alternative analytical strategy to the current OIV standard method, the 50 wine samples were also used for a direct comparison. Therefore, the samples were analysed in parallel in an European and a Chinese laboratory following the official OIV protocol OIV-MA-AS312-06 and the Chinese standard QBT 5164–2017 13C/12C of ethanol in liquor, respectively. The analysis of a higher number of samples compared to a classical inter-laboratory ring trial allowed us to look for systematic differences between the two measurements and also to apply Bland–Altman analysis to test the overall interchangeability of the two methods (Bland and Altman Citation1999; Lu et al. Citation2016).
Materials and methods
Sample composition and visual label inspection
Fifty bottles of European wines were purchased in duplicate in mainland China in autumn 2018 from various sources (supermarket, convenience stores, specialised stores and ecommerce) by an independent third-party organisation. Roughly reflecting current Chinese consumers’ preferences regarding European wine (Camillo Citation2012; Zeng and Szolnoki Citation2017), the samples mainly originated from France (33/50), followed by Spain (10/50) and Italy (4/50). Two wines were German and one was Portuguese. Most were red wines (44/50), four were white and two were rosé wines (see supplemental Table S1). Vintages (if stated) ranged from 2009 to 2017, with 60% harvested over the years 2014 (9/50), 2015 (8/50) and 2016 (13/50). With a purchase price range between 12 RMB to 238 RMB per 0.75 L bottle (median at 98 RMB, about €12), an economically accessible wine category was sampled that also appeals to the more regular wine consumer who buys wine not only for special occasions or as a gift.
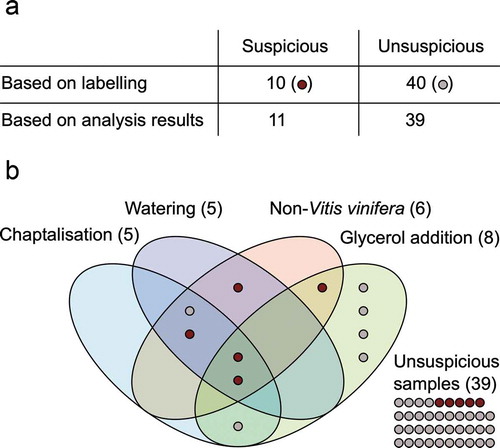
Besides orientation towards general consumer preferences, the wines were selected randomly. However, six wines (12%) were specifically chosen for analysis because of their apparent unusual labelling. Upon further inspection for irregularities of the labels, capsules and corks, a total of 10 wine samples became categorised as suspicious based solely on their appearance (see supplemental Table S1 and , these samples are marked as dark red dots). Criteria included spelling mistakes, especially those indicating a general lack of knowledge of the European language used, wrongly located wineries or other geographic inconsistencies. Red flags were also assigned when the vintage year was inconsistent with other dates (e.g., with registration number on German wines or fill date on Chinese back label), award stickers on wines were not included in the award winners list or when barcodes or Quick Response (QR) codes directed to a different wine. We also considered extensive deficiencies in legally required details or the absence of specially regulated elements of the label such as banderoles to be suspicious indications.
Figure 1. Fraud related irregularities detected in 50 European labelled wine samples from the Chinese market. (a): Distribution of suspect samples based on label, bottle, cork and capsule inspection and based on chemical analysis of the wines. (b): Venn diagram of types of fraud distribution based on analysis results. Depicted frauds include chaptalisation, watering, use of a non-Vitis vinifera anthocyanin source and the addition of technical glycerol. Criteria for the allocation of the samples to the respective fraud categories are given in the text. 39 samples were unsuspicious based on the performed analytical tests. Samples with irregular visuals are marked as dark red dots
Analytical methods
The analysis of the by-products of technical glycerol in wine, 3-methoxypropane-1,2-diol (3-MPD) and cyclic diglycerols (CycDs, parameter calculated as a sum of six components), was conducted by GC/MS according to the OIV Method OIV-MA-AS315-15, using the same analytical materials, equipment and conditions as described therein. Limits of quantification were calculated according to OIV resolution OENO 7–2000 (OIV-MA-AS1-10, “hmax method”).
Determination of the anthocyanin pattern by HPLC analysis was performed according to OIV-MA-AS315-11: The nine anthocyanins delphinidin-3-glucoside, cyanidin-3-glucoside (chrysanthemin, Cy3gl), petunidin-3-glucoside, peonidin-3-glucoside, malvidin-3-glucoside (oenin, Mv3gl), peonidin-3-acetylglucoside, malvidin-3-acetylglucoside, peonidin-3-coumarylglucoside and malvidin-3-coumarylglucoside were expressed as relative amounts of their sum. Additionally, malvidin-3,5-diglucoside (malvin, Mv3,5digl) was determined from the same chromatogram using an external calibration with a commercial standard (malvidin 3,5-diglucoside chloride, Carl Roth, Karlsruhe, Germany). For this analysis, the four white wine samples were excluded, as they do not contain anthocyanin pigments. An Agilent 1100 HPLC system with a binary pump and equipped with a DAD detector and column oven was used (all from the Agilent 1100 series, Agilent Technologies, Santa Clara, USA). Analytes were separated on a RP18 (150 mm × 2 mm) column and a RP 18 (30 mm × 2 mm) precolumn each with 3 μm particle size (both Phenomenex, Torrance, USA). The column temperature was set at 50 °C. The mobile phase consisted of eluent A: 3% vol acetonitrile (CH3CN; LiChrosolv®, Merck, Darmstadt, Germany) and 10% vol formic acid (HCOOH, 98% −100%, Honeywell, Charlotte, USA) in ultrapure water (Milli-Q® Reference A+, Merck) and eluent B: 50% vol CH3CN and 10% vol HCOOH in ultrapure water. The elution programme had 100% A and 0% B isocratic for 5 min, followed by a linear gradient to 85% A at 20 min and 55% A at 50 min. Eluent A was then increased to 100% at 51 min and the column was preconditioned for the next run. The flow rate was constant at 0.3 mL min−1. Analytes were detected at λ = 518 nm. Execution of analysis, peak picking and calculations were performed following the OIV protocol.
The D/H ratios of wine ethanol were determined by site-specific natural isotope fractionation nuclear magnetic resonance (SNIF-NMR) according to OIV-MA-AS311-05. Prior to NMR analysis, the wine ethanol was extracted from the wine samples by distillation on an Automated Distillation Control System (ADCS, Eurofins, France), which largely avoids isotopic fractionation. The alcoholic strength of the distillate was determined in % by mass with the electric density metre DMA™ 4500 M (Anton Paar, Graz, Austria) as described in OIV-MA-BS-04. After the addition to each distillate of the internal standard N,N-tetramethylurea with known D/H ratio (TMU, Joint Research Centre, JRC, Geel, Belgium) and hexafluorobenzene (lock substance, NMR grade, Sigma Aldrich, St. Louis, USA), the samples were analysed with a Bruker Ascend™ 400 MHz NMR Spectrometer (Bruker, Billerica, USA) equipped with a 10 mm SEX 1 H/D probe with 19F lock. Details for sample preparation, sample handling and the conditions for the recording of the 2H NMR spectra of ethanol are given in OIV-MA-AS311-05. Based on the heights of the two ethanol signals that represent methyl and methylene group deuterium, the height of the TMU signal, the TMU D to H ratio, the sample’s alcoholic strength as well as sample and standard masses, the parameters (D/H)I, (D/H)II and ‘R’ were calculated for each sample (see OIV-MA-AS311-05 for calculation formulas). (D/H)I and (D/H)II were expressed in ppm as means of 10 repetitive NMR measurements.
The 13C/12C values in wine ethanol were determined by laboratory 1 (Lab1) based on OIV-MA-AS312-06 (principle and calculations) via Liquid-EA-IRMS. As samples, ethanol distillates obtained from SNIF-NMR sample preparation were used. The ethanol carbon was oxidised completely to CO2 and the mass signal intensities of the three heavier and lighter CO2 molecules were determined by IRMS. The system consisted of a NCS combustion analyser and a 20–22 Isotope Ratio Mass Spectrometer (both Sercon, Crewe, UK) with a triple collector to simultaneously measure m/z = 44, 45 and 46. The isotopic ratio of 13C/12C of ethanol was reported as δ13C relative to the international standard Vienna Pee Dee Belemnite (V-PDB, calculations according to OIV-MA-AS312-06). As reference alcohol and for quality control, a laboratory internal control sample calibrated to the commercially available certified standard BCR-656 absolute alcohol with a certified δ13C value of −26.91 ‰ V-PDB (JRC, Geel, Belgium), was used.
Laboratory 2 (Lab2) determined the 13C/12C values in wine ethanol of their sample set based on the Chinese standard method QB/T 5164–2017 13C/12C of ethanol in liquor that was established by CNRIFFI. In principle, the ethanol was separated from the wine matrix and further analysed by GC-C-IRMS.
The sample solution was made by 70 μL wine (approx. 12% vol) diluted with 1.0 mL acetone (HPLC grade). A 1.0 μL aliquot of sample solution was injected into a CP wax column (50 m × 0.32 mm × 0.20 μm), in split mode (1:20). Helium was used as the carrier gas at a flow rate of 1.0 mL min−1. The injector temperature was set to 200 °C. The temperature programme was set as follows: 40 °C for 5 min, 40 °C to 50 °C at 1 °C min−1, and hold for 1 min, 50 °C to 200 °C at 15 °C min−1, hold at the final value of 200 °C for 2 min. Each run took 14 min, not including the necessary cooling time.
The separation of the ethanol was conducted using the backflush function of the GC-C-IRMS system. Non-ethanol molecules were not transferred into the combustion tube of GC-C-IRMS but vented. When the ethanol peak exited the column, the backflush function was closed. The ethanol molecules were transferred into the combustion tube and oxidised into CO2. Finally, CO2 was transferred into the IRMS within the helium carrier gas and the mass signal intensities m/z = 44, 45 and 46 were used to determine δ13C as described above.
The 18O/16O ratio of wine water was determined following OIV-MA-AS2-12. After 18 h equilibration of the water phase with gaseous CO2 (1.0–1.5% CO2 in helium), the CO2 was used for analysis by GC/IRMS. The analysis was performed on a GasBench II IRMS System (FinniganMAT, today part of Thermo Fisher Scientific, Waltham, MA, USA) with two Nafion™ tubes for moisture depletion and dual continuous flow inlet for the dried sample and reference gases. A triple collector simultaneously detected the ionic currents of m/z = 44, 45 and 46. As reference, the laboratory’s own standard water calibrated to the standards V-SMOW (Vienna Standard Mean Ocean Water; International Atomic Energy Agency IAEA) and SLAP (Standard Light Antarctic Precipitation, IAEA) was used. The 18O/16O ratio was expressed in relation to V-SMOW as δ18O ‰ V-SMOW (calculations according to OIV-MA-AS2-12).
Data acquisition and processing
Data were analysed using R-Studio version 1.2.1335 (RStudio Team Citation2018) for calculations and basic plotting. The blandr package (Datta Citation2017) was used for the Bland–Altman analysis of the two δ13C methods. The sample number of 50 was confirmed as sufficiently high for the respective Bland–Altman analysis using the SciStat® web application (MedCalc Software Ltd Citation2020), which is based on the minimal sample size calculation method by Lu et al. (Citation2016). Graphics were adjusted using the vector graphic editor Inkscape (Albert et al. Citation2010).
Results and discussion
The sample sets were analysed independently in China and Germany, applying the standard OIV methods. The analyses were performed as part of a bilateral laboratory twinning initiative in the course of the EU-China Safe Project (http://www.euchinasafe.eu/, see also acknowledgement section). For the data interpretation, only one set was used. For the 13C/12C analysis of wine ethanol, different methods were applied by the two laboratories. Both sets of results were then used to perform a method comparison.
By-products of technical glycerol indicate external glycerol addition
Glycerol is a natural component of wine that is mainly produced during the fermentation process. It is part of the so-called sugar-free extract, which is a wine quality parameter that indicates, e.g., grape ripeness. It also adds to a smoother mouthfeel by increasing the viscosity of the wine. Therefore, external addition of glycerol can mask a lesser wine quality. In contrast to naturally contained glycerol, technically produced glycerol can contain traces of the impurities 3-MPD and/or CycDs. However, a minor entry of these substances via legally added enzyme preparations is possible. Otherwise, the occurrence of technical by-products of glycerol is a clear indication for unauthorised glycerol addition (Lampe et al. Citation1997; Fauhl et al. Citation2004).
We quantified 3-MPD and/or CycDs in eight of the 50 wine samples (), supplemental Table S1, wine numbers 1, 8, 9, 10, 14, 24, 26 and 30), six of those containing both 3-MPD and CycDs. In 10 additional samples, one or both types of the analytes were detected at concentrations below the limits of quantification of 0.06 mgL−1 for 3-MPD or 0.25 mgL−1 for CycDs, respectively. Overall, in total 36% of the tested samples suggested technical glycerol adulteration, including the eight cases of clear tampering (supplemental Table S1).
In the course of their stable isotope analysis of several hundred imported and Chinese wines, Wu et al. (Citation2019) also stated suspicion of frequent glycerol addition. They described unexpectedly high glycerol δ13C values that also did not correlate to the δ13C values of the corresponding wine ethanol. As grape glycerol usually is characterised by more negative δ13C values in comparison to non-plant glycerol sources, these results suggested the use of glycerol of industrial or animal origin (Rossmann et al. Citation1998). Although there was no confirmatory analysis for technical glycerol by-products in this case, we consider based on our data that the problem may be widespread on the Chinese market specifically for wines marketed as imports. In recent years, applicable Chinese trade regulations might also have suggested the practice of glycerol addition as wines were reportedly rejected from import to China because of low sugar-free extract (Wu Citation2015). This contrasts the current situation on the European wine market, where technical glycerol addition incidents have decreased drastically since the introduction of the described detection method by Lampe et al. (Citation1997) and are rarely a cause for concern nowadays.
Unusual anthocyanin composition reveals non-Vitis vinifera wines
The amount and composition of anthocyanins define the colour of a red or rosé wine and are generally characteristic for the used grape variety. However, authentication of the claimed variety by anthocyanin spectra profiling can be difficult, especially if more than one grape variety has been used for wine production, which is regularly the case. Under EU wine legislation, even when a sole variety is claimed, the wine may originate from other grapes at a proportion of just under 15% (Regulation (EU) No 1308/2013 supplemented by Commission Delegated Regulation (EU) 2019/33). Of the 50 wine samples, half lacked grape variety information and only one Spanish wine claimed to be made 100% of one variety (Cabernet Sauvignon).
Unexpectedly, the majority of the 46 red and rosé wine samples, including the younger vintages, were visually characterised by brownish tones and showed an overall low concentration of free anthocyanin monomers. In many samples, only two to five of the nine anthocyanins described in OIV-MA-AS315-11 were detected (supplemental Table S2), leading to possibly inconclusive anthocyanin patterns. Likely, the wines were affected by improper treatment during storage or transport, such as the multi-week shipment between continents. High-temperature fluctuations accelerate wine ageing and subsequent colour changes (Butzke et al. Citation2012; Atkin and Cholette Citation2017). Under these conditions, variety determination via the anthocyanin spectra as suggested by Holbach et al. (Citation1997) and as described in the respective OIV method is vague and therefore unsuitable.
However, the parameters could be used to distinguish between Vitis vinifera, which is the only Vitis species that can legally be used in the EU to make wine, and local non-Vitis vinifera or hybrid species, which are, e.g., specific for winemaking in China or on the American continent. To make this distinction, we looked specifically at three anthocyanins: Cy3gl, Mv3gl and Mv3,5digl. Mv3gl is, with the very few exceptions of some table grape varieties, the predominant anthocyanin in Vitis vinifera wines, while Cy3gl is generally considered a minor component of at maximum 5% of the total anthocyanins (Fernández-López et al. Citation1998; García-Beneytez et al. Citation2002; Jackson Citation2014a). Hence, the ratio of Cy3gl/Mv3gl in Vitis vinifera derived wines is characteristically << 1. This ratio should roughly remain constant regardless of wine age and storage, as Cy3gl should remain at very low concentrations or even disappear below the detection limit over time, whereas Mv3gl is known to be more stable to disappearance (e.g., due to adsorption, formation of anthocyanin-derived pigments or oxidative degradation) compared to other unsubstituted anthocyanins. The main reason for that appears to be lack of oxidation-promoting ortho-positioned hydroxyl groups in the Mv3gl molecule structure (Robinson et al. Citation1966; Sarni et al. Citation1995; Yokotsuka and Singleton Citation1997; Kim et al. Citation2010; Durner Citation2016).
While for the majority of the 50 wine samples the Cy3gl/Mv3gl ratio was expectedly very low, six samples stood out with a completely reversed anthocyanin composition (supplemental Table S1, wine numbers 1, 9, 15, 24, 27 and 45). Here, the Cy3gl/Mv3gl ratio ranged from 1.2 up to 352.1. In the latter sample, Cy3gl was the predominant of all nine determined anthocyanins. Additionally, five of those six samples also contained significant amounts of Mv3,5digl (range between 16 mgL−1 and 83 mgL−1, supplemental Table S1). The diglycoside is typically present in most non-Vitis vinifera or hybrid grape varieties (Acevedo De la Cruz et al. Citation2012; De Rosso et al. Citation2012; Kontić et al. Citation2016).
Low Mv3gl has been linked to wine adulteration before (Geana et al. Citation2016), and high Cy3gl and Mv3,5digl are not typical for legitimate EU wine. We therefore assume that these six wines are either not Vitis vinifera-derived or additionally contain other, non-grape anthocyanin sources (). Sambucus species (elderberry) and a variety of wild and cultivated berries are high in cyanidin 3-O-monoglycosides (Mikulic-Petkovsek et al. Citation2014; Veberic et al. Citation2015) and juices or extracts thereof may have been added to the wine or must to enhance the colour and probably add a fruity flavour. Elderberry juice has been described as a historic adulterant of wine, mainly of port wine (Saller and De Stefani Citation1960; Jackson Citation2014b; Sechrist Citation2017).
Stable isotope analysis of hydrogen, oxygen and carbon hint to chaptalisation and watering
Unlike the wine phenol composition, the stable isotope ratios of wine are expected to remain constant over time. Hydrogen, oxygen and carbon stable isotope ratios in wine are used for the identification of a number of frauds, namely the use of external alcohol, chaptalisation with beet or cane sugar, watering, or false claims on the origin of a wine. Although there are general decision limits for European wines published for some single stable isotope parameters, they need to be evaluated in combination to achieve valid conclusions. This is even more the case when there is no reliable set of reference wines of each sample origin and vintage available.
Chaptalisation
The addition of dry sucrose to must in order to enhance the alcoholic strength of a wine is strictly regulated in the EU. Basically, authorisation is tied to unfavourable climatic conditions and is also limited in quantity in relation to the respective wine-growing zone. However, it is prohibited in southern Europe, including the south of France and also in Bordeaux (REGULATION (EU) No 1308/2013). To identify chaptalised wines, the 13C/12C ratio, expressed as δ13C, and the alkyl D/H values of the wine ethanol are relevant parameters.
The δ13C values of ethanol vary based on the photosynthesis type of the sugar-producing plant (C3, C4 or CAM) because the biochemical pathway of carbon assimilation affects the level of heavy isotope discrimination. The addition of other, non-grape, C3 sugars (e.g. beet sugar) basically does not affect the wine ethanol δ13C value. However, it is increased to less negative values by enrichment with C4 sugar, such as cane sugar. For European wine, δ13C usually ranges between −30 ‰ V-PDB and −24 ‰ V-PDB (reviewed in Christoph et al. Citation2003, Citation2015), with a decision limit for cane sugar addition marked at −22 ‰ V-PDB. For the 50 European wine samples from China, values ranged from −28.68 ‰ V-PDB to −22.29 ‰ V-PDB, so no sample was above that limit (supplemental Table S1). However, −22.29 ‰ V-PDB is remarkably high for a European wine.
(D/H)I values also represent the type of sugar that was present in the must before fermentation while (D/H)II mirrors climate and regional aspects of a wine (Martin et al. Citation1988). For (D/H)I, European wines usually range between 98 ppm and 105 ppm (Christoph et al. Citation2003, Citation2006). Lower levels indicate chaptalisation with a C3 plant sugar, e.g., from sugar beets, while values above that range indicate the addition of cane or other C4 sugars. For the 50 European wines, the (D/H)I values ranged between 96.7 ppm and 104.3 ppm. Two of these samples showed (D/H)I values below 98 ppm and two others were only slightly higher at 98.0 ppm and 98.1 ppm (supplemental Table S1). These four samples therefore were at least borderline suspect for C3 sugar addition based on their (D/H)I values.
The R value is defined as 2(D/H)II/(D/H)I and thus takes the distribution of the deuterium content in the methylene and the methyl group of the ethanol molecule into account. For grape sugar-derived ethanol, this parameter usually ranges between 2.4 and 2.55. The addition of beet sugar increases R, addition of cane sugar lowers it (Christoph et al. Citation2003; Perini and Camin Citation2013). In our dataset, R ranged from 2.39 to 2.64 (supplemental Table S1).
In a combined approach, the three parameters were put into context to identify chaptalised wines among the samples: Wines were assigned to be most probably enriched with beet sugar when their analysis resulted in grape typical δ13C (−30 ‰ V-PDB to −24 ‰ V-PDB), a high R value (R > 2.55) plus an untypically low (D/H)I value. Depending of the region of origin, a low (D/H)I was set at (D/H)I < 99 ppm for southern European wine or (D/H)I < 97 ppm for central European wine or wine of uncertain origin (labelled as wines from the European Union, French: VCE, Vins de la Communauté Européenne). Samples with a high δ13C value (δ13C > −23 ‰ V-PDB) plus a low R value (R < 2.4) were assigned to be enriched with cane sugar.
Based on that, five samples were indicated to be highly suspicious for chaptalisation (supplemental Table S1, wine numbers 9, 14, 24, 27 and 45), one of them with cane sugar and four presumably with beet sugar. However, the latter four samples showed also non-Vitis vinifera anthocyanin compositions (). Therefore, the added sugar source may also be juice or extract of another C3 fruit.
Watering
The δ18O values of wine water were determined in all 50 samples to scan for possible water addition. In general, wine that has been diluted by tap water shows decreased δ18O values due to discrimination against the heavier isotopes in the plants during evapotranspiration. The parameter is very susceptible to meteorological conditions and therefore may fluctuate significantly from one vintage to another (Rossmann et al. Citation1999). Still, there is a consensus that δ18O in wine water in southern Europe typically does not fall below −2 ‰ V-SMOW. In colder and generally more humid central Europe, wines usually do not show δ18O values below −5 ‰ V-SMOW (Rossmann et al. Citation1999; Camin et al. Citation2015; Christoph et al. Citation2015; Geana et al. Citation2016). The European labelled wines from China ranged between δ18O −6.1 ‰ V-SMOW and 8.7 ‰ V-SMOW. Five samples that were all labelled as French wines showed δ18O values below −2 ‰ V-SMOW, two of them were below −5 ‰ V-SMOW (supplemental Table S1, wine numbers 9, 15, 24, 27 and 45).
For watering evaluation, we also considered the (D/H)II values of the respective samples. In authentic wines, the D/H values of wine ethanol correlate positively to δ18O in wine water (Wachter et al. Citation2009; Camin et al. Citation2015). The (D/H)II value of European wine typically ranges between 121 ppm and 132 ppm, with southern European wines generally above 125 ppm (Christoph et al. Citation2015). The five suspect samples from the δ18O analyses all had (D/H)II values above the 125 ppm mark. As the low δ18O values are therefore contradicted by the normal to high (D/H)II values, we consider these wines as diluted with non-plant water. Moreover, watering suspicions of these samples were paralleled by an off anthocyanin pattern including low Mv3gl percentage and in four cases also contained non-grape sugar (). These wines appear to be highly artificially modified.
However, we want to point out that especially for wines drawn from the Chinese market, there may be an additional explanation for untypically low δ18O values. Due to many vine planting regions being located in high altitudes and other geometeorological factors, δ18O values of Chinese wines are often relatively low compared to southern European δ18O wine water values (Jiang et al. Citation2015; Fan et al. Citation2018b; Wu et al. Citation2019). Similar to wines from, e.g., Argentina, wine water with negative δ18O values or even below −2 ‰ V-SMOW are genuine for many wines produced in China.
Similar to tap water addition, the use or admixture of falsely labelled local wine could therefore also lead to off δ18O values, most likely accompanied by ambiguous D/H values of ethanol.
δ13C analysis comparison
The δ13C analysis was performed applying the Chinese standard method QBT 5164–2017 13C/12C of ethanol in liquor and the OIV method OIV-MA-AS312-06. Differences in the workflows of the two methods are summarised in . For the OIV method, the ethanol distillate prepared also for SNIF NMR analysis (see Analytical methods) was used as the sample. The Chinese standard instead used 70 µL wine sample (10% vol) diluted with 1 mL acetone and did not require a distillation pretreatment. The prepared samples were analysed by GC-C-IRMS directly. Taking the distillation step of the OIV method into account, when analysing δ13C only, the Chinese standard saved about 3 hours compared to the established OIV method.
Table 1. δ13C analysis comparison of Chinese standard method QB/T 5164–2017 and OIV method OIV-MA-AS312-06
To evaluate whether the two methods are equally applicable to determine δ13C in wine ethanol, we compared the two sets of results (one of Lab1 and one of Lab2, see supplemental Table S1). The correlation of the two measurements was naturally strong and highly statistically significant (Pearson’s correlation r = 0.9881, n = 50, p-value < 2.2e−16), as it is expected when measuring the same samples. Visually, the results scatter closely around the bisector (red line), which represents equality of the two measurements (). Linear regression (black line) crosses the bisector in-between the results area (at Lab1 = −25.63 ‰ = Lab2), showing no consistent bias between the two measurement across the value range, as a parallel regression line would indicate.
Figure 2. Comparison of two methods for δ13C determination in wine ethanol. Lab1 applied OIV-MA-E-AS312-06 and Lab2 the Chinese standard QBT 5164-2017. (a): Scatter plot of the results of Lab1 plotted against Lab2. Red line: Bisector. Black line: Linear regression. Linear regression equation: Lab2 = 0.9610 × Lab1 - 0.9996, n = 50. (b): Bland-Altman comparison. The zero line at Lab2 - Lab1 = 0 is marked in red. Dotted lines indicate the ULoA, bias and LLoA while the fine dotted lines mark their respective confidence intervals (95%). Number of comparisons: 50. Abbreviations are explained in the text
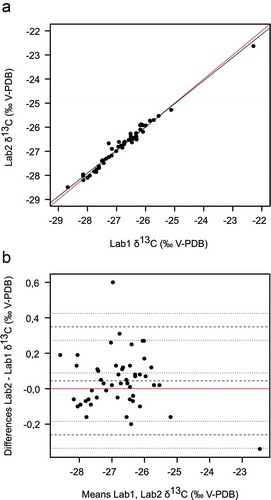
The overall bias between the sets of results was evaluated using a Bland-Altman plot (), Bland and Altman Citation1999). The mean difference between the methods (bias) was +0.04 ‰ (0.00 ‰ to 0.09 ‰, 95% confidence interval CI), with the upper limit of agreement (ULoA) at +0.35 ‰ (0.27 ‰ to 0.42 ‰, 95% CI) and the lower limit of agreement (LLoA) at −0.26 ‰ (−0.34 ‰ to −0.18 ‰, 95% CI). Accordingly, Lab2 measured a mean of 0.04 ‰ higher δ13C values for the same sample compared to Lab1. With the zero line just inside the confidence interval of the bias, the two measurements and thus the two methods were for the given sample set statistically interchangeable.
Single differences ranged between −0.34 ‰ and 0.60 ‰, with one outlier (outside the limits of agreements CI) at 0.60 ‰ (, supplemental Table S1, wine number 18). To assess whether these differences between the two methods were sufficiently low not only statically but are also justifiable in the analytical context, Lab2 - Lab1 values were compared to the reproducibility limit ‘R’ (as described in OIV-MA-AS1-09: R2000, not to be confused with the SNIF-NMR parameter ‘R’ mentioned earlier in text). Using the same method, the difference between laboratory results should not be greater than R, which is given in OIV-MA-AS312-06 at ± 0.6 ‰ V-PDB. All differences including the outlier were in that range and the bias was well below that limit.
By this comprehensive comparison of the two measurements, it was shown that the Chinese standard method QBT 5164–2017 13C/12C of ethanol in liquor and the OIV method OIV-MA-AS312-06 perform equally in terms of trueness. For a long-term assessment, however, the Chinese standard method should repeatedly be tested to prove its reliability in practice in international multi-laboratory ring trials.
Conclusion and future prospects
Fifty European labelled wines from the Chinese market were tested for their authenticity applying official, validated methods. We focused on glycerol addition, authentic anthocyanin composition, watering and chaptalisation. The broad variety of assigned sample origins and vintages and the lack of an adequate comparison dataset required a conservative interpretation of the stable isotope results. However, the comparison to published reference and recommendations for cut-off levels was straightforward and solid indications for fraud could be drawn. To sum up, eleven wines were classified as fraudulent based on the performed chemical analyses, although only five of them had raised suspicion due to labelling beforehand. Six samples showed more than one type of chemical fraud. The most common objection was adulteration by addition of technical glycerol. Especially two wines that showed severe discrepancies in all performed analyses cannot be dispelled from the suspicion to be completely artificial wines.
All suspect wines with regard to stable isotope and anthocyanin analysis as well as five of the technical glycerol contaminated wines were designated French wines. Our study results are therefore consistent with the observation that French wines have been highly targeted by fraudsters for years (Muhammad and Countryman Citation2019). In recent years, French wines have been the most popular European foreign wines consumed in China. However, it should be considered that criminal trends continuously adapt to customers’ changing favourites. Also, the true origin of tampered or faked wine samples, the EU, China or a different location, is impossible to deduce from the available data alone.
The primary aim of this study was to get an idea what may currently be widespread problems of wine authenticity in China. Given the size of the Chinese wine market for EU imports, which before the COVID-19 pandemic exceeded 250 million litres annually (United Nations Citation2021), this 50 sample analysis certainly cannot be representative. However, by identifying what is presumably only the tip of the iceberg, these data provide the intended spot check to initiate further analytical controls. Chemical authenticity analysis should ideally complement the visual inspection of the wine labels. The addition of technical glycerol might currently be an especially relevant wine fraud in practice for European labelled wines in China.
We also established that the two methods OIV-MA-AS312-06 and QBT 5164–2017 are interchangeably applicable to determine δ13C of wine ethanol. The Chinese method is particularly interesting for laboratories that do not do SNIF-NMR analysis of wine as well. We recommend a long-term assessment of the validity and comparability of the two methods in ongoing ring trials.
Supplemental Material
Download MS Word (19.7 KB)Supplemental Material
Download MS Word (41.4 KB)Acknowledgments
The authors would like to thank Werner Blaas, Barbara Brakowiecka-Sassy and Stephanie Panitz (BfR) for their technical assistance and comments on the manuscript. We thank Hongbo Gao, Guanghao Wang (CNRIFFI) as well as Rui Feng and Ming Ma (Ningbo Quarantine & Inspection Science and Technology Academic, NQISTA) for participating in the lab twinning activities and measurements of the wine samples.
Supplementary material
Supplemental data for this article can be accessed on the publisher’s website
Additional information
Funding
References
- Acevedo De la Cruz A, Hilbert G, Rivière C, Mengin V, Ollat N, Bordenave L, Decroocq S, Delaunay J-C, Delrot S, Mérillon J-M, et al. 2012. Anthocyanin identification and composition of wild Vitis spp. accessions by using LC–MS and LC–NMR. Anal Chim Acta. 732:145–152. doi:10.1016/j.aca.2011.11.060.
- Albert M, Andler J, Bah T, Barbry-Blot P, Barraud J-F, Baxter B, Beard J, Bintz J, Biro A, Bishop N, et al. 2010. Inkscape 0.48.4. https://inkscapeorg/.
- Anderson K, Harada K. 2018. How much wine is really produced and consumed in China, Hong Kong, and Japan? J Wine Econ. 13(2):199–220. doi:10.1017/jwe.2018.13.
- Atkin T, Cholette S. 2017. Chapter 12, Rough seas ahead: quality concerns for China-bound wine shipments. In: Capitello R, Charters S, Menival D, editors. The wine value chain in China. Cambridge (MA): Chandos Publishing; p. 187–205.
- Bland JM, Altman DG. 1999. Measuring agreement in method comparison studies. Stat Methods Med Res. 8(2):135–160. doi:10.1177/096228029900800204.
- Butzke C, Vogt E, Chacón-Rodríguez L. 2012. Effects of heat exposure on wine quality during transport and storage. J Wine Res. 23:15–25. doi:10.1080/09571264.2011.646254.
- Camillo AA. 2012. A strategic investigation of the determinants of wine consumption in China. Int J Wine Bus Res. 24(1):68–92. doi:10.1108/17511061211213792.
- Camin F, Dordevic N, Wehrens R, Neteler M, Delucchi L, Postma G, Buydens L. 2015. Climatic and geographical dependence of the H, C and O stable isotope ratios of Italian wine. Anal Chim Acta. 853:384–390. doi:10.1016/j.aca.2014.09.049.
- Christoph N, Hermann A, Wachter H. 2015. 25 Years authentication of wine with stable isotope analysis in the European Union – review and outlook. BIO Web Conf. 5:02020. doi:10.1051/bioconf/20150502020.
- Christoph N, Rossmann A, Schlicht C, Voerkelius S. 2006. Wine authentication using stable isotope ratio analysis: Significance of geographic origin, climate, and viticultural parameters. Auth Food & Wine, Am Chem Soc. 952:166–179. doi:10.1021/bk-2007-0952.ch011.
- Christoph N, Rossmann A, Voerkelius S. 2003. Possibilities and limitations of wine authentication using stable isotope and meteorological data, data banks and statistical tests. Part 1: wines from Franconia and Lake Constance 1992 to 2001. Mitt Klosterneuburg. 53:23–40.
- Datta D. 2017. blandr: a Bland-Altman method comparison package for R. Zenodo. doi:10.5281/zenodo.824514.
- De Rosso M, Tonidandel L, Larcher R, Nicolini G, Ruggeri V, Dalla Vedova A, De Marchi F, Gardiman M, Flamini R. 2012. Study of anthocyanic profiles of twenty-one hybrid grape varieties by liquid chromatography and precursor-ion mass spectrometry. Anal Chim Acta. 732:120–129. doi:10.1016/j.aca.2011.10.045.
- Durner D. 2016. Chapter 12, Improvement and stabilization of red wine color. In: Carle R, Schweiggert RM, editors. Handbook on natural pigments in food and beverages. Duxford (UK): Woodhead Publishing; p. 239–264.
- Epova EN, Bérail S, Séby F, Barre JPG, Vacchina V, Médina B, Sarthou L, Donard OFX. 2020. Potential of lead elemental and isotopic signatures for authenticity and geographical origin of Bordeaux wines. Food Chem. 303:125277. doi:10.1016/j.foodchem.2019.125277.
- Epova EN, Bérail S, Séby F, Vacchina V, Bareille G, Médina B, Sarthou L, Donard OFX. 2019. Strontium elemental and isotopic signatures of Bordeaux wines for authenticity and geographical origin assessment. Food Chem. 294:35–45. doi:10.1016/j.foodchem.2019.04.068.
- European Commission (EC). 2020. EU and China sign landmark agreement protecting European Geographical Indications. IP/20/1602. Brussels (Belgium).
- Fan S, Zhong Q, Fauhl-Hassek C, Pfister MKH, Horn B, Huang Z. 2018a. Classification of Chinese wine varieties using 1H NMR spectroscopy combined with multivariate statistical analysis. Food Control. 88:113–122. doi:10.1016/j.foodcont.2017.11.002.
- Fan S, Zhong Q, Gao H, Wang D, Li G, Huang Z. 2018b. Elemental profile and oxygen isotope ratio (δ18O) for verifying the geographical origin of Chinese wines. J Foo Drug Anal. 26(3):1033–1044. doi:10.1016/j.jfda.2017.12.009.
- Fauhl C, Wittkowski R, Lofthouse J, Hird S, Brereton P, Versini G, Lees M, Guillou C. 2004. Gas chromatographic/mass spectrometric determination of 3-methoxy-1,2-propanediol and cyclic diglycerols, by-products of technical glycerol, in wine: interlaboratory study. J AOAC Int. 87(5):1179–1188.
- Fernández-López J, Almela L, Muñoz JA, Hidalgo V, Carreño J. 1998. Dependence between colour and individual anthocyanin content in ripening grapes. Food Res Int. 31:667–672. doi:10.1016/S0963-9969(99)00043-5.
- García-Beneytez E, Revilla E, Cabello F. 2002. Anthocyanin pattern of several red grape cultivars and wines made from them. Eur Food Res Technol. 215:32–37. doi:10.1007/s00217-002-0526-x.
- Geana EI, Popescu R, Costinel D, Dinca OR, Stefanescu I, Ionete RE, Bala C. 2016. Verifying the red wines adulteration through isotopic and chromatographic investigations coupled with multivariate statistic interpretation of the data. Food Control. 62:1–9. doi:10.1016/j.foodcont.2015.10.003.
- Holbach B, Marx R, Ackermann M. 1997. Bestimmung der Anthocyanzusammensetzung von Rotwein mittels Hochdruckflüssigkeitschromatographie (HPLC). Lebensmittelchemie. 51:78–80. German.
- Holmberg L. 2010. Wine fraud. Int J Wine Res. 2:105–113. doi:10.2147/IJWR.S14102.
- Jackson RS. 2014a. Chapter 6, chemical constituents of grapes and wine. In: Jackson RS, editor. Wine science. 4th ed. San Diego (CA): Academic Press; p. 347–426.
- Jackson RS. 2014b. Chapter 10, wine laws, authentication and geography. In: Jackson RS, editor. Wine science. 4th ed. San Diego (CA): Academic Press; p. 761–829.
- Jiang W, Xue J, Liu X, Wang D, Guo Y, Wang L. 2015. The application of SNIF‐NMR and IRMS combined with C, H and O isotopes for detecting the geographical origin of Chinese wines. Int J Food Sci Technol. 50(3):774–781. doi:10.1111/ijfs.12686.
- Kim M, Yoon SH, Jung M, Choe E. 2010. Stability of meoru (Vitis coignetiea) anthocyanins under photochemically produced singlet oxygen by riboflavin. N Biotechnol. 27(4):435–439. doi:10.1016/j.nbt.2010.01.003.
- Kontić JK, Jelušić IR, Tomaz I, Preiner D, Marković Z, Stupić D, Ž A, Maletić E. 2016. Polyphenolic composition of the berry skin of six fungus-resistant red grapevine varieties. Int J Food Prop. 19(8):1809–1824. doi:10.1080/10942912.2015.1107844.
- Lampe U, Kreisel A, Burkhard A, Bebiolka H, Brzezina T, Dunkel K. 1997. Method for detection of added industrial glycerol in wine. Deutsche Lebensmittel-Rundschau. 93(4):103–110.
- Lu MJ, Zhong WH, Liu YX, Miao HZ, Li YC, Ji MH. 2016. Sample size for assessing agreement between two methods of measurement by Bland-Altman method. Int J Biostat. 12(2). doi:10.1515/ijb-2015-0039.
- Mao Y, Yan L. 2014. Benefits analysis of the laboratories participation in proficiency testing programs. J Food Saf Qual. 5(9):2958–2961. Chinese.
- Martin GJ, Guillou C, Martin ML, Cabanis MT, Tep Y, Aerny J. 1988. Natural factors of isotope fractionation and the characterization of wines. J Agric Food Chem. 36(2):316–322. doi:10.1021/jf00080a019.
- MedCalc Software Ltd. SciStat® version 2.8.42. Ostend (Belgium); [ accessed 2020 Dec 11]. https://www.scistat.com.
- Mikulic-Petkovsek M, Schmitzer V, Slatnar A, Todorovic B, Veberic R, Stampar F, Ivancic A. 2014. Investigation of anthocyanin profile of four elderberry species and interspecific hybrids. J Agric Food Chem. 62(24):5573–5580. doi:10.1021/jf5011947.
- Muhammad A, Countryman AM. 2019. In Vino ‘No’ veritas: impacts of fraud on wine imports in China. Aust J Agric Resour Econ. 63:742–758. doi:10.1111/1467-8489.12333.
- [OIV] Organisation Internationale de la vigne et du vin. 2020. Compendium of international methods of wine and must analysis: OIV-MA-INT-00-2020. Vol. 1 and 2. Paris (France): International organisation of vine and wine.
- Perini M, Camin F. 2013. δ18O of ethanol in wine and spirits for authentication purposes. 78(6):C839–C844. doi:10.1111/1750-3841.12143.
- Robinson WB, Weirs L, Bertino J, Mattick L. 1966. The relation of anthocyanin composition to color stability of New York State wines. Am J Enol Vitic. 17(3):178–184.
- Rossmann A, Reniero F, Moussa I, Schmidt H-L, Versini G, Merle M. 1999. Stable oxygen isotope content of water of EU data-bank wines from Italy, France and Germany. Zeitschrift für Lebensmitteluntersuchung und -Forschung. 208(5–6):400–407. doi:10.1007/s002170050437.
- Rossmann A, Schmidt H-L, Hermann A, Ristow R. 1998. Multielement stable isotope ratio analysis of glycerol to determine its origin in wine. Zeitschrift für Lebensmitteluntersuchung und -Forschung A. 207(3):237–243. doi:10.1007/s002170050325.
- RStudio Team. 2018. RStudio: integrated development for R. Version 1.2.1335. Boston (MA): RStudio, Inc.
- Saller W, De Stefani C. 1960. Holunderzusatz zu Traubenmost. Weinberg Keller. 7(2):45–49. German.
- Sarni P, Fulcrand H, Souillol V, Souquet J-M CV. 1995. Mechanisms of anthocyanin degradation in grape must-like model solutions. J Sci Food Agric. 69(3):385–391. doi:10.1002/jsfa.2740690317.
- Sechrist R. 2017. Planet of the grapes: a geography of wine. Santa Barbara (CA): ABC-CLIO.
- Shen A. 2018. ‘Being affluent, one drinks wine’: wine counterfeiting in Mainland China. Int J Crime Justice Social Democracy. 7:16–32. doi:10.5204/ijcjsd.v7i4.1086.
- Su Y, Gao J, Wen Z, Zhang J, Zhang A, Yuan C. 2020. Geographical origin classification of Chinese wines based on C, O stable isotopes and elemental profile. J Food Prot. doi:10.4315/JFP-19-499.
- United Nations (UN). 2021. Trade statistics dataset. Online database; [accessed 2021 Mar 25]. https://comtrade.un.org/data.
- Veberic R, Slatnar A, Bizjak J, Stampar F, Mikulic-Petkovsek M. 2015. Anthocyanin composition of different wild and cultivated berry species. LWT - Food Sci Technol. 60:509–517. doi:10.1016/j.lwt.2014.08.033.
- Wachter H, Christoph N, Seifert S. 2009. Verifying authenticity of wine by Mahalanobis distance and hypothesis testing of stable isotope pattern–a case study using the EU wine databank. Mitteilungen Klosterneuburg. 59:237–249.
- Wu H, Tian L, Chen B, Jin B, Tian B, Xie L, Rogers KM, Lin G. 2019. Verification of imported red wine origin into China using multi isotope and elemental analyses. Food Chem. 301:125137. doi:10.1016/j.foodchem.2019.125137.
- Wu S. 2015. Chinese customs rejected hundreds of ‘substandard’ imported wines in 2014. DecanterChina.com TI Media Ltd; [accessed 2020 Dec 11]. https://www.decanterchina.com/en/news/chinese-customs-rejected-hundreds-of-substandard-imported-wines-in–2014.
- Yokotsuka K, Singleton VL. 1997. Disappearance of anthocyanins as grape juice is prepared and oxidized with PPO and PPO substrates. Am J Enol Vitic. 48(1):13–25.
- Zeng L, Szolnoki G. 2017. Chapter 2, Some fundamental facts about the wine market in China. In: Capitello R, Charters S, Menival D, editors. The wine value chain in China. Cambridge (MA): Chandos Publishing; p. 15–36.
- Zhang J, Li L, Gao N, Wang D, Gao Q, Jiang S. 2010. Feature extraction and selection from volatile compounds for analytical classification of Chinese red wines from different varieties. Anal Chim Acta. 662(2):137–142. doi:10.1016/j.aca.2009.12.043.
- Zhao Q, Duan C-Q, Wang J. 2010. Anthocyanins profile of grape berries of Vitis amurensis, its hybrids and their wines. Int J Mol Sci. 11(5):2212–2228. doi:10.3390/ijms11052212.