
ABSTRACT
The idea that previously unknown hazards can be readily revealed in complex mixtures such as foods is a seductive one, giving rise to the hope that data from effect-based assays of food products collected in market surveys is of suitable quality to be the basis for data-driven decision-making. To study this, we undertook a comparative study of the oestrogenicity of blinded cereal samples, both in a number of external testing laboratories and in our own facility. The results clearly showed little variance in the activities of 9 samples when using a single method, but great differences between the activities from each method. Further exploration of these findings suggest that the oestrogenic activity is likely an inherent part of the natural food matrix which the varying sample preparation methods are able to release and extract to differing degrees. These issues indicate the current poor suitability of these types of datasets to be used as the basis for consumer advice or food decision-making. Data quality must be improved before such testing is used in practice.
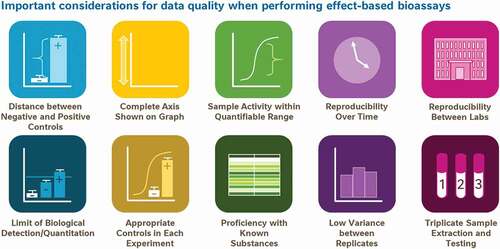
GRAPHICAL ABSTRACT
Introduction
We now live in an ‘infodemic’ age where consumers have an increased appetite for access to transparent product information that they can use to drive their decision-making, particularly on thematic issues like what could be harmful in what they eat. For example, concerns about endocrine disruptors have given rise to a number of mobile applications, web-based databases and lists of substances to avoid. Previously, the data underlying most of this guidance was substance-specific and based on analytical methodology with a long history of use in complex food mixtures. Because of this history, a number of standards are in place to ensure high-quality results. Best practices ensure quality through a) the use of internationally recognised and validated sample extraction/testing methods, b) pre-qualification of those methods for each specific food matrix and c) Proficiency testing, a continuous test programme of blinded-standard materials by which a laboratory can demonstrate proficiency in the performance of analytical tests.
However, increasing anecdotal evidence suggests organisations providing consumer guidance are transitioning away from substance-specific analytics (e.g. mass spectrometry) and towards effect-based in vitro tests (e.g. cell-based reporter gene assays) where the total effect of a sample on an (un)desirable molecular activity of interest is measured (Public Lab Citation2010; ScanUp Citation2016; Perturbateur-Endocrinien.com Citation2019). These bioassays are perceived as cheap, easy to perform, widely available from external testing laboratories and not directed towards specific substances; for these reasons they are commonly used for research and development within academic, government and industrial laboratories.
Indeed, the idea that previously unknown hazards, such as endocrine disruptors, can be readily detected in complex mixtures such as foods is a seductive one, giving rise to the hope that effect-based assays can be2 used to test food products collected in market surveys and that these data can be a suitable basis for consumer advice (ScanUp Citation2016; Yuka Citation2016; Perturbateur-Endocrinien.com Citation2019; Environmental Working Group Citation2020). Unfortunately, transparent information on the qualification of these assays to serve as a sound basis for food product decision-making is lacking. If this use for the bioassays is substantiated, then these datasets provide valuable insights to consumers; conversely, if these tests are unsuitable in this context, the offered advice could mislead consumers to poor decisions, potentially triggering the avoidance of nutritious foods. Therefore, it is important to validate the fitness of effect-based in vitro test data for the purpose of consumer advice and decision-making. To demonstrate this importance, we have tested a number of whole-grain cereals as an example of a whole-food matrix using a variety of oestrogen receptor reporter gene assays to measure a single bioactivity of widespread interest.
Materials and methods
Study design and external testing
To study whether currently available effect-based in vitro testing is of suitable quality to drive consumer decision-making (e.g. data reproducible between laboratories, with sufficiently low limits of biological detection and a range suitable to quantify activity), 9 blinded samples for oestrogenicity testing were submitted in early 2020 to 5 different contract laboratories consisting of 1 large contract research organisation and 4 small- and medium-enterprises located within the EU. These laboratories, performing a variety of different tests for oestrogen activity, were chosen because they responded positively to requests for both sample extraction/preparation and bioassay testing of breakfast cereal samples. No guidance was given regarding extraction, testing or data analysis methods; neither were any data quality criteria established. The 9 samples consisted of 8 breakfast cereals, plus 1 lot of whole wheat grains, all of which were compliant with European regulations for chemical contaminants. Samples were cryomilled to disguise their identities, vacuum-sealed into 10 g aluminium packets and randomly coded using the RANDBETWEEN random number generator within Microsoft Excel (Office 16). Each sample is briefly described in . The external laboratories then extracted and tested the cryomilled cereals samples according to their own procedures which are briefly described as reported in the test reports in the Supplementary Information.
Table 1. A brief description of the blinded 9 cereal test samples
To prepare the acetone extracts, 2 g of powdered cereal was extracted in 24 mL of acetone for 22 h at room temperature. Samples were then filtered to remove solids and flow through was collected. This extract was transferred into 15 mL centrifuge tubes in 3.5 mL aliquots, each of which was evaporated completely at 40°C under nitrogen, capped and stored at -20°C. For testing, this residue was resuspended in 1.5 mL MilliQ water, pre-diluted 1:4.65 in the same water and tested in the CALUX assay at final test concentrations of 5, 2.5 1.25, 0.5 and a 0 % vehicle control, corresponding to 1940, 972, 486, 243 and 0 µg of milled cereal. To screen the suitability of the acetone extraction method each sample was processed only once.
Spiking experiments were also performed to evaluate the recovery of activity using the different extraction methods. Although genistein is not expected to be present in whole grain cereals, it was used as the spiking agent because, as a polyphenol, it bears some structural similarity to the lignans naturally present in whole grains; yet, unlike the lignans, genistein does not require metabolic activation to an active oestrogenic form. To prepare the spiked acetone extracts, 100 µl of 6.7 × 10⁻⁴ M genistein in DMSO was added directly to the cereal powder and allowed to rest for 5 min prior to initiation of the extraction performed as above. To independently determine the extraction recovery and the matrix effect, parallel samples were spiked with the 6.7 × 10⁻⁴ M genistein after completion of the sample extraction. This resulted in a final concentration of 2.8 × 10⁻⁷ M, the approximate EC50 of genistein, in the CALUX test wells containing extract equivalent to 1940 µg cereal. Again, each sample was extracted only once for each pre-/post-extraction spiked pair.
To make the QuEChERS extracts in accordance with EN 15662, 1 g of powdered cereal was hand shaken in 10 mL of MilliQ water containing a ceramic homogeniser to suspend and moisten the powder before the addition of 10 mL of acetonitrile containing 1% acetic acid (final pH approximately 2.8). This was shaken at 1500 rpm for 3 min on a Geno/Grinder® tissue homogeniser (SPEX SamplePrep, Rickmansworth UK), before and after the addition of QuEChERS salts: 4 g MgSO4, 1 g NaCl, 1 g Na3-citrate and 0.5 g Na2H-citrate sesquihydrate (Agilent Technologies, Basel, CH). Samples were then centrifuged at 4000xg for 10 min to remove solids and supernatant was transferred into 15 mL centrifuge tubes in 1 mL aliquots, each of which was evaporated completely at 40°C under nitrogen, capped and stored at -20°C. For testing, this residue was resuspended in 1.6 mL MilliQ water and tested in the CALUX assay at final test concentrations of 5, 2.5 1.25, 0.5 and a 0 % vehicle control, corresponding to 625, 313, 156, 78.1 and 0 µg of milled cereal. For spiked samples, 100 µl of 9.0 × 10⁻⁵ M genistein in DMSO was added directly to the cereal powder and allowed to rest for 5 min prior to initiation of the extraction. The parallel samples were also spiked with 9.0 × 10⁻⁵ M genistein, but only after sample extraction. This resulted in a final concentration of 2.8 × 10⁻⁷ M, the approximate EC50 of genistein, in the CALUX test wells containing extract equivalent to 625 µg cereal. To screen the suitability of the QuEChERS extraction method each sample was extracted only once for each non-spiked extract and pre-/post-extraction spiked pair.
Alkaline extraction was performed using 2 g of powdered cereal extracted into 24 mL of 0.3 M sodium hydroxide (NaOH) in 70% methanol (pH approximately 13.5). After 70 min at 60°C, the pH of this solution was lowered to around 5 with the addition of 125 µL glacial acetic acid and the solids were sedimented by centrifugation at 13,000xg for 15 min. Aliquots of 6 mL supernatant in 15 mL centrifuge tubes were completely evaporated at 40°C under nitrogen, capped and stored at -20°C. For testing, this residue was resuspended in 3 mL MilliQ water, pre-diluted 1:4 in the same water and tested in the CALUX assay at final test concentrations of 5, 2.5 1.25, 0.5 and a 0 % vehicle control, corresponding to 1670, 833, 417, 208 and 0 µg of milled cereal. For spiked samples, 100 µl of 6.7 × 10⁻⁴ M genistein in DMSO was added directly to the cereal powder and allowed to rest for 5 min prior to initiation of the extraction. The parallel samples were spiked with 6.7 × 10⁻⁴ M genistein, but only after sample extraction. This resulted in a final concentration of 2.8 × 10⁻⁷ M in the CALUX test well, the approximate EC50 of genistein. To screen the suitability of the alkaline extraction method each sample was extracted only once for each non-spiked extract and pre-/post-extraction spiked pair.
This method was then optimised such that 1 g of powdered cereal was extracted in 20 mL of the alkaline methanol solution. After incubation, glacial acetic acid was added followed by sample centrifugation. Then, 0.5 mL aliquots in 1.5 mL Eppendorf tubes were completely evaporated at 40°C under nitrogen, capped and stored at -20°C. For testing, this residue was resuspended in 0.4 mL MilliQ water and tested in the CALUX assay at final test concentrations of 5, 2.5 1.25, 0.5 and a 0 % vehicle control, corresponding to 625, 313, 156, 78.1 and 0 µg of milled cereal. For spiked samples, 100 µl of 9.0 × 10⁻⁵ M genistein in DMSO was added directly to the cereal powder and allowed to rest for 5 min prior to initiation of the extraction. The parallel samples were spiked with 9.0 × 10⁻⁵ M genistein, but only after sample extraction. This resulted in a final concentration of 2.8 × 10⁻⁷ M in the CALUX test well, the approximate EC50 of genistein. In a second similar experiment with a matrix design, a full concentration response of 3.5, 6.1, 24, 98, 390, 3130, 6250 and 12500 nM genistein (final nominal concentration in the well) was extracted from milled whole-wheat flakes to attain a final nominal test level of 625, 313, 156, 78.1 and 0 µg breakfast cereal in the well. Initially, each sample was extracted only once for each non-spiked extract and pre-/post-extraction spiked pair to screen the suitability of the optimised alkaline extraction method. However, once it was evident that the method might be suitable, the 9 (non-spiked) cereal samples were re-extracted 2 more times each, with an elapsed time of weeks between each extraction to ensure complete sample independence. Each extract was tested in technical triplicates on the same CALUX assay plate around the time of extraction.
The CALUX assays were performed according to OECD PBTG 455 and Sonneveld et al. (Sonneveld et al. Citation2005; OECD Citation2016). Briefly, CALUX® cells, which consisted of human U2OS osteosarcoma cells co-transfected with constructs of oestrogen receptor (ERα) and a firefly luciferase reporter gene under the direct transcriptional control of repeated copies of the respective hormonal response element were licenced from BioDetection Systems (Catalogue #003, Amsterdam, Netherlands). These were seeded into the interior wells of 96-well plates at a density of 10,000 cells per well and cultured for 24 h at 37°C, 5% CO2 and 100% humidity after which the medium was replaced with 200 μL assay medium containing test extract or test extract and 5 pM oestradiol to boost the oestrogen receptor activities of the extracts into the dynamic range of the assay (all treatments in triplicate). Following a 24 h exposure, the viability of the cells was checked using the RealTime Glo™ MT cell viability assay (Promega, Madison, WI) according to the protocol previously described, except that both the enzyme and substrate were diluted 16,000x, instead of 500x, to make the reagent (Marin-Kuan et al. Citation2017). This was then added to the wells at a ratio of 2-parts reagent to 1-part cell culture volume (instead of 1:1). After analysis, the RT-Glo reagent was thoroughly removed by washing, the cells were lysed, and reporter gene activity was assessed by the addition of Glo-Mix substrate.
These data were processed to determine % relative induction, by subtracting the mean background reporter-gene luminescence of the vehicle control wells from all data on the same plate. These background-subtracted results were then normalised, such that the highest oestradiol response on the calibration curve (usually 500 pM) was set to 100%. For each well, % cell viability was also calculated by normalising the measured RT-Glo luminescence values to the mean response of the vehicle control wells (set to 100%). These % cell viability and % oestrogen activity data were then further processed within Spotfire (TIBCO, Palo Alto, CA) using the same data processing used to assess the external laboratory data.
Data processing
The exported .txt files with the data from each laboratory were all imported into a single Spotfire table containing both the raw values, calculated percent relative induction of the oestrogen reporter genes and percent cell viabilities where applicable. These values were then used to calculate 19 new columns in the table each deriving a different parameter needed to confirm test quality and calculate the measured oestrogenic activity in pg per g breakfast cereal. Many of the equations used in these calculations are quite long and consequently have been reported in the Supplementary Information for brevity.
Graphical analysis was initially conducted using Spotfire; however, for visual clarity, GraphPad Prism 8.4.3 (GraphPad Software, San Diego, CA) was used to produce publication-ready figures from these analyses. Wherever regression curves are reported, these were calculated first by performing a log10 transformation of the nominal test substance concentrations and then using the log(agonist) vs. response – Variable slope (four parameters) function. Where indicated, percent recovery was calculated by comparing the EC50s of the concentration response of the sample spiked before and after extraction. The effect of the whole wheat matrix was similarly determined by comparing the EC50s of the whole wheat flakes and the process blank extractions.
Results and discussion
Comparison of external test laboratories
To study whether effect-based in vitro testing is of suitable quality to drive decision-making, we undertook a comparative study of 5 contract testing laboratories offering oestrogenicity testing of food samples, using 9 blinded cereal samples () as our food matrix, which were submitted without any other guidance or study monitoring. Each laboratory produced a study report in which they outlined their findings; in addition, we were also able to collect the raw data from each study for a unified analysis.
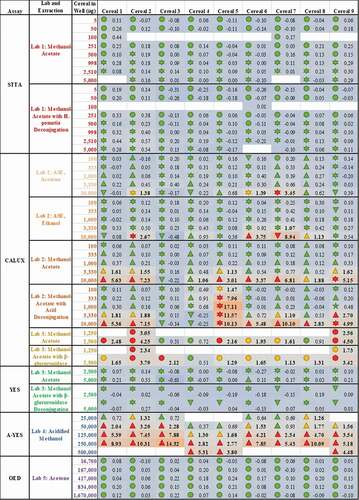
The study reports from the laboratories highlight a wide variety of results ranging from 0 to 290 pg oestradiol equivalents (EEQ) per g of powdered cereal (). These findings represent a > 10-fold difference between the highest and lowest EEQs, even when excluding results below the limit of biological quantification. Importantly, the variation in these data is from the table rows not columns; different breakfast cereals have similar levels of activity when the data are generated using the same methods, but different extraction and testing methodologies produce dissimilar results for the same cereal, even within the same lab.
Table 2. Blinded, non-guided testing of 9 different cereal samples in 5 different external laboratories using 10 different extraction methodologies reveals a lack of agreement on the levels of oestrogenic activity present (in pg oestradiol equivalents/g cereal)
For instance, Laboratories 1, 2 and 3 chose variations of an extraction method using 10% methanol:acetate buffer, yet Laboratories 2 and 3 (CALUX) measured oestrogenic activity, while Laboratories 1 and 3 (yeast oestrogen screen, YES) did not. The addition of a deconjugation step did not alter any of these results, as tests which were otherwise negative, remained so; positive samples still had approximately the same activities after deconjugation. Notably, the same Laboratory 3 extracts which tested negative in the YES assay were positive in the CALUX assay, suggesting that this difference is most probably related to the bioassay used. Since each cereal sample can logically only have one true level of oestrogenic activity, this inconsistency in results is concerning. By contrast, comparisons of the negative YES results from Laboratory 3 with the activities of the similar A-YES test from Laboratory 4 suggest that the bioassay may not always be the most important factor. Taken together, these findings indicate a lack of clarity as to which part of the testing process was the root cause of the variation in results: the sample extraction and preparation, the bioassay itself, the processing of the acquired data or some combination of these.
To examine the effect of these 3 test stages on the data, the raw results provided to us by each laboratory were reprocessed to determine the percent relative induction (%RI) and percent relative viability (%RV) for each test sample and oestradiol standard curve while minimising the diversity in the data analysis workflows. The relative sensitivity of each test was then scrutinised, using the oestradiol standard curves provided by each laboratory (). In this way, we were able to examine the effect of the bioassay test method on %RI without the confounding effects of differences in sample preparation or data analysis. These analyses demonstrate the relative sensitivity of each assay with the CALUX and STTA (stably transfected transcriptional activation) assays rated the most sensitive (defined as the assay with the smallest measured LOBQ or EC50 for oestradiol) with EC50 values in the 6–17 pM range (Laboratories 1, 2 and 3), followed by the A-YES and YES assays with an EC50 between 50 and 80 pM (Laboratories 3 and 4), and the least sensitive OED model with a range of EC50 values reported near 1000–2000 pM (Laboratory 5).
Figure 1. The oestrogenic activities of repeated oestradiol standard curves vary between assays indicating the relative sensitivity and reproducibility of each test system. The CALUX and STTA mammalian cell models were most sensitive, followed by the A-YES and YES yeast assays. All 4 models reproducibly produced similar concentration-response relationships in subsequent tests on subsequent days. This is not particularly surprising as all 4 tests have been vetted by ISO (A-YES and YES) or OECD (CALUX and STTA) after formal interlaboratory validation studies (OECD Citation2012, Citation2016, Citation2017; ISO Citation2018a, Citation2018b). Lab 5’s unvalidated OED model was both the least sensitive and the least reproducible of all the tests. For comparison, we have also provided the oestradiol standard curves collected using the CALUX assay in our own lab over the same timeframe as the external study
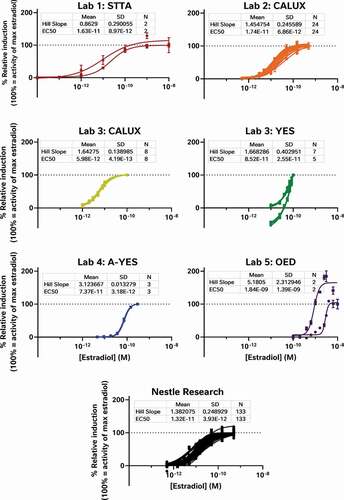
Obviously, these differences in sensitivity will have an impact on what oestrogenic effects can be measured in food matrices, with the least sensitive assays testing negative in cases where more sensitive assays are able to quantitate oestrogenic activity. For example, differences in assay sensitivity can explain why YES tests were all reported to be negative by Laboratory 3, but most of the corresponding CALUX tests of the same extracts are reported to have oestrogenic activity. However, other results cannot be explained by bioassay sensitivity, for example why similar methanol-acetate extracts from Laboratories 1, 2 and 3 were reported to have varying levels of oestrogenic activity in equivalent mammalian cell-based assays. Since the oestradiol standard curves from the STTA and CALUX assays are comparable and the findings of formal interlaboratory validation studies have demonstrated equivalence under OECD performance-based technical guidance (PBTG) 455 (OECD Citation2012, Citation2016, Citation2017), these data should mirror each other, but they don’t. Taken together, these findings suggest that while intrinsic bioassay sensitivity may have a role to play, it is not the sole driver behind the variation between datasets.
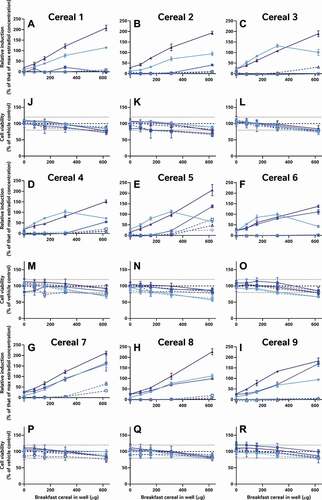
In addition to the oestradiol standard curves, we also similarly reassessed all of the raw data provided by the external laboratories to allow us to directly compare the effects of the diverse breakfast cereal extracts on oestrogen receptor activity and cell viability without interference from discrepancies in data analysis procedures (). As with the findings from the laboratory reports, the different samples had diverse oestrogenic responses which seemed to vary more between the extraction and testing methods (within the graph) than between the cereal samples (between graphs) (A-I). Since these data were analysed comparably, we can now infer that the different data analysis methods used by the 5 laboratories to analyse and interpret their data did not significantly impact the diversity of the final oestrogenicity results.
Figure 2. The consequence of diverse extraction and test methodologies is conflicting results for increasing concentrations of different breakfast cereal extracts. Methodology varied: (red) acidified methanol – STTA, (light orange) ASE with acetone – CALUX, (medium orange) ASE with ethanol – CALUX, (dark orange) methanol – CALUX, (yellow) acidified methanol – CALUX, (green) acidified methanol – YES, (blue) acidified methanol – A-YES and (purple) acetone – OED; closed symbols and solid lines indicate no deconjugation step, while extracts with open symbols and dashed lines were deconjugated.) Differing oestrogenic (A-I) and cell viability activities (J-R) were observed for the same cereal sample; whereas different samples prepared using the same methodology produced similar results
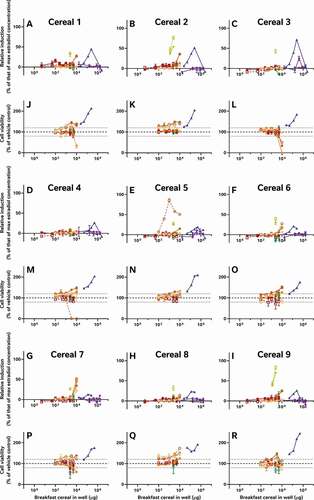
It should be noted that the corresponding cell viability findings (J-R) indicate non-specific effects of some of the extracts on cell viability at some concentrations, i.e. proliferation (defined as viability >120% of control) and cytotoxicity (defined as viability <80% of vehicle control). These may interfere with these cell-based assays for oestrogenicity and consequently the results should be interpreted carefully and holistically. For example, the results from Laboratory 4 indicate extract concentration-dependent proliferation of the yeast cells across all tested concentrations. This increase was not observed in the other YES assay, but is nonetheless plausible, due to the increased % methanol used for the acidified methanolic extraction and the ca 100-fold increase in the amount of breakfast cereal in the test. We can surmise that these high doses of the natural and added sugars found in the cereal extracts promotes yeast growth. Nonetheless, the activities found to be concentration-dependent increased the possibility that it cannot be excluded that at least some oestrogenic activity is present in the sample. Therefore, these samples were judged oestrogenic at treatment levels with activities >LOBQ, though the quantities of oestrogenic activity are likely overstated due to the confounding effect of the excess yeast. This interpretation generally agrees with the original Laboratory 4 assessment, which did make a correction for this excess growth during data assessment to calculate the activity they considered to be unrelated to the yeast proliferation.
As a consequence of these observations, the data presented in were all systematically interpreted. These findings are encoded in as coloured symbols indicative of positive (red), equivocal (yellow) and negative (green) for oestrogenicity, as well as (![]() ) cytotoxicity, (
) cytotoxicity, (![]() ) normal cell viability, (
) normal cell viability, (![]() ) proliferation and (
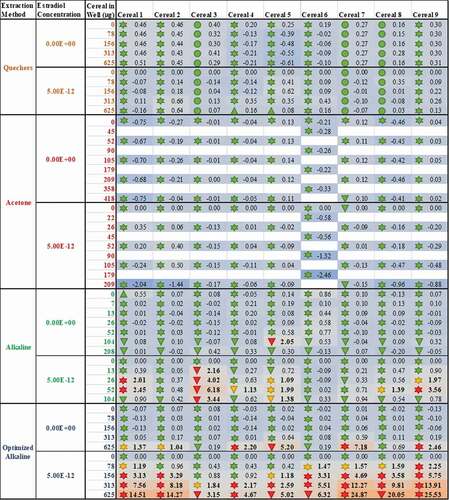
) proliferation and (![]() ) viability not assessed. In addition, limits of biological detection and quantitation were derived for each plate or experiment (LOBD and LOBQ, respectively). These were used to calculate the ratio of the response for each replicate test sample compared to the relevant LOBQ (or 5% relative induction, whichever is greater) for the plate as a per-plate indication of how positive the test results were ( heatmap and values). Again, these results indicate that the methodological choices made for sample extraction and testing (rows) impact the final results to a greater extent than the individual samples (columns). Thus, there is still no consensus regarding the actual oestrogenic activity of these samples.
) viability not assessed. In addition, limits of biological detection and quantitation were derived for each plate or experiment (LOBD and LOBQ, respectively). These were used to calculate the ratio of the response for each replicate test sample compared to the relevant LOBQ (or 5% relative induction, whichever is greater) for the plate as a per-plate indication of how positive the test results were ( heatmap and values). Again, these results indicate that the methodological choices made for sample extraction and testing (rows) impact the final results to a greater extent than the individual samples (columns). Thus, there is still no consensus regarding the actual oestrogenic activity of these samples.
Figure 3. Methodologies for sample extraction and testing affect measured estrogenicity more than the sample identity. The consequence of diverse extraction and test methodologies is conflicting oestrogenic activities of breakfast cereals. The numbers within each cell indicate the measured oestrogenic activity, represented as a fold-change over experimental LOQ (or 5 %RI, whichever is greater), such that activities can be compared between different assays. These values are then reflected in a heatmap in which the lowest activities are coloured blue, fold-changes of 1 (equal to the LOQ) are grey and the maximum estrogenicity observed is red. These are amalgamated with the findings from expert judgment, the shape of which codes for (![]()
Systematic comparison of extraction protocols
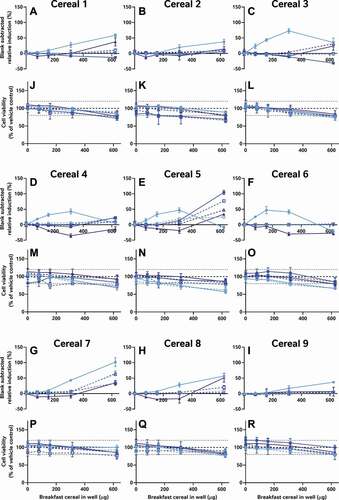
Nonetheless, if neither the data analysis nor assay performance stages are responsible for the major variation in the data, then by process of elimination, sample preparation, the remaining logical explanation, is the most likely contributing factor. To test this, we compared the activities of the same 9 cereal samples in the CALUX assay in our own laboratory using 4 different extraction methods: QuEChERS, a well-known food extraction protocol used by analytical chemists; Laboratory 5’s acetone extraction to test if the extracts have activity in a more sensitive and reproducible test system; an alkaline extraction method specifically designed to extract phytoestrogens (expected to be the key source of oestrogenic activity in cereals) from cereal samples and an optimised version of the alkaline protocol to reduce its cytotoxicity (). As in , these data were also all systematically interpreted in the same manner as the data from the external laboratories ().
Figure 4. An optimised, fit-for-purpose alkaline extraction protocol (blue) is needed to release and deconjugate the matrix-bound phytoestrogens in cereals, but co-treatment with a fixed concentration of oestradiol (![]()
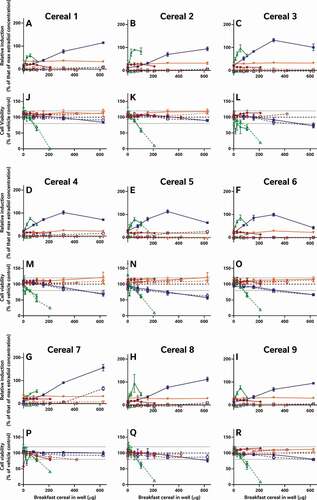
Figure 5. The method of sample extraction affects measured estrogenicity more than sample identity; even when the test lab and bioassay used are standardised, the measured oestrogenic activities vary more as a result of the chosen extraction method (rows) than the identity of the sample (columns). The consequence of this finding is conflicting results for the oestrogenic activity of breakfast cereals. As before, the numbers within each cell indicate the measured oestrogenic activity, represented as a fold-change over experimental LOQ (or 5% RI, whichever is greater); these are translated into a heatmap in which the lowest activities are coloured blue, fold-changes of 1 (equal to the LOQ) are grey and the maximum estrogenicity observed is red. The findings from expert judgment are also shown where the shape codes for viability![]()
It is worth noting that the variation in these data is again from the table rows (extraction method) not columns (cereal samples); even when applying the same bioanalytical assay in the same lab, the different breakfast cereals have similar levels of activity when the data are collected using the same methods, but different extraction methods produce dissimilar results for the same cereal. Moreover, only some extraction methods appear to be capable of ‘releasing and recovering’ the activity in the extract. Neither the acetone nor the QuEChERS methods were able to extract oestrogenic activity from the cereal matrices (A-I); this was still true even after co-treatment with 5 pM oestradiol to ‘boost’ the activity above the LOBQ threshold into the active and quantitative range of the assay. That these 2 methods were unsuitable was also confirmed by a lack of activity recovered from spiked whole wheat flake samples ().
Figure 6. Alkaline extraction methods, but not acetone and QuEChERS were able to recover the oestrogenic activity of spiked-in genistein from either a process blank (blue) or whole wheat flakes (red). The unoptimised alkaline method was able to extract the oestrogenic activity of 280 nM genistein, it was cytotoxic to the cells at 3 of the 4 concentrations tested. Thus, neither the acetone, QuEChERS nor the unoptimised alkaline extraction method was considered suitable for the extraction of the breakfast cereals. Only the optimised alkaline method extracted the genistein without inducing more than mild cytotoxicity at the top concentration tested. Genistein-spiked samples are presented as dark colours and unspiked extracts as lighter versions; percent relative induction is shown using closed symbols and solid lines, while percent relative viability has open symbols with dashed lines
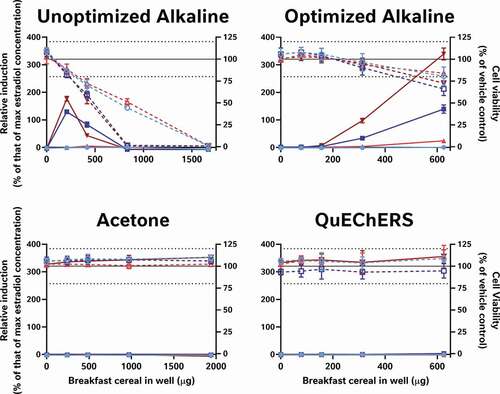
By contrast, the alkaline methods both extracted oestrogenic activity from the cereal samples (approximately the LOBQ), which were made quantifiable by ‘boosting’ with 5 pM oestradiol (A-I). Unboosted samples generally did not have detectable activity (<LOBD). However, in the case of the un-optimised method, a large assay interference from cytotoxicity was observed (J-R), which was minimised in the optimised method by extracting less cereal material and resuspending the dried extract in a larger volume. Comparison of the EC50 values of samples spiked before and after extraction indicates that the optimised alkaline extraction method was able to recover about 96% of the oestrogenic activity with a negligible effect of the whole wheat flake-matrix (93 to 185% shift in EC50, depending on the amount of breakfast cereal in the test well) (). This method was generally quite reproducible, as 3 independent extractions of each cereal generally produced similar results ().
Figure 7. Optimised alkaline extraction recovered the oestrogenic activity from spiked breakfast cereals. To demonstrate the recovery of this activity, varying amounts of genistein were spiked into milled whole wheat flakes or sham experiments at different levels in a matrix design. These samples were then extracted to generate a genistein concentration-response curve at every cereal test level for both a process blank (Panel A; from lightest to darkest blue: vehicle control, 78.1, 156, 313, or 625 µg) or whole wheat flakes (Panel B; from lightest to darkest red: vehicle control, 78.1, 156, 313, or 625 µg cereal). In both panels, superinduction of oestrogenic activity was observed from genistein treatment at all cereal levels. (Cell viability data were also collected for these experiments, but for clarity are not shown here.) In a follow up experiment (Panels C and D), these results were compared with those from unspiked process blank and extract of whole-wheat flakes which had been spiked post-extraction with the genistein concentration-response curve at the 625 µg cereal level (shown in muted colours and dotted lines). These tests indicate that the alkaline extraction process transforms the genistein into a more active oestrogenic substance of unknown identity (Panel C). Cell viability (Panel D, dashed lines) is however, unchanged
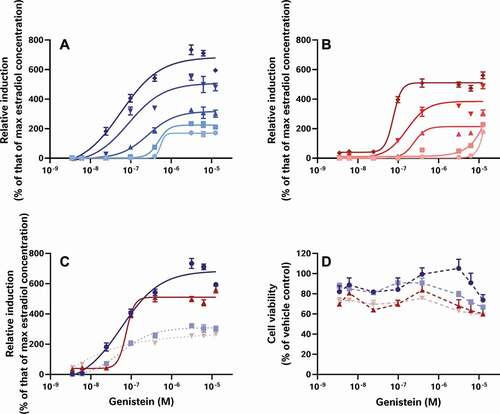
Figure 8. Three independent replicates of the optimised alkaline extraction method (in varying shades of blue) had similar oestrogenic activities in the CALUX assay (here shown as percent relative induction without further processing). These data indicate that both the extraction and bioassay methods were reproducible. However, the activities measured were low; consequently, the optimised alkaline extracts had to be ‘boosted’ into the dynamic range of the bioassay by co-treatment with a fixed 5 pM concentration of oestradiol (Panels A-![]()
Limitations when estimating oestrogenic activities
Quantifying the oestrogenic activities of the cereal extracts is more complicated, however. As shows, the boosted process blanks (alkaline extractions lacking sample) from each replicate extraction were also positive for oestrogenic activity, but with less activity than was measured in the cereal extracts. The presence of extremely low concentrations of oestrogenic contaminants in the extraction reagents can be inferred. Consequently, both the activity related to the 5 pM oestradiol ‘boost’ and that from the background activity of the concurrent process blank must be subtracted from each breakfast cereal extract to derive the true oestrogenic activities related to the cereal samples (). This adds a significant amount of data processing and assumes that the oestrogenic activities of the extract mixture are equal to the sum of: the sample, the background in the process blank, and, where applicable, the 5 pM oestradiol ‘boost’. Because this bioassay is relatively simple from a biological perspective (a single molecular event), this assumption is reasonable, but it reduces the level of certainty.
Figure 9. ‘Boosting’ the optimised alkaline extracts into the dynamic range of the CALUX assay by co-treatment with a fixed 5 pM concentration of oestradiol can result in oestrogenic activity in the process blanks (Panel A;![]()
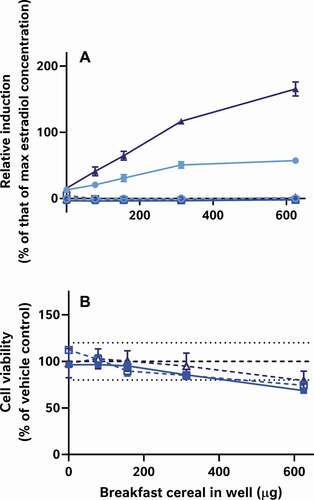
Figure 10. The matrix-bound phytoestrogens in cereals can be semi-quantified using oestrogen activity measures; however, it is necessary to subtract both the 5 pM oestradiol ‘boost’ (where applicable) and the concurrent process blank from the measured oestrogenic activities (Panels A-I). The resulting blank-subtracted relative inductions estimate the part of the measured oestrogenic activities which can be ascribed solely to the tested cereal samples in the ‘boosted’ (![]()
Despite these concerns, we found the oestrogenic activities of these extracts to be approximately 0.2–4.9 ng oestradiol-equivalents per g cereal, but these results should be interpreted as semi-quantitative estimates rather than fully quantitative oestrogenic responses (). This is higher than was reported by the other laboratories, which could be explained by an increased hydrolytic extraction of covalently bound lignans by the alkaline extraction method. However, as there is no way to determine what proportion (if any) of these lignans was released from their covalent bonds to the lignins of the cell wall, we cannot draw any firm conclusions regarding the performance of the alkaline extraction method. Nonetheless, these findings demonstrate that the oestrogens in cereals, even unprocessed raw whole grains, can be extracted and measured in bioassays.
Table 3. Oestradiol-equivalencies of the optimised alkaline extracts reveal the oestrogenic activities of these 9 cereal samples
The presence of oestrogenic activity in the cereals most probably reflects the inherent properties of the food matrix rather than an exogenous contamination of toxicological concern. The similarity of the results between the 9 samples in both the external laboratory testing and our own experiments with different extraction protocols suggests a uniform source of activity; this would be inconsistent with the presence of contaminants, but very consistent with innate phytoestrogens in cereal crops. This hypothesis is also supported by the difficulty in extracting the oestrogenic activity, as the phytoestrogens present in cereals exist mostly as inactive O- or C-glycosides covalently bound to the lignins of the cell wall (Dinelli et al. Citation2009; Leoncini et al. Citation2012; Žilić Citation2016; Hostetler et al. Citation2017). Active aglycones must be released through hydrolysis during sample extraction, e.g. mediated by a pH change (Kuhnle et al. Citation2009; Hostetler et al. Citation2017). While this does also occur when whole grain cereals are consumed, there is no indication of adverse effects at the phytoestrogen levels which naturally occur in food, supported by a long history of safe human consumption (at least since humankind first began to grow grain crops in about 10,000 BC) (UK-COT Citation2003; AFSSA Citation2005; Cekici Citation2018; Global Burden of Diseases, Injuries, and Risk Factors Study 2017 Diet Collaborators Citation2019). On the contrary, there is a significant body of scientific evidence suggesting a human health benefit of dietary phytoestrogen and whole grain consumption.
General relevance of oestrogenicity testing for foods
It is clear that testing food matrices like cereals for biological activities such as oestrogen receptor activity is a much more complicated process than for pure substances. Food samples generally cannot be added directly to bioassay test wells and must undergo an extraction process prior to testing. This is critical to the test outcome and must be adapted to the analyte(s) of interest, the sample matrix and the bioassay. Consequently, it is essential to know which analyte families and matrices are to be extracted and design the sample preparation methods accordingly. This methodology must undergo a ‘qualification’ process experimentally demonstrating its suitability and reproducibility prior to use in testing. The bioassay also needs to be suitable for the food matrix and analytes tested; the assay sensitivity (low LOBQ) must be sufficient to detect the activities of the analytes of interest in the extracts.
Moreover, these needs of the bioassay and sample preparation are intertwined to a degree which prevents the amalgamation of internationally recognised sample preparation methods for analytical analyses onto bioassays previously validated for pure materials testing. For example, many existing extraction methodologies significantly deviate from neutral pH or use solvents containing significant impurities. Both may result in cytotoxicity of cell-based bioassays, necessitating substantial dilution prior to bioassay addition which can render a valid bioassay activity undetectable. And while extraction of too little sample matrix can produce dilute test samples with activities below the LOBQ of the bioassay, extraction of too much sample material or poor separation of the analytes from the matrix can also affect cell viability in the bioassay, either as cytotoxicity or as increased cell growth (e.g. through increased nutrition). As the fitness for purpose of the bioassay cannot be separated from that of the sample preparation, both the analytical method (bioassay) and the sample extraction and preparation have to be qualified together.
Most importantly, this ‘qualified’ combined sample preparation and test method also needs to reflect a factual reality: there cannot be more than one biological activity for a single sample. Logically then, there can only be one acceptable experimental result, the one which reflects the ‘true’ biological activity of that sample. There cannot be any confidence in a cacophony of results, such as we have identified in our study of breakfast cereals, certainly not enough to consider sharing them with a consumer or using them as the basis for advice. Instead, these differences must first be resolved, usually through method standardisation. Government and industry analytical laboratories responsible for food-contaminant surveillance are already achieving this; uniform sample extraction, testing, and data analysis protocols for thousands of analyte-food matrix combinations are already in force as national (e.g. US), international (e.g. European Union) and supranational (e.g. Codex Alimentarius) qualified standards. A similar approach may be relevant to bioassay testing to ensure that the results tested by a single laboratory can be traced back to a single experimental reality, one widely accepted to accurately reflect the true biological activity of the sample.
This ‘qualification’ spirit also has to continue into the testing phase; appropriate quality control metrics (e.g. the inclusion of extraction process-blanks and the collection of LOBDs/LOBQs, induction factors, and Z-prime scores, see (Fussell et al. Citation2021) for more discussion) should also be part of every test run to ensure the validity of, and proper interpretation of, each test result in the context of a historical record of repeated measures. For cell-based assays, viability measures sensitive enough to detect assay-interfering cell viability changes are essential; ideally these should be multiplexed into the same bioassay well for unambiguous data interpretation.
It should be noted that none of these recommendations is new or revolutionary; in the food regulatory environment, these best practices have been employed for decades by contaminant surveillance laboratories which exclusively employ internationally standardised methods. These have been validated with spiked matrix samples to establish the limits of detection and quantification and quantifiable range of assessment for each method/matrix. The validation is performed over time across several laboratories to ensure reproducibility. Moreover, this insistence on quality extends beyond past-performance to the present. Each time a sample is extracted, a process-blank is incorporated to control for contamination during sample preparation. Tests must meet pre-identified test criteria or be repeated. And periodic random testing of blinded positive samples continuously tests the laboratory’s performance with these methods. Together, these practices ensure high quality data to underpin decision-making.
Quality framework for bioassay testing of foods
Borrowing from these ideals already in practice for analytical testing, we propose a framework of 10 data quality aspects to consider before relying on biological data to drive decision-making (). This framework is not intended to be used as an exhaustive list of data quality considerations, nor should it be used as a checklist of parameters which must be adhered to in every scientific experiment; as ever, experimental context and good scientific judgment may supersede some of these points at times. Instead, the framework was created as a ‘cheat sheet’ for fellow scientists of which quality measures are important when developing new bioassay methods to be used for regulatory food testing or for underwriting consumer-advice.
Figure 11. A proposed framework of 10 simple points for consumers and non-experts to consider when assessing the suitability of data for the purposes of decision making or consumer advice
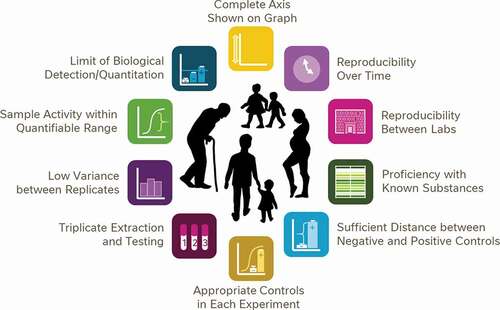
At the same time, these 10 aspects can be thought of as the basis of consumer/non-expert guidance conveying some common signs that data are of insufficient quality to be considered a reliable resource for decision making. Naturally, when used in this context the simple picture as presented in is an insufficient communications strategy; each of these aspects would need to be detailed to consumers in the plain language with which they are familiar. Nonetheless, public curiosity for accessibly presented data science, as reflected in the success of TED talks about statistics, podcasts like Data Stories and Freakanomics and non-fiction books like Factfulness and Thinking Fast and Slow, suggests a widespread consumer interest in the process of analysis and interpretation of scientific data to answer questions. (Technology, Entertainment and Design Citation1984-current; Levitt and Dubner Citation2005; Dubner Citation2010; Kahneman Citation2011; Bertini and Stefaner Citation2012-current; Rosling et al. Citation2018). The proposed structural framework of 10 aspects of high-quality data to be considered could be readily adapted into tools for helping consumers understand what features indicate high-quality and reliable data.
These consumer questions, e.g. which products are the healthiest, most nutritious or best for the environment, often reflect wider social concerns, but beneficial outcomes for society are only possible if the decisions taken are grounded in scientific fact. This necessitates a realistic conviction that the experimental data reflect the biological reality; such confidence is only possible with the highest quality datasets. Since these best practices are soundly based in current practice in the context of regulatory testing and contaminant surveillance, it seems reasonable for consumers to demand this level of data quality underlying the advice that they are receiving. Anything less than this is at best, duplicitous, and at worst may be putting the health of consumers at risk.
Conclusions
An inter-laboratory study of 8 breakfast cereals and 1 sample of milled whole wheat found wide disparity between the oestrogenic activities reported by each laboratory, but little variance between the cereals when using a single extraction method and bioassay.
The oestrogenic activity observed is likely an inherent property of the natural food.
Differences in sample extraction and sample preparation methods are the largest contributors to the variances in oestrogenic activities reported by the laboratories.
Varying sample preparation methods are able to release and extract various oestrogenic chemistries (inherent or otherwise) to differing degrees. It is important then to demonstrate the suitability of the extraction methodology for the targeted substances and sample matrix, prior to its use for food testing in bioassays.
Best practices and standardised methods are needed to ‘qualify’ bioassay results as reflecting the ‘true’ biological oestrogenic activity of a sample.
Data quality must be improved before such testing is used in practice. A framework of 10 data quality aspects is proposed for consideration by experts when developing and assessing bioassays and their uses. This framework could also be used as the structural basis of a plain-language communications strategy giving consumers and other non-experts tools to assess the quality of the evidence to which they are already exposed.
Given these concerns, current bioassay datasets are of poor suitability to support food decision-making; therefore, any present use as the basis of consumer advice is premature.
Author contributions
This study was conceived by KCF, MMK, GS and BS with analytical input from LP, DMR, and FB, and subject-matter expertise from TS and GMP. MMK administered all external testing. For the internal study of the sample preparation methods, the sample extraction protocols were developed by ED, DMR and LP and the investigations conducted by ED, DMR, NC and ME. BG, PS, HL, AF and ED were responsible for the bioassay testing of these extracts, while FB, TB, NC and ME were responsible for the analytics. Project management, data curation, formal analysis and the writing of the original draft was conducted by KCF, with review and editing by MMK, GS and BS.
Declaration of interests
All authors are employees (and pension fund members) of Nestlé Research, manufacturer and marketer of the 8 breakfast cereals used in this study; they declare that they have no other potential conflicts of interest.
Supplemental Material
Download Text (1,011.8 KB)Supplemental Material
Download Text (41 KB)Supplemental Material
Download Text (532 KB)Supplemental Material
Download Text (984.5 KB)Supplemental Material
Download Text (938.2 KB)Supplemental Material
Download MS Word (55.4 KB)Acknowledgments
The authors would like to acknowledge the kind assistance of Drs. Michael Gallo Sr. and Ana-Cristina Docan in identifying potential test laboratories.
Data availability statement
Nestlé Research holds a license from BioDetection Systems (Amsterdam, Netherlands) for the use of the CALUX assay. All other materials used are widely available. The authors declare that all raw data supporting the findings of this study are available within the paper and its supplementary information files. Spotfire data analysis files are available from the corresponding author upon reasonable request.
Supplemental material
Supplemental data for this article can be accessed on the publisher’s website.
Correction Statement
This article has been republished with minor changes. These changes do not impact the academic content of the article.
Additional information
Funding
References
- [AFSSA] Agence Française de Sécurité Sanitaire des Aliments. 2005. Sécurité et bénéfices des phyto-estrogènes apportés par l’alimentation.
- Bertini E, Stefaner M. 2012 -current. Data stories.
- Cekici H. 2018. Current nutritional factors affecting fertility and infertility. Ann Clin Lab Res. 6(1):225. doi:https://doi.org/10.21767/2386-5180.1000225.
- [EWG] Environmental Working Group. 2020. EWG’s Healthy Living App. Environmental Working Group; [accessed 2020 Nov 25]. https://www.ewg.org/apps/.
- Dinelli G, Carretero AS, Di Silvestro R, Marotti I, Fu S, Benedettelli S, Ghiselli L, Gutierrez AF. 2009. Determination of phenolic compounds in modern and old varieties of durum wheat using liquid chromatography coupled with time-of-flight mass spectrometry. J Chromatogr A. 1216(43):7229–7240. doi:https://doi.org/10.1016/j.chroma.2009.08.041.
- Dubner SJ. 2010. Freakonomics radio. USA: Freakonomics Radio. p. online resource (audio files). https://www.npr.org/podcasts/452538045/freakonomics-radio
- Fussell KC, Marin-Kuan M, Scholz G, Badoud F, Bessaire T, Christinat N, Ernest M, Montoya Parra G, Morin-Rivron D, Poquet L, et al. 2021. In vitro estrogenic activity of cereal based products: reliability and relevance considerations. Cereal Chem. 98(1):164–174. doi:https://doi.org/10.1002/cche.10397
- [GBD] Global Burden of Diseases, Injuries, and Risk Factors Study 2017 Diet Collaborators. 2019. Health effects of dietary risks in 195 countries, 1990-2017: a systematic analysis for the global burden of disease study 2017. Lancet. 393(10184):1958–1972. doi:https://doi.org/10.1016/S0140-6736(19)30041-8.
- Hostetler GL, Ralston RA, Schwartz SJ. 2017. Flavones: food sources, bioavailability, metabolism, and bioactivity. Adv Nutr. 8(3):423–435. doi:https://doi.org/10.3945/an.116.012948.
- [ISO] International Standards Organisation. 2018a. Water quality — Determination of the estrogenic potential of water and waste water — Part 1: yeast estrogen screen (Saccharomyces cerevisiae). Geneva (Switzerland): ISO. p. 1–58.
- [ISO] International Standards Organisation. 2018b. Water quality — Determination of the estrogenic potential of water and waste water — Part 2: yeast estrogen screen (A-YES, Arxula adeninivorans). Geneva (Switzerland): ISO. p. 1–62.
- Kahneman D. 2011. Thinking, fast and slow. 1st ed. New York (NY): Farrar, Straus and Giroux.
- Kuhnle GG, Dell’aquila C, Aspinall SM, Runswick SA, Mulligan AA, Bingham SA. 2009. Phytoestrogen content of cereals and cereal-based foods consumed in the UK. Nutr Cancer. 61(3):302–309. doi:https://doi.org/10.1080/01635580802567141.
- Le Grand A, Bouter A, Couturier A, Mulner-Lorillon O, Le Goff X, Chesnel F, Sire O, Le Tilly V. 2015. Investigation of the functional properties and subcellular localization of alpha human and rainbow trout estrogen receptors within a unique yeast cellular context. J Steroid Biochem Mol Biol. 149:17–26. doi:https://doi.org/10.1016/j.jsbmb.2015.01.007.
- Leoncini E, Prata C, Malaguti M, Marotti I, Segura-Carretero A, Catizone P, Dinelli G, Hrelia S. 2012. Phytochemical profile and nutraceutical value of old and modern common wheat cultivars. PLoS One. 7(9):e45997. doi:https://doi.org/10.1371/journal.pone.0045997.
- Levitt SD, Dubner SJ. 2005. Freakonomics: a rogue economist explores the hidden side of everything. 1st ed. New York (NY): William Morrow.
- Marin-Kuan M, Fussell KC, Riederer N, Latado H, Serrant P, Mollergues J, Coulet M, Schilter B. 2017. Differentiating true androgen receptor inhibition from cytotoxicity-mediated reduction of reporter-gene transactivation in-vitro. Toxicol In Vitro. 45(Pt 3):359–365. doi:https://doi.org/10.1016/j.tiv.2017.03.014.
- Mosmann T. 1983. Rapid colorimetric assay for cellular growth and survival: application to proliferation and ‘cytotoxicity assays. J Immunol Methods. 65(1–2):55–63. doi:https://doi.org/10.1016/0022-1759(83)90303-4.
- [OECD] Organisation for Economic Cooperation and Development. 2012. Performance standards for stably transfected transactivation in vitro assays to detect estrogen agonists for TG 455. Vol. 173. Paris: OECD Publishing. (Series on Testing and Assessment; No. 173).
- [OECD] Organisation for Economic Cooperation and Development. 2016. Test No. 455: performance-based test guideline for stably transfected transactivation in vitro assays to detect estrogen receptor agonists and antagonists. Paris: OECD Publishing. ( OECD Series on Testing and Assessment).
- [OECD] Organisation for Economic Cooperation and Development. 2017. Report of the validation of the (anti-) ER alpha CALUX bioassay: U2-OS cells transcriptional ERalpha CALUX- assay for the detection of estrogenic and anti-estrogenic chemicals for inclusion in TG455. Vol. 240. Paris: OECD Publishing. (Series on Testing and Assessment; No. 240).
- [PE] Perturbateur-Endocrinien.com. 2019. Perturbateur-Endocrinien.com vient de réaliser dernièrement une étude majeure sur le risque PE de type oestrogénique dans les céréales du petit-déjeuner. NIR Industry. [accessed 2020 Sept 15]. https://www.perturbateur-endocrinien.com/cereales-du-petit-dejeuner-nous-avons-mene-lenquete-sur-le-risque-perturbateur-endocrinien/.
- [PL] Public Lab. 2010. Home testing for endocrine disruptors. Publiclab.org. [accessed 2020 Nov 25]. https://publiclab.org/wiki/environmental-estrogen-testing.
- Rosling H, Rosling O, Rönnlund AR. 2018. Factfulness: ten reasons we’re wrong about the world–and why things are better than you think. 1st ed. New York: Flatiron Books.
- [SU] ScanUp. 2016. ScanUp: l’appli pour scanner et co-créer vos produits alimentaires! ScanUp. [accessed 2020 Nov 25]. https://scanup.fr/.
- Sonneveld E, Jansen HJ, Riteco JA, Brouwer A, van der Burg B. 2005. Development of androgen- and estrogen-responsive bioassays, members of a panel of human cell line-based highly selective steroid-responsive bioassays. Toxicol Sci. 83(1):136–148. doi:https://doi.org/10.1093/toxsci/kfi005.
- [TED] Technology, Entertainment and Design. 1984 -current. Statistically speaking …. [accessed 2021 Apr 7]. https://www.ted.com/playlists/479/statistically_speaking.
- [UK-COT] United Kingdom Committee on Toxicity. 2003. Phytoestrogens and health. https://cot.food.gov.uk/sites/default/files/cot/phytoreport0503.pdf
- Žilić S. 2016. Phenolic compounds of wheat their content, antioxidant capacity and bioaccessibility. MOJ Food Process Technol. 2(3):85–89. doi:https://doi.org/10.15406/mojfpt.2016.02.00037.
- van der Linden SC, von Bergh AR, van Vught-Lussenburg BM, Jonker LR, Teunis M, Krul CA, van der Burg B. 2014. Development of a panel of high-throughput reporter-gene assays to detect genotoxicity and oxidative stress. Mutat Res Genet Toxicol Environ Mutagen. 760:23–32. doi:https://doi.org/10.1016/j.mrgentox.2013.09.009.
- Yuka. 2016. Yuka App. Yuka. [accessed 2020 Nov 25]. https://yuka.io/en/app/.