
 ?Mathematical formulae have been encoded as MathML and are displayed in this HTML version using MathJax in order to improve their display. Uncheck the box to turn MathJax off. This feature requires Javascript. Click on a formula to zoom.
ABSTRACT
Residues of ethylene oxide (EO), a banned fumigant in the EU, were found at amounts above the maximum residue limit (MRL) in carob (locust) bean gum (additive E410). The pesticide entered the food chain via stabiliser blends that are used as minor ingredients in the manufacture of ice cream. Consequently, all products that contained the non-compliant ingredient were withdrawn or recalled in several countries across the EU, in most cases irrespective of whether the pesticide residue was detectable or not in the final product. This is the first report of a reliable method to determine EO and its metabolite/marker compound 2-chloroethanol (2-CE), either together or independently in ice cream, with a limit of quantification at 0.01 mg EO/kg and recovery in the range of 87–104% across the levels investigated (0.01, 0.02 and 0.06 mg EO/kg). The method applies QuEChERS extraction and isotope dilution gas chromatography coupled with tandem mass spectrometry (GC-MS/MS). High resolution mass spectrometry (HRMS) confirmed the specificity of low mass ions. Data on the stability of EO and 2-CE under thermal conditions revealed that 2-CE is relatively stable in an ice cream matrix (ca. 80% recovery of spiked material). Importantly, this study also demonstrates that not EO, but 2-CE is the predominant analyte detected in the contaminated samples, which is new information of significance in terms of the overall risk assessment of EO in foodstuffs.
Introduction
Ethylene oxide (EO; CAS n°75-21-8) is a flammable gas manufactured primarily as a base chemical to make other chemicals, such as polyethylene glycols. EO is permitted for use as a fumigant to control pests as well as a broad spectrum of microorganisms including bacterial pathogens in several countries, e.g. India, Canada, and the USA. The use of EO as a pesticide is, however, banned in the European Union (EU) due to its mutagenic and carcinogenic properties. In other words, ingredients need to comply with the maximum residue level (MRL) established for the particular commodity (Commission Regulation Citation2015/868).
Notifications through the EU Rapid Alert System for Food and Feed (RASFF) portal on ingredients non-compliant due to the occurrence of EO were recently reported, particularly in dry food products such as herbs and spices, frequently originating from India (Anastassiades, Citation2021). It is important to note that EO is expected to dissipate rapidly due to its high volatility (boiling point of 10.4°C) and/or react under ambient conditions with nucleophiles such as chloride to form the less volatile metabolite 2-chloroethanol (2-CE, boiling point 129°C). The residue definition as per Commission Regulation (EU) 396/2005 is therefore the sum of EO plus 2-CE, expressed as EO.
In September 2020, Belgium initiated a RASFF notification on the unauthorised use of EO in sesame seeds from India, reporting 30 mg/kg (RIVM and WSFR Citation2020). The economic ramifications of this finding were significant, leading to recalls or withdrawals from the marketplace of different products such as for example bread, hummus, sauces and other foods containing sesame seeds (European Parliament Note Citation2021). In this particular case, the European Commission rapidly implemented Commission Regulation 2020/1540 that requires all sesame seed imports from India to comply with the MRL set at 0.05 mg/kg. In addition, 50% of consignments imported from India to the Member States are checked upon entry to verify compliance with the regulation.
Very recently, residues of EO were detected in stabiliser blends (Lygomme FM 4605 and FM 3630) from one supplier (RASFF alert notifications Citation2021.2966 and Citation2021.3882). The cause of the contamination was the use of contaminated carob bean gum (food additive E410), with the consequence that all ice creams containing the stabiliser blends may be contaminated with EO, albeit at different amounts, depending on the initial level of EO in the carob bean gum as well as the degree of dilution/loss of the analyte across the ice cream manufacturing process. Carob bean kernels or pods were apparently fumigated at farm level, thereby introducing EO into different ingredients and impacting numerous manufacturers of ice cream across the EU (EC Citation2021).
According to the legal provisions set out by the European General Food Law (Commission Regulation 178/Citation2002), all food products containing non-compliant E410 (carob bean bum), i.e. above the MRL set at 0.1 mg/kg (Commission Regulation Citation2015/868), cannot be marketed and need to be withdrawn or recalled, irrespective of the amounts in the final composite food. The EO residues detected in the stabiliser blends were mostly in the range of 0.4–1.1 mg/kg (personal communication by the European Ice Cream Trade Association).
The analysis of EO at trace levels in composite foods is not straightforward and so far no sensitive methods are described for fatty matrices such as ice cream. Analytical methods have been developed mainly for dry foods such as herbs, spices, dried vegetables, nuts, grains, etc. (see references listed in ). Moreover, the approaches used are very diverse, i.e. EO can be fully converted through acid treatment (HCl/NaCl) to 2-CE, or 2-CE is converted back to the epoxide by alkali treatment (Anastassiades, Citation2021). The detection of the analytes is usually by separation with gas chromatography (GC) coupled either with electron capture detection (ECD), flame ionisation detection (FID), or mass spectrometry (MS, single or triple quadrupole).
Table 1. Selected analytical approaches for the analysis of EO and/or 2-CE in foodstuffs
To our knowledge, this is the first study that describes an analytical approach using QuEChERS and GC-MS/MS to determine both EO and 2-CE in ice cream, either together or individually. The method achieves a quantification limit (LoQ) of 0.01 mg/kg (expressed as EO) and recovery of EO in the ice cream matrix > 85%. This study also provides insight into the distribution of the parent compound versus the marker compound 2-CE in ice cream, considering as well the impact of processing on EO and 2-CE recoveries.
Material and methods
Chemicals and reagents
All chemicals and reagents were of reagent grade or higher. The solvents used were LC gradient grade. Acetonitrile (ACN) and water were purchased from Merck (Darmstadt, Germany), whereas concentrated sulphuric acid (>99% purity) and sodium chloride were procured from Sigma-Aldrich (Buchs, Switzerland). Ready-to-use QuEChERS salts (containing 4 g of magnesium sulphate, 1 g of sodium chloride, 1 g of sodium citrate, and 0.5 g of disodium citrate sesquihydrate) and dispersive Solid Phase Extraction salts (d-SPE, containing 150 mg PSA, 150 mg C18EC, and 900 mg MgSO4) were obtained from Agilent (Geneva, Switzerland).
Analytical standards of EO (50 mg/mL in methanol) and 2-CE (2 mg/mL in methanol) were available in ready-to-use solutions from Sigma-Aldrich. Isotopically labelled 2H4-2-CE (ISTD), chemical purity >98% and isotopic purity 98%, was obtained from HPC Standards GmbH (Cunnersdorf, Germany).
Standard solutions
Due to the high volatility of EO, the preparations of related standard solutions were performed at low temperature using a water bath containing ice. The diluting solution (ACN) was placed in the freezer for at least 10 min before use. Analytical standard solutions were kept cold before being pipetted to prepare the working standard solutions of each EO, 2-CE and ISTD at 1 mg/mL and 2.5 µg/mL in acetonitrile. All solutions were stored at −20 °C.
Food samples
Ice cream samples known to have been manufactured with stabiliser blends containing the contaminated food additive E410 were obtained from France, Germany, Spain, Switzerland and Poland. In total more than 100 ice creams, manufactured during 2021, were analysed and the data used to develop and validate the method. For ice cream samples delivered as individual cone or stick, a minimum of 2 to 4 items were homogenised using a mixer (Büchi B-400, Flawil, Switzerland) until a homogeneous paste was obtained. This operation was conducted with the mixer placed in cold room at 4°C to ensure that the resulting paste was maintained at < 10°C during the whole grinding process to avoid the loss of EO (temperature checked with a pre-calibrated platinum sensor (Pt-100, Julabo TD 300, Seelbach, Germany), and stored in a freezer (−20°C) before analysis. For ice cream delivered in bucket format, the test portion was taken directly from the recipient by means of a spoon.
Sample extraction
Each sample was weighed (5 g) into a 50-mL polypropylene (PP) tube (Becton Dickinson, Le Pont de Claix, France) and placed in an ice water bath. The ISTD working solution at 2.5 µg/mL (40 µL) was then added (corresponding to 0.02 mg/kg in-sample-concentration), and the resulting fortified sample thoroughly mixed on a vortex mixer to ensure that the spiked volume was totally absorbed by the matrix. Water (5 mL), saturated NaCl solution (5 mL of 370 g/L solution in water), diluted sulphuric acid (100 µL of 0.05 M solution in water) and a ceramic homogeniser (Agilent, Geneva, Switzerland) were successively added and the tube was vortexed for a few seconds. Conversion of EO to 2-CE was then conducted at 60 °C ± 2 °C for 120 min by placing the tube onto a horizontal shaking water bath (TSDUB15, Thermo Fischer Scientific, Lausanne, Switzerland). Once completed, the tube was rapidly cooled down in an ice water bath for 10 min. Extraction of 2-CE was further performed following the European Norm EN 15662:Citation2018 (QuEChERS-based procedure) with minor modifications. ACN (10 mL) was added to the tube and the resulting mixture was shaken for 1 min at 1500 rpm using a homogeniser (SPEX SamplePrep GenoGrinder, Stanmore, UK). The ready-to-use QuEChERS salts mixture was then added and the tube was immediately hand shaken to prevent the formation of lumps. After GenoGrinder shaking (3 min) and centrifugation (4000 × g, 10°C, 5 min, Heraeus Multifuge, Thermo Fisher Scientific, Bremen, Germany), an aliquot of the supernatant (6 mL) was transferred into a 15-mL PP tube already filled with MgSO4, PSA and C18 (d-SPE salts). After shaking (1 min) and centrifugation (4000 × g, 10 °C, 5 min), the supernatant (2.5 mL) was transferred into a new 15-mL PP tube and concentrated under a stream of nitrogen at room temperature to a volume of approximately 0.5 mL. The concentrated extract was further centrifuged (17000 × g, 4°C, 10 min) using a benchtop centrifuge (Heraeus Frisco 17, Thermo Scientific) and the final extract was collected into a GC amber glass vial for further GC-MS/MS analysis.
For analysis of the endogenous level of 2-CE, the hydrolysis was simply omitted, and the extraction of the 5.0 g test portion started with the addition of water (10 mL) and ACN (10 mL). The next steps followed those described above.
Quantitative analysis by GC-MS/MS
Analyses were performed on two Agilent 7010 GC-Triple Quad instruments equipped with an Agilent 7890 oven and a Multimode Inlet (MMI) injector. The GC column (DB-624 UI; 30 m × 0.25 mm × 1.4 µm), pre-column (deactivated fused silica tubing, 3 m × 0.25 mm × 0.35 mm OD) and liner (Ultra Inert, splitless, single taper, glass wool) were all procured from Agilent. The GC inlet (MMI) gradient program was set up as follows: 90 °C for 0.8 min; heat rate 720 °C/min until 250 °C (hold time 10 min). The GC oven gradient was set up as follows: 45 °C for 2 min; heat rate of 50 °C/min until 150 °C (no hold time); heat rate of 70 °C/min until 250 °C (hold time 16 min). The total run time was 21.5 min. Injection was performed in split mode (split ratio 3:1) and injection volume was 2 µL. The MS parameters were obtained in electron ionisation impact (EI) with a source temperature of 270 °C. Acquisition was performed using tandem MS in selected reaction monitoring mode (MRM) by monitoring at least two transition reactions per compound with a dwell time of 8 ms [2-CE: 80.0 → 31.0 (quantifier), 80.0 → 43.0 (qualifier) and 82.0 → 31.0 (qualifier); ISTD: 84.0 → 33.0 (quantifier) and 86.0 → 33.0 (qualifier)]. Data acquisition and subsequent data processing were carried out using Agilent Mass Hunter Data Analysis B.07.06.2704 and Agilent Mass Hunter Workstation Software Version B.09.00, respectively.
Identification criteria
The molecule 2-CE was considered as positively identified in the sample when the following criteria were fulfilled as required by SANTE/12682/2019: (1) a signal was visible at least at two diagnostic transition reactions selected for 2-CE and its ISTD; (2) the retention time of 2-CE and its ISTD in the sample extract corresponded to that of the average of the calibration solutions measured in the same sequence with a tolerance of ± 0.1 min; (3) peak area ratio from the different transition reactions recorded for 2-CE in the sample extract should correspond to that of the average of the calibration solutions measured in the same sequence with a tolerance of ± 30 %.
Quantification
The analyte 2-CE was quantified by isotopic dilution using six calibration levels ranging from 0 to 1250 ng/mL prepared in ACN (each concentration level containing ISTD at 50 ng/mL). Such a range corresponded to 0 to 0.5 mg/kg or 0 to 0.273 mg/kg in-sample-concentrations for 2-CE and EO equivalent, respectively. Calibrant solutions were freshly prepared each day of the analysis. A graph “analyte/IS area ratio” on the y-axis versus “analyte/IS concentration ratio” on the x-axis was plotted, using a 1/x2 weighing factor to improve precision at the lowest calibration points. The linearity of responses was ensured by checking that the regression coefficient R2 was greater than 0.98 and that the deviation of the back-calculated concentration of the calibrant standards from the true concentration was not greater than ± 20%.
The final equation to calculate 2-CE concentration level (w2CE in mg/kg) was as follows:
where A2-CE is the peak area of 2-CE in the sample (quantitative transition reaction); AISTD is the peak area of ISTD in the sample (quantitative transition reaction), I and S are the intercept and slope of the regression line, respectively; mISTD is the mass of ISTD added to the test portion in ng (i.e. 100 ng); msample is the mass of the test portion in g (i.e. 5 g); 1000 is the conversion factor to express concentration from µg/kg to mg/kg.
The final concentration expressed as EO equivalents in the sample (wEO, expressed in mg/kg) was calculated as follows:
where A2-CE and AEO are molecular masses of 2-CE (80.52 g/mol) and EO (44.05 g/mol), respectively.
Method validation
The method was validated on two Agilent 7010 GC-MS/MS platforms over a period of 3 weeks, with three operators involved in the validation. A selection of tubs of ice cream, ice cream cones and ice creams on a stick was used as representative samples of products available on the market. Validation was carried out at three concentration levels of 2-CE, namely 0.02, 0.04 and 0.10 mg/kg that correspond to EO at 0.011, 0.022 and 0.055 mg/kg respectively. At each level, replicates (n = 6) extracted on different occasions across the validation period were used for assessing the recovery (expressed in %) and the within-laboratory precision (RSDIR, expressed as the coefficient of variation). Recovery values were calculated from the median of spiked experiments performed under conditions of intermediate reproducibility.
GC-high resolution mass spectrometry (HRMS)
HRMS was conducted on a Q-Exactive GC Orbitrap platform coupled with a TraceTM 1300 gas chromatograph and equipped with a programmable temperature vaporizing injector, provided by Thermo Scientific (Bremen, Germany). The GC column was the same as that used for GC-MS/MS analysis. The inlet temperature was set at 90°C. The split flow was 5.0 mL/min with a split ratio at 5:1. The GC gradient was as follows: 45°C for 2 min; heat rate at 50°C/min up to 150°C followed by a rate of 70°C/min until 260°C (hold for 16 min). Total run time was 22 min. Acquisition was achieved in positive electron impact ionisation mode (EI+, 70 eV) with an ion source temperature set at 250°C. The transfer line was maintained at 280°C. Data were recorded in full scan mode (profile) with a resolving power set at 60000 FWHM at m/z 200 and the automatic gain control target defined at 106. The m/z range of the scan was 30–100. Nitrogen gas was used for the C-Trap supply.
Results and discussion
Analytical strategies and method optimisation
Several methods are already published on the analysis of EO in different food matrices, measuring either the intact level of EO, or after transformation of the parent analyte into chloroethanol, bromoethanol or iodoethanol (). As an example, the German Official Method (ASU Citation1999) applies a treatment with alkali transforming available 2-CE back to EO. The EO is then purged with nitrogen into water, followed by acid treatment with sodium iodide to afford iodoethanol which is extracted into ethyl acetate. Iodoethanol is then analysed by GC-ECD or GC-MS (single or triple quadrupole), achieving quantification limits at 0.01–0.03 mg/kg (Anastassiades, Citation2021). In a recent report published by the EU Reference Laboratories for residues of pesticides, both the intact level of EO and residual levels of 2-CE in sesame seeds are measured separately by GC-MS/MS (EURL SRM Citation2020). Considering that the GC column used in this study was not widely available and knowing the high volatility and polarity of EO, our strategy was based on the conversion of EO into 2-CE (Tateo and Bononi Citation2006) followed by QuEChERS extraction (EN 15662 Citation2018) of both endogenous and transformed 2-CE.
The hydrolytic transformation of EO into 2-CE in ice cream was completed after 2 h at 60°C in a NaCl saturated acidic medium. Chloride ions were added in large excess to favour the formation of 2-CE rather than bromoethanol or iodoethanol. Indeed, additional experiments that we conducted demonstrated that EO could be transformed into 2-bromoethanol in excess of NaBr. After salt-induced partition, the ACN extract was further cleaned using d-SPE salts comprised of MgSO4, PSA and end-capped C18. This C18 powder is known to enhance the clean-up efficiency of fatty matrices such as soft ice cream.
A concentration step at room temperature was included to reach very low sensitivity. Extra care was required at this stage since evaporation to dryness was evidenced to lead to a loss of 2-CE. An ultracentrifugation step was eventually considered to provide clear extracts, ready to be injected onto the GC system. Attempts to exchange ACN to a more GC amenable solvent (e.g. hexane) were not successful so that the final ACN extract was injected directly in the split mode (3:1 ratio). No excessive fouling of the injection part was observed. However, precautionary maintenance steps were performed and included changing the septum every 100 injections, and both the liner and the pre-column every 200 injections, ultimately leading to both retention time stability and long-term performance of the GC column.
Transition reactions monitored for the detection of 2-CE and its ISTD were as described in the EURL SRM report (Citation2020). depicts typical MRM chromatograms of a contaminated ice cream fortified with ISTD at 0.020 mg/kg. Although detected at low m/z, i.e. over a mass range where there are frequently ions from low molecular weight substances, no interferences were observed at the expected retention time irrespective of the composition of the ice cream products. The S/N ratios for both quantitative and qualitative transition reactions at 0.010 mg/kg EO equivalents were above the minimum ratios recommended by the European Commission (SANTE 12682/Citation2019).
Figure 1. GC-MS/MS chromatogram of 2-CE in an ice cream sample containing 0.017 mg/kg of EO (2-CE = 0.032 mg/kg) and its internal standard fortified at 0.020 mg/kg 2-CE
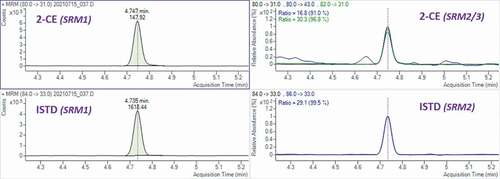
The quantification of 2-CE was performed by isotope dilution using deuterated 2H4-2-CE as ISTD. Ideally, isotopically labelled EO (e.g. ethylene-2H4 oxide) would have been preferred but its delivery and handling are challenging and cumbersome. The chosen ISTD was found to be stable (<1% of hydrogen-deuterium exchange) during sample workup despite the hydrolysis conditions (60°C, 2 h). In that context, test portions were fortified with ISTD at 0.02 mg/kg at the beginning of the sample preparation to favour a good compensation of potential losses during sample extraction in addition to possible matrix effects occurring on the GC instrument. Fortification at higher concentrations would have led to non-negligible residual amount of 2-CE considering ISTD isotopic purity (98 %) and stability during the hydrolysis step. Using the developed procedure, absolute recovery of the ISTD – regardless of the sample analysed – was above 85%.
The efficiency of the quantification by the isotope dilution approach was verified over the 0–0.5 mg/kg 2-CE range (with ISTD concentration set at 0.02 mg/kg) by comparing solvent-based and matrix-matched calibration curves. No difference between the related slopes was observed, evidencing that matrix effects are compensated when using the labelled isotopomer as internal standard. Precision on the lowest calibration curve was improved by applying a 1/x2 weighing factor. The solvent-based calibration curve (area ratios plotted against concentration ratios) followed a linear model with R2 > 0.99, and the recovery was found in the range of 87–104% across the levels investigated (0.02, 0.04 and 0.1 mg/kg of 2-CE, see ). The within-laboratory precision, assessed as RSDIR was calculated at 28% (0.02 mg/kg of 2-CE, equivalent to 0.011 mg/kg of EO), whilst <20% at the higher concentration levels.
Table 2. Performance of the GC-MS/MS method for the quantitative determination of 2-CE in ice cream by isotope dilution
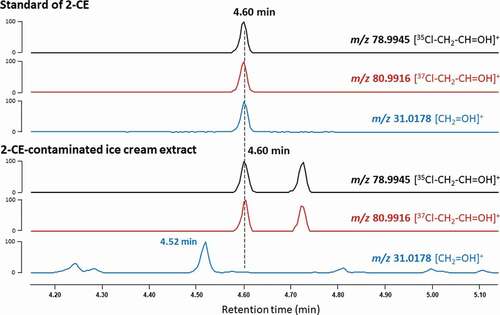
The fragment ion at m/z 31 is commonly used by GC-MS/MS for the quantification of 2-CE because it is the most prominent signal available in the MS/MS spectrum at 70 eV, thereby ensuring the best sensitivity. However, the mass is observed in many compounds that contain carbon and oxygen atoms, particularly alcohols, and therefore can be considered unspecific. Consequently, the trace of the signal at m/z 31 in the profile of food extracts may exhibit interferences that co-elute or reside in close proximity to 2-CE. To ascertain the specificity of the signal of 2-CE, ice cream extracts were injected on a high resolution GC-Orbitrap platform. As expected, the fragment ion of 2-CE is observed at m/z 31.0178, assigned to the ion [CH2=OH]+. Meanwhile, the fragment ions at m/z 78.9945 and m/z 80.9916, also shown in the standard of 2-CE, correspond to the fragments [35Cl-CH2-CH=OH]+ and [37Cl-CH2-CH=OH]+, respectively. These three signals coelute in the chromatographic profile of the 2-CE standard (retention time at 4.6 min, see ). They are also present in the chromatographic profile of contaminated ice cream samples; however, due to the higher background “noise” in this low mass range, as well as a prominent interference at 4.52 min, care needs to be taken to avoid misinterpretation due to poor chromatographic resolution. This emphasises the importance of appropriate chromatographic conditions to avoid any interferences that may lead to an overestimation of the amount of 2-CE in food samples by GC-MS/MS.
Figure 2. GC-HRMS chromatograms of a chemical standard of 2-CE (top) and an ice cream extract contaminated with 2-CE (bottom). Two chlorine atom-derived fragment ions at m/z 78.9945 (from 35Cl) and m/z 80.9916 (from 37Cl) are shown as well as the ion at m/z 31.0178
EO in ice cream samples and interlaboratory comparison
To validate this analytical strategy, ice cream samples (n = 23) were analysed in our laboratory and in parallel by an ISO 17025 accredited service laboratory located in France (), that applied analysis by isotope dilution GC-MS/MS. More details on the methodology used by the service laboratory are, however, unknown.
Figure 3. Correlation of EO levels measured by two independent laboratories (n = 23). Note, some data points (n = 7) are superimposed at the origin (below LoQ)
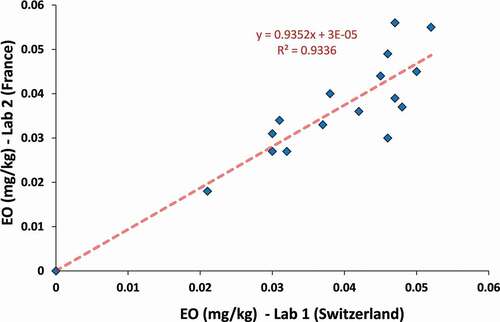
Seven out of 23 ice cream samples were reported with <0.010 mg/kg EO concentration levels by both laboratories. EO in the remaining samples was found over a range of 0.021–0.052 mg/kg (laboratory 1), or a range over 0.018–0.056 mg/kg (laboratory 2), with individual deviations from −19% to 35% (median: 10%), in accord with the usual measurement uncertainties for pesticide residues analysis. In other words, the proposed methodology demonstrated comparable results obtained by both laboratories.
Fate of EO and 2-CE under thermal conditions
To our knowledge there is very little data available in the scientific literature on the stability of 2-CE during food processing. Experiments pertaining to the stability of 2-CE under typical roasting and baking conditions are reported by the EU Reference Laboratory for Single Residue Methods (EURL SRM Citation2020). At such higher cooking temperatures, typically at around 180°C or above, 2-CE is rapidly converted to acetaldehyde most likely via the loss of HCl and subsequent keto/enol tautomerism of vinyl alcohol (EURL SRM Citation2020).
Manufacturing ice cream involves several process steps, including thermal treatment above 50°C during mixing, homogenisation and pasteurisation steps. The mixing process is usually conducted at temperatures ranging from 55°C to 65°C in an open vessel for longer time (up to 45 min), so a highly volatile molecule such as EO is expected to rapidly dissipate and/or bind to ice cream constituents. Higher temperatures are reached during pasteurisation (up to 86°C) albeit over a short period of time, typically up to 25 seconds.
To determine the impact of thermal conditions in an ice cream matrix, EO and CE were spiked in selected ice creams without detectable EO in an open vessel. The experiments were conducted with and without acid hydrolysis, either at low temperature (4°C, 1 h), or 60°C for 45 min followed by 85°C for 25 seconds. As portrayed in , the EO in heated ice cream is not recovered (EO + 2-CE with hydrolysis, <0.010 mg/kg), and can therefore be expected to mainly dissipate during the manufacturing process. Without heat treatment, only ca 50% of the EO is recovered. The same experiment without hydrolysis demonstrates that no conversion of EO to 2-CE has taken place in the ice cream matrix, independent of the thermal conditions.
Figure 4. Fate of EO and 2-CE under different thermal conditions. Ice cream was fortified at 0.5 mg/kg EO or 1 mg/kg 2-CE before heat treatment and analysis. Results are expressed in EO equivalent (n = 3 independent determinations)
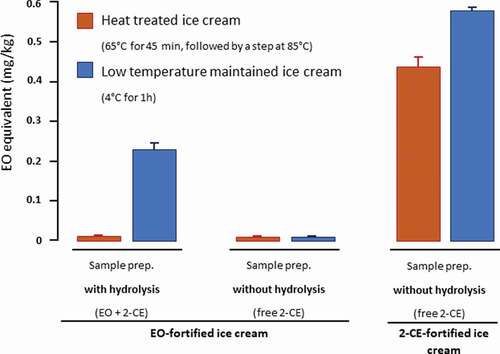
In the case of ice cream fortified with 2-CE, over 80% of the analyte could be recovered when heated to 60/85°C. This result is not unexpected, as 2-CE has a far higher boiling point (129 °C) than EO, is relatively stable under typical baking or cooking conditions, fully decomposing at only very high temperatures above 400°C (Skingle and Stimson Citation1976).
Ratio of EO versus 2-CE in ice cream
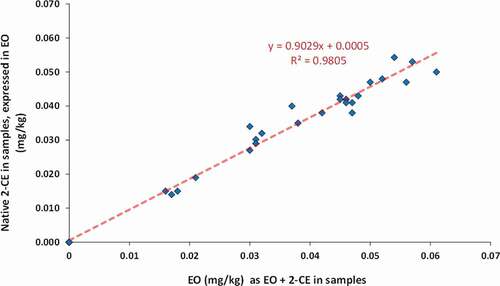
To verify the purported absence of the parent molecule EO in contaminated ice cream, 32 samples were re-analysed without the hydrolysis step to determine the 2-CE content. The amount of EO equivalent levels (measured as EO + 2CE) ranged from 0.016 to 0.061 mg/kg. As depicted in , the correlation between EO (as EO + 2 CE) and native 2-CE concentration levels demonstrates that only 2-CE is present in the ice cream samples, in accord with what was recently reported for sesame seeds by the German Federal Institute for Risk Assessment (BfR Citation2020, Citation2021).
Figure 5. EO levels determined with or without conversion of EO to 2-CE during extraction in n = 32 ice cream samples. Levels are expressed in EO equivalent
The same analytical approach was conducted on seven stabiliser blends known to be the source of the contamination and used as ingredients in ice cream manufacture. Also in this case, only the endogenous 2-CE level contributes to the final result expressed in EO equivalents (data not shown).
Risk assessment of 2-CE considering the analytical findings in ice cream
It is well established that no safe level of exposure can be derived for genotoxic carcinogens such as EO (ECHA Citation2013). Accordingly, the exposure level must be as low as reasonably achievable (ALARA). In the case of 2-CE, little is known about its oral toxicology, which was already questioned in the 1960s (Wesley et al. Citation1965). Around the same time, Johnson (Citation1967a, Citation1967b) studied the metabolism of 2-CE in rats, showing the conversion of 2-CE to S-carboxymethyl-glutathione by rat liver in vivo and in vitro. In this study, female rats (only n = 6 per group) were exposed from weaning to the age of 24 months and no unusual features were found in the histological examination of main organs (liver, kidneys, adrenals, lungs, spleen, stomach, brain, thymus, thyroid and pancreas) up to 16 mg/kg bw/day. Later, in 1983, Dunkelberg performed another oral carcinogenic study in rats and similarly concluded that no carcinogenic effect could be determined (Dunkelberg Citation1983). Furthermore, a National Toxicology Program (NTP) carcinogenicity study in rodents by dermal exposure was also negative (NTP Citation1985).
In terms of the mode of action, the genotoxic profile of 2-CE is not well established. Conversion of 2-CE to chloroacetaldehyde, an active metabolite, has been reported after a single oral dose in rats (Grunow and Altmann Citation1982). This research group found no traces of S-carboxymethyl-glutathione in the urine and suggested that chloroacetaldehyde and chloroacetic acid are predominantly conjugated and inactivated by reaction with glutathione. The mutagenic potential of 2-CE in Ames assays is equivocal and in vitro clastogenicity has been reported in the literature (Tennant et al. Citation1987). Based on these findings, the Scientific Committee on Food concluded that 2-CE is a weak genotoxic agent in vitro and devoid of detectable effects in vivo (SCF Citation2002). Furthermore, the SCF estimated that a threshold approach can be applied due to absence of carcinogenicity in laboratory animals.
The German BfR conducted a preliminary toxicological assessment of 2-CE (BfR Citation2020), stating that no threshold value can be established for 2-CE nor a reliable statement can be made as to the carcinogenic properties of 2-CE, essentially due to the lack of toxicological studies. The BfR argues that a possible direct mutagenic mechanism of action cannot be excluded as is typical for electrophilic alkylating agents. The BfR considered, however, that there are no indications that the toxic potency of 2-CE surpasses that of EO. Nevertheless, it is questionable why the German agency ignored the three rodent cancer studies mentioned above, particularly the two conducted via oral route, despite some limitations.
Other potential sources of 2-CE
The question of alternative sources of 2-CE, i.e. unrelated to the use of EO as a fumigant, was raised in the EURL SRM (Citation2020) report on the analysis of EO and 2-CE in sesame seeds. The rather frequent occurrence of low amounts of 2-CE (<0.1 mg/kg) that can be defined as “background levels” warrants further study. The authors argue that specifically for sesame seeds, low levels may be due to factors such as cross-contamination, e.g. between lots, during processing, storage or transport.
The contaminated ice cream batches tested in our laboratory revealed the absence (<0.01 mg/kg) of the parent compound EO, hence only 2-CE could be quantified. Alternative routes besides pesticide application to the formation of 2-CE is the reaction of ethylene with chlorine and water. The additive chlorination of olefins is well described in the literature (Asinger Citation1968) and residual hypochlorous acid may rapidly add to the olefinic double bond resulting in 2-CE (). Hypochlorite is used widely as a disinfectant of water, and ethylene is an important and widespread plant hormone, which implies that in certain cases the finding of trace amounts of 2-CE may not always be associated with the use of EO as a fumigant. Research into this theoretical pathway is currently lacking and warrants attention.
Figure 6. Possible chemical and biological pathways to EO and 2-CE from ethylene

Ethylene is a phytohormone that affects the developmental and fruit ripening process in plants. Large amounts are also produced by plants under stress-related conditions such as infection, water stress etc., reaching in some cases up to 0.34 mg/kg fresh weight of plant material per hour (Ievinsh and Ozola Citation1997).
A proportion of the ethylene synthesised by plants can be oxidised by enzymes present in plant tissues to furnish EO (Golden and Williams Citation2014). In vitro studies on broad beans (Vicia faba) using either a cell free system or developing cotyledons demonstrated that EO is a major metabolite of ethylene (Jerie and Hall Citation1978; Dodds et al. Citation1979). Smith et al. (Citation1985) proposed catalysis to EO by a cytochrome P-450 enzyme, isolated from the microsomal fraction of Vicia faba and showing a high affinity for ethylene. EO has been reported to delay ripening of fruits, working antagonistically to ethylene.
The amounts of EO that accumulate naturally in plant tissues and are further metabolised is poorly understood, possibly due to only traces found in most plants, and/or the earlier lack of sensitive methods to measure the analyte reliably and identify the main chemical conversion products. Contributions of EO/2-CE from different sources will need consideration when taking risk management decisions, particularly in those cases where the levels detected are very low (e.g. <0.1 mg/kg), and the use of EO as fumigant across the supply chain cannot be verified (EURL SRM Citation2020). More performant and sensitive analytical methods - as described in this study - will be required to address these aspects.
Conclusion
This is the first report that describes a robust and sensitive analytical method to determine residues of EO at trace amounts in contaminated ice cream. The approach that we applied is relatively straightforward, revealing that essentially no EO residue remains in the ice cream due to transformation to the major metabolite, namely 2-CE. Possibly the formation of 2-CE already occurred during the processing of locust bean gum, as only 2-CE could be detected in the stabiliser. The study also demonstrates that 2-CE is relatively stable when exposed to thermal conditions as typically encountered during the ice cream manufacturing process, hence a further reduction of 2-CE due to processing cannot be expected. The finding of exclusively 2-CE and not EO in the contaminated ice cream is novel and raises important questions related to risk assessment. In this context, there is no conclusive evidence of 2-CE carcinogenicity in rodent models – the only available studies, even if limited for a food risk assessment, showed no carcinogenicity in animals. Considering the many recent RASFF alerts on the occurrence of EO in different foods, the development of performant analytical methods is urgently needed so that sufficient and reliable data can be acquired to conduct a thorough and meaningful dietary risk assessment, taking into account all possible sources of exposure.
Acknowledgments
The authors express their gratitude to Stéphanie Laborie, Nestlé Quality Assurance Centre in Cergy (France), for preliminary work on the sample preparation. Special thanks to Lisa McCooey and Matthias Casanova for their valuable input and critically reviewing the manuscript.
Disclosure statement
No potential conflict of interest was reported by the author(s).
References
- Aitkenhead P, Vidnes A. 1988. Simple and accurate method for determination of ethylene chlorohydrin in dried spices and condiments. J Assoc Off Anal Chem. 71:729–731. doi:https://doi.org/10.1093/jaoac/71.4.729.
- Anastassiades M 2021. 11th international akademie fresenius conference “Pesticide residues in food”, 28-29.06.2021, Mainz, Germany. Presentation entitled “The ethylene oxide crisis – causes and response”.
- Asinger F. 1968. Chapter 6, the chlorination of the olefins. In: Mono-olefins, chemistry and technology. Elsevier Ltd.; p. 506–627. ISSN/ISBN: 9780080115474. doi:https://doi.org/10.1016/C2013-0-01941-X.
- [ASU] Amtliche Sammlung von Untersuchungsverfahren. 1999. Amtliche Sammlung von Untersuchungsverfahren nach § 64 LFGB. BVL L 53.00-1: 1999-11.Untersuchung von Lebensmitteln - Gaschromatographische Bestimmung von Ethylenoxid und 2-Chlorethanol in Gewürzen. https://www.beuth.de/de/technische-regel/bvl-l-53-00-1/30303404 .
- [BFR] Bundesinstitut für Risikobewertung Opinion No 056/2020, 23 December 2020. Health risk assessment of ethylene oxide residues in sesame seeds. https://www.bfr.bund.de/cm/349/health-risk-assessment-of-ethylene-oxide-residues-in-sesame-seeds.pdf .
- [BFR] Bundesinstitut für Risikobewertung updated Opinion No 024/2021 issued 20 July 2021. Gesundheitliche Bewertung von Ethylenoxid-Rückständen in Sesamsamen. https://www.bfr.bund.de/cm/343/gesundheitliche-bewertung-von-ethylenoxid-rueckstaenden-in-sesamsamen.pdf .
- Bononi M, Quagliab G, Tateo F. 2014. Identification of ethylene oxide in herbs, spices and other dried vegetables imported into Italy. Food Addit Contam A. 31:271–275. doi:https://doi.org/10.1080/19440049.2013.872808.
- [EC] Commission Regulation (EC) 396/2005 of the European Parliament and of the Council of 23 February 2005 on maximum residue levels of pesticides in or on food and feed of plant and animal origin and amending Council Directive 91/414/EECText with EEA relevance. Off J Eur Union. L 70. https://eur-lex.europa.eu/legal-content/EN/TXT/PDF/?uri=CELEX:32005R0396&from=EN .
- [EC] Commission Regulation (EC)178/2002 of the European Parliament and of the Council of 28 January 2002 laying down the general principles and requirements of food law, establishing the European Food Safety Authority and laying down procedures in matters of food safety. Off J Eur Union L. 31/1. https://eur-lex.europa.eu/legal-content/EN/TXT/PDF/?uri=CELEX:32002R0178&from=EN .
- [EC] Commission Regulation (EU) 2015/868 of 26 May 2015, amending Annexes II, III and V to Regulation (EC) No 396/2005 of the European Parliament and of the Council as regards maximum residue levels for 2,4,5-T, barban, binapacryl, bromophos-ethyl, camphechlor (toxaphene), chlorbufam, chloroxuron, chlozolinate, DNOC, di-allate, dinoseb, dinoterb, dioxathion, ethylene oxide, fentin acetate, fentin hydroxide, flucycloxuron, flucythrinate, formothion, mecarbam, methacrifos, monolinuron, phenothrin, propham, pyrazophos, quinalphos, resmethrin, tecnazene and vinclozolin in or on certain products. Off J Eur Union. L 145/1. https://eur-lex.europa.eu/legal-content/EN/TXT/PDF/?uri=CELEX:32015R0868&from=EN.
- [EC] Commission Regulation (EU) 2020/1540 of 22 October 2020, amending Implementing Regulation (EU) 2019/1793 as regards sesamum seeds originating from India. Off J Eur Union. L 353/4. https://eur-lex.europa.eu/legal-content/EN/TXT/PDF/?uri=CELEX:32020R1540&from=EN .
- Dodds JH, Musa SK, Jerie PH, Hall MA. 1979. Metabolism of ethylene to ethylene oxide by cell-free preparations from Vicia faba L. Plant Sci Lett. 17:109–114. doi:https://doi.org/10.1016/0304-4211(79)90169-X.
- Du X, Zhang W, Liu B, Liu T, Xiao Y, Taniguchi M, Ren Y. 2019. Optimization and validation of HS-SPME-GCMS method for determination of multifumigant residues in grain, oilseeds, nuts, and dry fruit. J AOAC Int. 102:1877–1883. doi:https://doi.org/10.5740/jaoacint.18-0093.
- Dunkelberg H. 1983. Carcinogenic activity of ethylene oxide and its reaction products 2-chloroethanol, 2-bromoethanol, ethylene glycol and diethylene glycol. II. Testing of 2-chloroethanol and 2-bromoethanol for carcinogenicity. Zbl Bakr Hyg I Abr Orig B. 177:269–281.
- [EC] European Commission. 2021. Summary record of the food and feed crisis coordinators meetings of 29 June 2021, 30 June 2021 and 13 July 2021 on the presence of ethylene oxide above the limit of quantification in locust bean gum (food additive E410). https://ec.europa.eu/food/system/files/2021-07/rasff_ethylene-oxide-incident_e410_crisis-coord_sum.pdf .
- [ECHA] European Chemicals Agency. 2013. Substance evaluation conclusion document as required by REACH article 48 for ethylene oxide. Substance Evaluation Conclusion document EC No 200-849-9. https://echa.europa.eu/documents/10162/4a2a31f6-aa6b-41f0-5f10-2e4eca6c6fe9 .
- [EN] European Standard. 2018. EN 15662. Foods of plant origin – Multimethod for the determination of pesticide residues using GC- and LC-based analysis following acetonitrile extraction/partitioning and cleanup by dispersive SPE – Modular QuEChERS-method.
- [EURL] EU Reference Laboratories for Residues of Pesticides SRM. 2020. Community reference laboratory for single residue methods. Analytical observations report “Analysis of ethylene oxide and its metabolite 2-chloroethanol by the QuOil or the QuEChERS method and GC-MS/MS. Version 1.1., 2020. https://www.eurl-pesticides.eu/library/docs/srm/EurlSrm_Observation_EO_V1.pdf .
- European Parliament Note. 2021. “At a glance”, “Recalls of sesame seed products due to pesticide residues”. https://www.europarl.europa.eu/RegData/etudes/ATAG/2021/679077/EPRS_ATA(2021)679077_EN.pdf .
- Gilsbach W, Weeren RD. 1999. Interlaboratory validation study of a GC method for ethylene oxide and ethylene chlorhydrine determination in spices of pepper and chili. Dtsch Lebensm Rundsch. 95:83–90.
- Golden KD, Williams OJ. 2014. Ethylene oxide in plant biological systems: a review. Asian J Biol Sci. 7:144–150. doi:https://doi.org/10.3923/ajbs.2014.144.150.
- Grunow W, Altmann H-J. 1982. Toxicokinetics of chloroethanol in the rat after single oral administration. Arch Toxicol. 49:275–284. doi:https://doi.org/10.1007/BF00347875.
- Ievinsh G, Ozola D. 1997. Ethylene and the defense against endogenous oxidative stress in higher plants. In: Kanellis AK, Chang C, Kende H, Grierson D, editors. Biology and biotechnology of the plant hormone ethylene. Kluwer Academic Publishers; p. 217–228. doi:https://doi.org/10.1007/978-94-011-5546-5_28.
- Jensen KG. 1988. Determination of ethylene oxide residues in processed food products by gas-liquid chromatography after derivatization. Z Lebensm Unters Forsch. 187:535–540. doi:https://doi.org/10.1007/BF01042385.
- Jerie PH, Hall MA. 1978. The identification of ethylene oxide as a major metabolite of ethylene in Vicia faba L. Proc R Soc Lond B. 200:894–897. doi:https://doi.org/10.1098/rspb.1978.0006.
- Johnson MK. 1967a. Metabolism of chloroethanol in the rat. Biochem Pharmacol. 16:185–199. doi:https://doi.org/10.1016/0006-2952(67)90199-2.
- Johnson MK. 1967b. Detoxication of ethylene chlorohydrin. Fd Cosmet Toxicol. 5:449. doi:https://doi.org/10.1016/S0015-6264(67)83141-9.
- [NTP] National Toxicology Program. 1985. Toxicology and Carcinogenesis studies of 2-chloroethanol (ethylene chlorohydrin) (CAS No. 107-07-3) in F344/N rats and Swiss CD-1 mice (dermal studies). National Toxicology Program, Technical Report Series No. 275. https://ntp.niehs.nih.gov/ntp/htdocs/lt_rpts/tr275.pdf .
- [RASFF] Rapid Alert System for Food and Feed notification number 2021.2966. Ethylene oxide in Lygomme FM 4605 stabilizer from Turkey used in ice cream made in Spain. First notified Jun 8.
- [RASFF] Rapid Alert System for Food and Feed notification number 2021.3882. Non authorized substance (ethylene oxide) in ice cream products produced with Lygomme FM 3630 stabilizer from France. First notified Jul 22.
- [RIVM and WSFR] Rijksinstituut voor Volksgezondheid en Milieu and Wageningen Food Safety Research . 2020. Risk assessment of ethylene oxide in sesame seeds. Front office food and product safety. https://www.rivm.nl/sites/default/files/2020-11/FO%20beoordeling%20ethyleenoxide%20in%20sesamzaad_final_20201025_anon.pdf .
- SANTE: Directorate-General for Health and Food Safety (SANTE). 2019. SANTE/12682/2019. Guidance document on analytical quality control and method validation procedures for pesticide residues and analysis in food and feed. https://www.eurl-pesticides.eu/userfiles/file/EurlALL/AqcGuidance_SANTE_2019_12682.pdf .
- [SCF] Scientific Committee on Food. 2002. Opinion of the Scientific Committee on Food on Impurities of 1,4-dioxane, 2-chloroethanol and mono- and diethylene glycol in currently permitted food additives and in proposed use of ethyl hydroxyethyl cellulose in gluten-free bread. https://ec.europa.eu/food/system/files/2020-12/sci-com_scf_out156_en.pdf .
- Skingle DC, Stimson VR. 1976. The thermal decomposition of 2-chloroethanol. Aust J Chem. 29:609–615. doi:https://doi.org/10.1071/CH9760609.
- Smith PG, Venis MA, Hall MA. 1985. Oxidation of ethylene by cotyledon extracts from Vicia faba L.: cofactor requirements and kinetics. Planta. 163:97–104. doi:https://doi.org/10.1007/BF00395903.
- Tateo F, Bononi M. 2006. Determination of ethylene chlorohydrin as marker of spices fumigation with ethylene oxide. J Food Compos Anal. 19:83–87. doi:https://doi.org/10.1016/j.jfca.2004.12.003.
- Tennant RW, Margolin BH, Shelby MD, Zeiger E, Haseman JK, Spalding J, Caspary W, Resnick M, Stasiewicz S, Anderson B. 1987. Prediction of chemical carcinogenicity in rodents from in vitro genetic toxicity assays. Science. 236:933–941. doi:https://doi.org/10.1126/science.3554512.
- Wesley F, Rourke B, Darbishire O. 1965. The formation of persistent toxic chlorohydrins in foodstuffs by fumigation with ethylene oxide and with propylene oxide. J Food Sci. 30:1037–1042. doi:https://doi.org/10.1111/j.1365-2621.1965.tb01883.x.
- Woodrow JE, McChesney MM, Seiber JN. 1995. Determination of ethylene oxide in spices using headspace gas chromatography. J Agric Food Chem. 43:2126–2212. doi:https://doi.org/10.1021/jf00056a031.