
ABSTRACT
This research examined the intakes of six low- and no-calorie sweeteners (LNCS) (acesulfame-K, aspartame, cyclamate, saccharin, steviol glycosides, and sucralose) by the Brazilian population using an added sugar substitution approach. Detailed exposure modelling requires the use of proprietary concentration data, which can be difficult to obtain. Two exposure models were conducted using nationally representative food consumption data. The first model (‘per person’) estimated added sugar intakes on an individual person basis, replacing 50% of added sugar intakes >10% total energy with each LNCS considering sucrose sweetness equivalence. The second model (‘per food’) replaced 50% of the added sugar content in foods and beverages with each LNCS, incorporating sucrose sweetness equivalence and Brazilian tonnage data. Both models predicted that intakes would be below the JECFA ADI for five of the six LNCS in all population groups examined (≥10 years) for average and heavy consumers. For cyclamate, exceedance of the ADI was determined for all age groups amongst heavy consumers in the ‘per person’ model, while estimated intakes in the ‘per food’ model were below or reached the ADI for the cohort. Additional research is needed for younger age groups to confirm whether these findings are applicable to the entire Brazilian population.
Introduction
In 2015, the World Health Organization (WHO) published guidelines recommending a reduction in the level of free sugars in the diet to less than 10% of total energy (TE) intake, with some evidence that this recommendation should be as low as 5% (WHO Citation2015). The Brazilian Ministry of Health had previously published a similar cut-off of 10% TE in the 2006 Food Guide for the Brazilian Population (Ministry of Health, Brazil Citation2006); this guide, revised in 2015, reiterated the need to restrict sugar intake, but did not put a numerical value on the limit (FAO Citation2014, 2021; Ministry of Health, Brazil Citation2015). More recently, in 2017, the Brazilian Minister for Health made a series of SMART (specific, measurable, achievable, relevant, and time-bound) commitments within the context of the United Nations (UN) Decade of Action on Nutrition, which included the proposal to reduce the regular consumption of soda and artificial juice by at least 30% in the adult population by 2019 as a means of reducing excessive sugar consumption (Ministry of Health, Brazil Citation2017).
One of the approaches which may be utilised by consumers to reduce excessive sugar intakes is the substitution of processed foods containing added sugar with those containing low- and no-calorie sweeteners (LNCS). For this reason, it is important to monitor exposure to LNCS to assess the potential risk of exceeding the established acceptable daily intakes (ADIs).
Recently, Martyn et al. (Citation2018) conducted a comprehensive review characterising global exposure estimates for seven LNCS (acesulfame-K, aspartame, cyclamate, saccharin, steviol glycosides, sucralose, and thaumatin). Although none of the studies reviewed indicated an exceedance of the respective ADIs in the jurisdictions covered, the authors noted a lack of data in a number of regions, including Brazil, despite availability of national consumption data. It was recommended that intake assessments be conducted using these data, as this would add significant value to the body of evidence for the Latin American region.
Obtaining robust data on LNCS presence and use levels for all foods and beverages in a particular market can be challenging due to both the proprietary nature of this information, depending on the prevalence of use in food categories and specific products on the market. One such study was recently completed by Barraj et al. (Citation2021), which utilised LNCS usage rates and market share data reported by fifteen different industry members that are part of a Brazilian association representing the industry. The current analysis sought to examine an alternative methodology for determining LNCS intakes that does not require LNCS concentration levels, but rather utilises a substitution approach for added sugars. The Brazilian National Dietary Survey conducted by the Instituto Brasileiro de Geografia e Estatistica (IBGE) is well-suited for this research, as it includes concentration data for Açúcar de adição—added sugar—in foods and beverages consumed by the Brazilian population.
The objective of this study was to use a tiered approach to examine the impact of replacing added sugar in the diets of the Brazilian population with six LNCS (acesulfame-K, aspartame, cyclamate, saccharin, steviol glycosides, and sucralose). The LNCS intake estimates were derived using data on added sugar intakes in the Brazilian population and levels of added sugar in food in conjunction with data for each LNCS on sucrose sweetness equivalence and usage patterns on the Brazilian market. The resulting intake estimates were compared to their respective ADIs established by the Joint FAO/WHO Expert Committee on Food Additives (JECFA) for all population groups.
Materials and methods
Food consumption data
POF INA 2008–2009
Food and beverage consumption data used in the assessment were based on the National Dietary Survey (Inquérito Nacional de Alimentação [INA]) component of the Pesquisa de Orcamenos Familiares (POF; Household Budget Survey 2008–2009) conducted by the IBGE. A subsample of the households (25%; n = 13,569) was randomly selected to provide food consumption data, which was equivalent to approximately 34,003 individuals (de Souza et al. Citation2013; IBGE Citation2014).
Information on food consumption was collected from individuals over 10 years of age (n = 34,003) via food diaries on two non-consecutive days, recording all food and beverages (except water) consumed inside and outside of the home. Further details on the data collection are available elsewhere (IBGE Citation2010a, Citation2010b, Citation2010c, Citation2011). Consumption data for all individuals and both recording days were included in the current analyses. As no consumption data are available for individuals <10 years of age in the Brazilian population, it was not possible to assess added sugar or LNCS intakes in younger population groups.
Added sugar intakes
Consumption data were stored in a specifically designed programcomprised of approximately 1,500 food and drink items from the 2002–2003 POF database; the program also contained methods of preparation and pre-defined portion sizes (cited in de Souza et al. Citation2013). Data on the added sugar content of foods consumed by participants of the INA were obtained from the POF Nutrition Composition Tables, based on the ‘Added sugar’ variable (Açúcar de adição), which is directly linked to the food and beverage consumption data in the POF database. This variable includes both sugar present in processed foods, as well as sugar added by survey participants. It does not include sugar naturally present in fruit juices. The main added sugar-containing foods were identified as sugars and syrups, candies, desserts, honey, sweetened drinks, cakes, guava paste, and preserves. The content of added sugar was identified for all foods consumed during the survey period.
LNCS concentration and presence
LNCS sucrose sweetness equivalence
The substitution of added sugar with LNCS was based on the sweetness equivalence of the respective LNCS compared with sucrose (JECFA Citation2010; Chattopadhyay et al. Citation2014). Sweetness equivalence is defined as the amount of sucrose, in grams, which is equivalent to 1 gram of LNCS. For example, 1 gram of sucralose is equivalent to 600 grams of sugar, resulting in a sweetness equivalence value of 600. The sweetness equivalence values utilised for each LNCS relative to sucrose are provided in .
Table 1. Sweetness equivalence of six LNCS
LNCS usage patterns
For the refined modelling approach, usage patterns of LNCS in the Brazilian market were used in conjunction with the sweetness equivalence data in order to yield more realistic intake estimates of the six LNCS in the total Brazilian diet. To achieve this, a market research database (‘Passport Ingredients’) available from Euromonitor International was used to obtain information on the consumption volume in tonnes of each LNCS in the Brazilian market by food category for the year 2017 (Euromonitor International Citation2021). The methodology for the collection of tonnage data in this database is described as a bottom-up method, whereby detailed recipes of key products are used to determine consumption volumes of ingredients in food. This is followed by data validation by vital industry figures such as ingredient companies, brand manufacturers, and trade associations.
Data were obtained for the total tonnage of each of the six LNCS used in three main food and beverage categories: ‘soft drinks’, ‘dairy products and alternatives’, and ‘other’, the latter of which was defined as all other foods and beverages with added sugar. Due to the significance of the soft drinks category relative to sugar intakes (FAO Citation2014, 2021; Ministry of Health, Brazil Citation2015, Citation2017) and availability of data, the category was further refined to ‘cola-carbonates’, ‘non-cola carbonates’, ‘juice’, ‘concentrates’, ‘bottled water’, ‘energy drinks’, and ‘sports drinks’. When there were no available tonnage data for a LNCS in one of the ‘soft drinks’ or ‘dairy products and alternatives’ categories, it was assumed that the LNCS is not used in that particular food category in Brazil. In the absence of specific tonnage data for ‘other’ food categories, a standard weighted fraction was derived based on the available tonnage data, by dividing the tonnage for each LNCS by the total tonnage for all six LNCS. Tonnage data applied in this model (provided in ), which represented usage patterns of LNCS in each food category on the Brazilian market, is based on the proportion of each LNCS out of the tonnage data of total LNCS used in the respective product category. For example, acesulfame K accounted for 13.98% of the total volume of total LNCS in cola carbonates, while aspartame had the highest contribution, at 51.72%.
Table 2. Brazilian 2017 tonnage data of LNCS per food group (Euromonitor International Citation2021)
Exposure Assessment Methodology
Two models were used to determine LNCS intakes:
‘Per person’ replacement model (Scenario 1): An average daily intake of added sugar was determined for each participant over the two survey days. Individuals with an average added sugar intake value >10% TE were identified and isolated. Half (50%) of this ‘excess’ added sugar intake was replaced with each LNCS based on sucrose sweetness equivalence (). A fraction of 50% was selected to account for potential replacement of excessive sugar in the diet by an individual using various foods and beverages, containing a range of LNCS. The daily intake of the LNCS was calculated for each person.
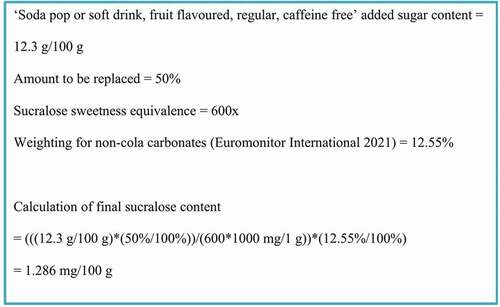
‘Per food’ replacement model (Scenario 2): The added sugar content of all foods and beverages in the POF INA 2008–2009 dataset was adjusted such that 50% of the level was substituted with a specified amount of LNCS. This LNCS amount was based on sucrose sweetness equivalence () and tonnage data () to reflect usage patterns of that sweetener in Brazil. The calculated use levels were then applied to representative food codes attributed to the food categories associated with the tonnage data. A sample calculation for the determination of the sucralose content for the food code ‘Soda pop or soft drink, fruit flavoured, regular, caffeine free’ is provided as an example in . As no LNCS usage in juice was identified in Brazil according to the 2017 tonnage data, the added sugar content in food codes representative of 100% juice sweetened with sugar (as well as nectars by association) was not replaced by LNCS in this model. Furthermore, food codes described as containing LNCS but that had no associated added sugar level were not included in this ‘per food’ added sugar replacement model.
Figure 1. Example calculation for the ‘per food’ replacement model for sucralose.
Statistical Methods and Data Analysis
In both assessments, calculations for the mean, 90th and 95th percentile intakes of the six LNCS were performed for the following population groups: adolescents (ages 10 to 19 years), young adults (ages 20 to 39 years), adults (ages 40 to 59 years), elderly (ages 60 years and older) and total population (all ages available; ages 10 and older). Estimates for the intake of added sugars and/or LNCS were generated using consumption data from individual dietary records, detailing food items ingested by each survey participant on each of the survey days. Values for estimated intakes represent projected two-day averages for each individual from Days 1 and 2 of the POF, including individuals with reported consumption on only 1 of the 2 survey days. Two days of subject data were used, where available, to incorporate individual exposure over multiple days—rather than a single day only. While the latter may be considered more complete from a participant engagement perspective, it is more reflective of acute exposure, whereas the inclusion of multiple days may be considered representative of chronic exposure, which is relevant in the case of the ADI values set for LNCS (EFSA Citation2006, Citation2011). The approach reflects the approach taken in the European Food Safety Authority (EFSA) Comprehensive European Food Consumption Database in exposure assessments (EFSA Citation2011). The distribution from which mean and percentile intake estimates were produced was comprised of these average amounts. Dietary exposure estimates are presented for the consumer population only, as these are most relevant to risk assessment. It should be noted that the ‘consumer’ population differs between exposure assessment models, as detailed below. Exposure levels for each LNCS were compared to the corresponding ADIs established by JECFA (WHO Citation2019).
‘Per person’ model (Scenario 1) – added sugar and LNCS intake
Statistical analyses and data management were conducted using SAS software (version 9.4, SAS Institute Inc., Cary, NC). A daily estimate for added sugars was determined for all individuals in the dataset, as every participant reported consumption of added sugar during the two-day recording period. Estimates for the intake of each LNCS were determined following replacement of 50% of the ‘excessive’ added sugar (defined as the proportion of added sugar [g day−1] which exceeded the cut-off of 10% TE) with each LNCS, based on the sweetness equivalence when compared with sucrose (). LNCS intakes were determined for only those individuals identified as having added sugar intakes >10% TE (consumers only).
‘Per food’ model (Scenario 2) – LNCS intake
Statistical analyses and data management were conducted using DaDiet software (Dazult Ltd Citation2018). Food codes representative of the food categories associated with the tonnage data (soft drinks, dairy products and analogues, others) were selected from the 2008–2009 POF INA and grouped according to the applicable food category. The added sugar content was identified for each food code, and 50% of the content was replaced by the respective LNCS, which incorporated sucrose sweetness equivalence and tonnage data (see for example calculation). Estimates for the intake of LNCS by the Brazilian population following replacement of 50% added sugar in foods and beverages was generated using consumption data from individual dietary records, detailing food items ingested by each survey participant on each of the survey days. ‘Consumer-only’ intake refers to the estimated intake of LNCS following the replacement of added sugar by individuals identified as consuming food products containing added sugar.
Results
Usage patterns of LNCS in foods and beverages
illustrates the use of various LNCS across a number of key beverage and food categories in Brazil. As mentioned above, the soft drinks category was split into subgroups based on the importance of sugar and LNCS intake from these products. With respect to the patterns of use, aspartame had the highest frequency of use in carbonated drinks (cola and non-cola) (50.24; 51.72%), as well as dairy products and alternatives (57.58%), while sucralose was most frequently used in bottled waters (53.90%). Cyclamate accounted for almost half of the LNCS used in concentrates (45.99%), while steviol glycosides was the only LNCS type reported to be used in energy drinks (100%). No sweeteners were reported to be used in juices. As noted in the methods, data were weighted for ‘other foods’ (i.e. those foods that did not fall within soft drinks or dairy products and alternatives)—for these products, there was a relatively even spread of different LNCS use frequencies, with the exception of saccharin and steviol glycosides, which had more limited use (≤2%).
Added sugar intakes
The estimated total daily intakes of added sugar among individual population groups in Brazil are presented in . Data are presented both on an absolute basis (g day−1) and as a proportion of total energy (%TE).
Table 3. Estimated daily intake of added sugar in Brazil by population group (2008–2009 POF data)
Among all population groups (all ages over 10 years), mean intakes of added sugar remained below the 10% TE cut-off. However, intakes by high consumers (90th and 95th percentile) exceeded the established cut-off in all age groups. A total of 29.1% of the total cohort exceeded the 10% TE cut-off, with the highest proportion observed in adolescents at 42.2% of the population group (see – percent consumers in the ‘Per person’ replacement model). Exceedance decreased with age, with the elderly group observed to have the lowest proportion of any population group exceeding the cut-off (17.0%).
Table 4. Estimated daily intake of acesulfame-K following replacement of added sugar on a per person or per food basis in Brazil by population group (2008–2009 POF data)
Table 5. Estimated daily intake of aspartame following replacement of added sugar on a per person or per food basis in Brazil by population group (2008–2009 POF data)
Table 6. Estimated daily intake of cyclamate following replacement of added sugar on a per person or per food basis in Brazil by population group (2008–2009 POF data)
Table 7. Estimated daily intake of saccharin following replacement of added sugar on a per person or per food basis in Brazil by population group (2008–2009 POF data)
Table 8. Estimated daily intake of steviol glycosides following replacement of added sugar on a per person or per food basis in Brazil by population group (2008–2009 POF data)
Table 9. Estimated daily intake of sucralose following replacement of added sugar on a per person or per food basis in Brazil by population group (2008–2009 POF data)
LNCS intakes
The mean and high percentile (90th and 95th) estimated daily exposure to the six LNCS in the individual population groups and the total population (over 10 years) are presented in on a body weight basis (mg kg-bodyweight−1 day−1) and as a proportion of the ADI (%ADI) for both the ‘per person’ and ‘per food’ replacement models. Of note, the percent consumers is lower in the ‘per person’ assessment (17.0 to 42.2% consumers) because this model focused only on those individuals who exceeded recommended intakes for added sugar (i.e. ≥10% TE), whereas the ‘per food’ assessment focused on all individuals who consumed foods containing added sugar and whereby LNCS were reported to occur from industry reported data (80.5 to 92.1%).
The intakes of all LNCS, with the exception of cyclamate, were below the ADI by average (mean) and heavy consumers (90th and 95th percentiles) for all population groups in Brazil over 10 years of age in both replacement models. For cyclamate, average consumer estimates in adolescents and high consumer estimates in all population groups examined exceeded the ADI in the ‘per person’ replacement model (up to 331.3% of the ADI at the 95th percentile for adolescents), which would be expected based on cyclamate having the lowest sucrose sweetness equivalence (30-fold) relative to the other LNCS evaluated (180- to 600-fold). In simple terms, this means that 6 to 20 times more cyclamate is required to achieve the same sucrose sweetness equivalence as the other LNCS evaluated. In reality, this is not a suitable model for this sweetener, as it is not practical that an individual will replace all added sugar directly with cyclamate alone (this sweetener is usually used in combination with other sweeteners) for flavour adjustment and functionality purposes, as well as dietary considerations. The estimated intakes in the ‘per food’ replacement model (whereby foods and beverages containing added sugar were replaced by a weighted proportion of this content with cyclamate) were generally below the ADI for all population groups, except in adolescents where the 95th percentile estimated intake reached the ADI (up to 101.8% ADI for adolescents).
For the other LNCS, intakes were considerably lower than the ADI in both models for acesulfame-K, aspartame, and sucralose, at up to 36.4%, 15.2%, and 12.1% of the ADI in the ‘per person’ replacement model, respectively, and up to 8.8%, 9.0%, and 1.5% of the ADI in the ‘per food’ replacement model, respectively. For saccharin and steviol glycosides, 95th percentile intakes in the ‘per person’ model were up to 72.9% and 91.1% of the ADI, respectively, but were substantially lower in the ‘per food’ replacement model, at up to 8.9% and 0.4% of the ADI, respectively.
The estimated daily intakes for the ‘per food’ replacement model, which incorporated LNCS usage patterns in foods and beverages on the Brazilian market, were lower in all instances than those determined in the ‘per person’ replacement model. The most notable difference in intakes was seen for steviol glycosides, whereby total daily mean, 90th percentile and 95th percentile intakes were reduced from up to 30.5%, 68.6%, and 91.1% of the ADI (‘per person’ replacement model for adolescents) to up to 0.1%, 0.3%, and 0.4% of the ADI (‘per food’ replacement model), respectively, which reflects the more restricted use of this LNCS in food products (100% of energy drinks and <1% of cola carbonates; ). A similar difference was observed for cyclamate (up to 331.1% versus 101.8% of the ADI in the ‘per person’ and ‘per food’ replacement models, respectively) and saccharin (up to 72.9% versus 8.9% of the ADI in the ‘per person’ and ‘per food’ replacement models, respectively), which are not as widely used as acesulfame-K, aspartame, and sucralose in soft drinks and dairy products and alternatives (and other foods by proxy) on the Brazilian market according to LNCS usage patterns.
Discussion
While a number of published studies have reported information on the use of LNCS by the Brazilian population (de Zanini et al. Citation2011; Geraldo and Machado Pinto-e-silva Citation2016; Silva Monteiro et al. Citation2018; Arrais et al. Citation2019; Barraj et al. Citation2021), the data on the estimated daily intake values are limited (Toledo and Ioshi Citation1995; Barraj et al. Citation2021). Obtaining reliable data on the presence and levels of inclusion of LNCS in all foods and beverages on a particular market can be difficult due to the commercially sensitive nature of these data. Given the lack of data available for many regions globally, the aim of this assessment was two-fold: to estimate daily intakes for six LNCS by the Brazilian population and to examine alternative models for assessing intakes of these additives which do not involve use level information.
Overall, both added sugar replacement models determined that intakes would be below the ADI for five of the six LNCS investigated in all Brazilian population groups examined (over 10 years of age) for average (mean) and high (90th and 95th) consumers, under the conditions of these models. For cyclamate, exceedance of the ADI was seen for average adolescent consumers and for all age groups amongst heavy consumers in the ‘per person’ replacement model, while estimated intakes in the ‘per food’ replacement model were calculated to be below the ADI in all population groups except adolescents where the 95th percentile intake reached the ADI using the model.
A recent study by Barraj et al. (Citation2021) examined the intakes of the same six LNCS by the Brazilian population using consumption data from the same dietary survey (POF INA 2008–2009), incorporating use level and market share data provided by Brazilian industry members. Barraj and colleagues conducted a series of models, including a ‘brand loyal’ model (where maximum reported use levels were applied to consumption data), and a ‘general consumer’ model (which utilised a weighted average of reported level based on market share information). In both model, intakes of LNCS up to the 95th percentile were below their respective ADI for all population groups assessed. Due to differences in the methodology, it is not possible to directly compare the results with the current research—which was theoretical in nature, but broadly speaking, the results by Barraj et al. (Citation2021) were more aligned with the ‘per food’ replacement model herein, which incorporated information of LNCS usage patterns in foods and beverages on the Brazilian market. The pattern of intake was largely similar for most LNCS, except for cyclamate and steviol glycosides. Predicted intakes of cyclamates in the current ‘per food’ replacement model were determined to be higher than intakes reported by Barraj et al. (Citation2021) in the ‘general consumer’ model, while predicted intakes of steviol glycosides were estimated to be lower. This difference is likely related to the inputs for the current assessment, whereby cyclamate has a low sucrose sweetness equivalence (higher inclusion level assumed) and steviol glycosides were reported to have a low prevalence on the Brazilian market according to the tonnage data (reported to be used only in energy drinks, and a very small proportion of cola carbonates). Predicted intakes of cyclamate from the current ‘per food’ replacement model (Scenario 2), which utilised tonnage data, are more similar, though slightly higher (up to 101.8% of the ADI in adolescents), than cyclamate intakes from foods and beverages reported by Barraj et al. (Citation2021) for the ‘brand loyal’ model (up to 82% of the ADI in adults) that did not utilise market share information. Notably, Barraj et al. (Citation2021) reported that intakes of cyclamate in the ‘brand loyal’ model from processed foods and beverages (up to 82% of the ADI) are significantly higher than reported intakes from tabletop usage in beverages (up to 12.5% of the ADI), which reduced the overall estimated daily intakes of cyclamate when both sources are considered together (up to 50.5% of the ADI).
The first replacement model conducted as part of the current analysis (‘per person’) was crude, focusing only on sucrose sweetness equivalence of the respective LNCS. This model examined intakes for only those individuals who exceeded the dietary guidelines for added sugar and assumed that 50% of this ‘excessive’ intake level would be replaced by each individual LNCS. The ADI was not exceeded for any LNCS apart from cyclamate. Given the low sweetness equivalence of cyclamate to sucrose, it is highly unlikely that this LNCS would be used as a direct replacement for a significant proportion of the added sugar in a diet due to the practical nature of use; as such, this model is likely not the most appropriate for this LNCS. Furthermore, as the tonnage data demonstrate, there are a wide range of LNCS used in different product categories, and a mixture of LNCS is often used in products to achieve an acceptable sensory profile; therefore, it is unlikely that a single LNCS would be used to replace 50% of excessive sugar intake by an individual. Overall, this is a simple method utilising minimal inputs (only added sugar intakes and sucrose sweetness equivalence), which focuses on consumers of concern (i.e. those individuals who are exceeding the recommended guidelines for added sugar). This method may represent the potential impact on LNCS intakes in individuals adjusting their added sugar intakes with the usage of LNCS in light of dietary guidelines—i.e. substitution of added sugar intakes with LNCS. However, the assessment does not represent realistic patterns of replacement based on actual usage patterns of LNCS, which would vary by product type, and is not the most suitable for LNCS that have a high sucrose sweetness equivalence, such a cyclamate.
The second replacement model involved the manipulation of the added sugar content in foods and beverages to substitute 50% of added sugar with actual usage patterns of the LNCS in foods and beverages on the Brazilian market in combination with sucrose sweetness equivalence. This model may therefore represent product reformulation by industry to include LNCS rather than added sugar (‘per food’). The results for this replacement model represent intakes by a wider cohort of individuals, as all foods and beverages containing added sugar were subject to adjustment. In this model, the predicted heavy-level intakes were less than 10% of the ADI for all sweeteners, with the exception of cyclamate, which reached the ADI for adolescents (101.8% of the ADI). This is considered a more realistic scenario, as it retained conservative assumptions, including substitution of 50% of added sugar in all foods, and does not require extensive inputs (only added sugar content in foods, sucrose sweetness equivalence and market-specific tonnage data) by the researcher.
As mentioned above, the main inputs incorporated in the replacement models were added sugar levels, sweetness equivalence, and Brazilian-specific tonnage data. One consideration for the replacement models is the fact that data on added sugar content associated with foods are not always available in consumption datasets (Fisberg et al. Citation2018), thus limiting the suitability of these models. Furthermore, the definition of added or free sugars can vary based on the inclusion/exclusion of fruit juices, which can lead to disparity in the reported results. For example, food codes representative of fruit juices and nectars have an associated added sugar content in the POF INA 2008–2009 but were ultimately not included in the ‘per food’ replacement model, as there was no reported usage of LNCS in juice. Another important consideration is the availability of tonnage data, which has an important impact on refining intakes rather than focusing solely on sucrose sweetness equivalence. It is noted that other food categories reported as having high frequencies of LNCS in Brazil for which tonnage data were unavailable included cakes and other desserts, jelly, imitation crab, and chewing gum (Figueiredo et al. Citation2018). It is important the inputs are comprehensive for the dataset. To overcome this aspect, weighted values based on tonnage data for soft drinks and dairy products and alternatives were applied to all ‘other’ foods with an associated added sugar content.
To identify and qualify potential sources of over- and under-estimation in the assessments, an uncertainty analysis was conducted in accordance with the criteria outlined by Codex and the European Food Safety Authority (CAC Citation2003; EFSA Citation2006). In brief, this entails examining each element of the assessment, identifying the potential sources and types of uncertainty. The sources of uncertainty associated with the replacement models employed herein, including the overall effects, are summarised in , with parameters organised according to the assessment inputs (consumption and use level data) and the replacement models conducted (‘per person’ and ‘per food’). These sources of uncertainty are described in more detail below. It should be noted that individual sources of uncertainty cannot be summed directly since influences are qualitative and correlations may exist between sources. However, the sections below identify the direction of uncertainty for both models.
Table 10. Qualitative evaluation of the influence of uncertainties on the estimates of exposure to LNCS calculated for Brazilian populationa
As with other studies conducted using individual-based consumption data, an important potential source of underestimation is the under-reporting of ‘unhealthy foods’ containing added sugars. Furthermore, the current analysis did not include intakes from tabletop sweeteners. As such, total cumulative LNCS intakes may be higher than those estimated herein. However, it is notable that Barraj et al. (Citation2021) recently reported that the intakes of LNCS from processed food and beverages by the Brazilian population were higher than the intakes by consumers of tabletop sweeteners. Therefore, the results presented herein are considered to represent the higher ceiling of intake versus those individuals who reported using artificial sweeteners in tabletop formats. It is noted that several studies using the Brazilian dataset have utilised only the first day of dietary recall (Silva Monteiro et al. Citation2018; Barraj et al. Citation2021); however, the comparison of estimated daily intakes to the chronic toxicological threshold (i.e. ADI for each LNCS) typically warrants the inclusion of a higher number of recording days to identify patterns of consumption, particularly for examining added sugar intakes, which may vary according to the survey day. As noted above, this aligns with the methodology by EFSA for the EFSA Comprehensive database.
The POF INA 2008–2009 includes consumption data that are more than a decade old and that are only available for individuals 10 years of age and over. The ages included in the consumption data are of unknown impact, since the pattern of consumption of food containing added sugar may have increased or decreased. Fisberg et al. (Citation2018) reported added sugar intakes for the Brazilian population as part of the ELANS Survey conducted in 2014 and 2015. The ELANS Survey typically reported higher estimated intakes of added sugar. However, it is also possible that added sugar intakes in the Brazilian population have decreased in response to the SMART commitment by the Brazilian Minister for Health to reduce excessive sugar consumption from the regular consumption of soda and artificial juice by 2019 (Ministry of Health, Brazil Citation2017). With regard to the absence of consumption data for individuals under the age of 10 years, younger population groups have higher intakes when expressed on a body weight basis compared to older population groups due to their relatively lower body weights. As such the estimated exposure for younger individuals may be underestimated versus the results provided herein.
With respect to the use level data and the models conducted, the current assessments assumed the replacement of half of the added sugar with a single LNCS, whereas in reality, the ratio of removal of added sugar will depend on numerous technological and sensory factors. This is particularly notable in the ‘per person’ assessment, where there was no information incorporated on usage patterns. In addition, similar to the expectation of the misreporting of consumption by individuals, the tonnage data used for adaptation of usage pattern in the ‘per food’ replacement model may under- and over-estimate exposure to LNCS in specific foods, as the data were gathered using a bottom-up methodology, whereby detailed recipes of key products were used to determine consumption volumes of ingredients in food. Furthermore, as noted above, tonnage data were not available for certain foods reported to have a high prevalence of LNCS in Brazil (Figueiredo et al. Citation2018) – it was assumed in the current assessment that the prevalence of LNCS in ‘other’ foods was similar to the reported prevalence in soft drinks and dairy products and alternatives. One consideration with the ‘per person’ replacement model (Scenario 1) is that individuals could replace greater amounts of their added sugar intake with LNCS, rather than just 50% of the ‘excessive’ added sugar intake level. However, it is unlikely that added sugar will be replaced with a single LNCS but rather by a combination of LNCS, which would be dependent on the sources of added sugar in the diet (e.g. soft drinks, dairy products, or other food types).
Overall, considering the totality of these inputs, the predicted estimates for high consumers in the “per person” assessment are likely to over-estimate the true potential exposure to the respective LNCS by a significant amount, primarily due to the assumption that 50% of ‘excessive’ added sugar would be replaced with a single LNCS—this does not take into account technological factors or usage factors. With respect to the “per food” model, the potential exposure estimates for high consumers are likely to over-estimate by a moderate amount, primarily due to the assumption that 50% of added sugar would be replaced with a single LNCS; in reality, multiple factors will impact the incorporation rates. In summary, this research aimed to identify alternative models for assessing potential exposure to LNCS that do not require presence and concentration data for these substances. The ‘per person’ replacement model is simple to conduct, requiring only data on added sugar intakes at an individual level and sweetness equivalence of the LNCS to sucrose; however, the estimates are very conservative and are not representative of true patterns of consumption of LNCS in the consuming cohort. The ‘per food’ replacement model (Scenario 2), which utilised information on market usage patterns of LNCS in Brazil, resulted in estimates that are more closely aligned with data reported for the same Brazilian cohort using a more traditional approach (Barraj et al. Citation2021). In this more realistic scenario, there were no exceedances of the ADI for the population groups examined for the six LNCS. This contributes to the body of evidence for intake estimates for Latin America, and Brazil specifically, which were previously quite limited. Additional research is needed for younger age groups to confirm whether these findings are applicable to the entire Brazilian population. Lastly, it should be emphasised, however, that this is not an assessment of current LNCS intakes and is instead intended as a theoretical assessment of LNCS intakes under the replacement conditions summarised. As above, this serves as alternative modelling for predicting LNCS exposure when presence and concentration data are lacking for these substances.
Acknowledgments
Tonnage data were provided by the Calorie Control Council.
Disclosure statement
No potential conflict of interest was reported by the author(s).
Additional information
Funding
References
- Arrais PSD, Vianna MPN, Zaccolo AV, Thé PMP, Moreira LIM, Quidute ARP, Fontanella AT, Pizzol TDSD, Tavares NUL, Oliveira MA, et al. 2019. Utilização de adoçantes no Brasil: uma abordagem a partir de um inquérito domiciliar [Use of artificial sweeteners in Brazil: a household survey approach]. Cad Saude Publica. 35(11):e00010719. Portuguese. doi:https://doi.org/10.1590/0102-311x00010719 .
- Barraj L, Scrafford C, Bi X, Tran N. 2021. Intake of low and no-calorie sweeteners (LNCS) by the Brazilian population. Food Addit Contam Part A. 38(2):181–194. doi:https://doi.org/10.1080/19440049.2020.1846083.
- Chattopadhyay S, Raychaudhuri U, Chakraborty R. 2014. Artificial sweeteners – a review. J Food Sci Technol. 51(4):611–621. doi:https://doi.org/10.1007/s13197-011-0571-1.
- [CAC] Codex Alimentarius Commission. 2003. Appendix IV. Working principles for risk analysis for application in the framework of the Codex Alimentarius. Rome. Report of the 26th Session June 30–July 7, 2003. [accessed 2021 Jun 16]. http://www.fao.org/docrep/006/Y4800E/y4800e00.htm .
- Dazult Ltd. 2018. DaDiet - the dietary intake evaluation tool [ software Version 17.04]. Straffan (County Kildare): Dazult Ltd; [accessed 2021 Jun 16]. http://dadiet.daanalysis.com .
- de Souza AM, Pereira RA, Yokoo EM, Levy RB, Sichieri R. 2013. Most consumed foods in Brazil: National Dietary Survey 2008–2009. Rev Saude Publica. 47(Suppl1):190S–199S. doi:https://doi.org/10.1590/s0034-89102013000700005.
- de Zanini RV, Araújo CL, Martínez-Mesa J. 2011. Utilização de adoçantes dietéticos entre adultos em Pelotas, Rio Grande do Sul, Brasil: um estudo de base populacional [Use of diet sweeteners by adults in Pelotas, Rio Grande do Sul State, Brazil: a population-based study]. Cad Saude Publica. 27(5):924–934. Portuguese. doi:https://doi.org/10.1590/S0102-311X2011000500010.
- Euromonitor International. 2021. Ingredients. London (UK): Euromonitor International; [accessed 2021 Jun 16]. https://www.euromonitor.com/ingredients-industry .
- [EFSA] European Food Safety Authority. 2006. Guidance of the scientific committee on a request from EFSA related to uncertainties in dietary exposure assessment. EFSA J. 438:1–54. [accessed 2021 Jun 16]. https://www.efsa.europa.eu/en/efsajournal/pub/438 .
- [EFSA] European Food Safety Authority. 2011. Use of the EFSA Comprehensive European Food Consumption Database in exposure assessment (Guidance of EFSA). EFSA J. 9(3):2097. [accessed 2021 Jun 16]. https://www.efsa.europa.eu/en/efsajournal/pub/2097 .
- Figueiredo LDS, Scapin T, Fernandes AC, Proença RPDC. 2018. Where are the low-calorie sweeteners? An analysis of the presence and types of low-calorie sweeteners in packaged foods sold in Brazil from food labelling. Public Health Nutr. 21(3):447–453. doi:https://doi.org/10.1017/S136898001700283X.
- Fisberg M, Kovalskys I, Gómez G, Rigotti A, Sanabria LYC, García MCY, Torres RGP, Herrera-Cuenca M, Zimberg IZ, Koletzko B, et al. 2018. Total and added sugar intake: assessment in eight Latin American countries (ELANS study group). Nutrients. 10(4):389. doi:https://doi.org/10.3390/nu10040389.
- [FAO] Food and Agriculture Organization of the United Nations. 2014, 2021. Food-based dietary guidelines – Brazil; [accessed 2021 Jun 16]. http://www.fao.org/nutrition/education/food-dietary-guidelines/regions/countries/Brazil/en/ .
- Geraldo AGP, Machado Pinto-e-silva ME. 2016. Nonnutritive sweeteners in Brazil: current use and associated factors. J Hum Growth Dev. 26(3):297–306. doi:https://doi.org/10.7322/jhgd.122760.
- [IBGE] Instituto Brasileiro de Geografia e Estatística. 2010a. Pesquisa de Orcçamentos Familiares, 2008–2009: antropometria e estado nutricional de criancças, adolescentes e adultos no Brasil. Rio de Janeiro, Brazil: Instituto Brasileiro de Geografia e Estatistica. [accessed 2021 Jun 16]. https://loja.ibge.gov.br/pesquisa-de-orcamentos-familiares-2008-2009-antropometria-e-estado-nutricional-de-criancas-adolescentes-e-adultos-no-brasil.html .
- [IBGE] Instituto Brasileiro de Geografia e Estatística. 2010b. Pesquisa de Orçamentos Familiares 2008–2009 - Avaliação nutricional da disponibilidade domiciliar de alimentos no Brasil. Rio de Janeiro, Brazil: Instituto Brasileiro de Geografia e Estatistica. [accessed 2021 Jun 16]. https://loja.ibge.gov.br/pesquisa-de-orcamentos-familiares-2008-2009-avaliac-o-nutricional-da-disponibilidade-domiciliar-de-alimentos-no-brasil.html .
- [IBGE] Instituto Brasileiro de Geografia e Estatística. 2010c. Pesquisa de orçamentos familiares 2008–2009. Aquisição alimentar per capita. Rio de Janeiro, Brazil: Instituto Brasileiro de Geografia e Estatistica. [accessed 2021 Jun 16]. https://loja.ibge.gov.br/pesquisa-de-orcamentos-familiares-2008-2009-aquisic-o-alimentar-domiciliar-per-capita-brasil-e-grandes-regioes.html .
- [IBGE] Instituto Brasileiro de Geografia e Estatística. 2011. Pesquisa de Orçamentos Familiares, 2008–2009: análise do Consumo Alimentar Pessoal no Brasil. Rio de Janeiro, Brazil: Instituto Brasileiro de Geografia e Estatística. [accessed 2021 Jun 16]. https://www.ibge.gov.br/doesnotincludein formationonState; https://biblioteca.ibge.gov.br/visualizacao/liv ros/liv50063.pdf .
- [IBGE] Instituto Brasileiro de Geografia e Estatística. 2014. Consumer expenditure survey 2008–2009. Analysis of personal food consumption in Brazil. Rio de Janeiro, Brazil: Instituto Brasileiro de Geografia e Estatistica. [accessed 2021 Jun 16]. http://www.ibge.gov.br/english/estatistica/populacao/condicaodevida/pof/2008_2009_analise_consumo/default.shtm .
- [JECFA] Joint FAO/WHO Expert Committee on Food Additives. 2010. Combined compendium of food additive specifications. JECFA, 73rd Meeting, June 8–17, 2010; Geneva (Rome): Food and Agriculture Organization of the United Nations (FAO). Steviol glycosides. (FAO JECFA Monographs, No. 10); [accessed 2021 Jun 16]. http://www.fao.org/fileadmin/user_upload/jecfa_additives/docs/monograph10/additive-442-m10.pdf .
- Martyn D, Darch M, Roberts A, Lee HY, Yaqiong Tian T, Kaburagi N, Belmar P. 2018. Low-/no-calorie sweeteners: a review of global intakes. Nutrients. 10(3):357. doi:https://doi.org/10.3390/nu10030357.
- [MOH] Ministry of Health, Brazil. 2006. Guia alimentar para a população Brasileira: promovendo a alimentação saudável [Dietary guideline for the Brazilian population: promoting heathy eating]. Brasília, Brazil: Ministério da Saúde, Secretaria de Atenção à Saúde, Coordenação-Geral da Política de Alimentação e Nutrição [Ministry of Health, Secretariat Health Care, General Coordination of Food and Nutrition Policy]. [accessed 2021 Jun 16]. https://bvsms.saude.gov.br/bvs/publicacoes/guia_alimentar_populacao_brasileira_2008.pdf .
- [MOH] Ministry of Health, Brazil. 2015. Guia alimentar para a população Brasileira: promovendo a alimentação saudável [Dietary guideline for the Brazilian population: promoting heathy eating]. Brasília, Brazil: Ministério da Saúde, Secretaria de Atenção à Saúde, Coordenação-Geral da Política de Alimentação e Nutrição [Ministry of Health, Secretariat Health Care, General Coordination of Food and Nutrition Policy]. [accessed 2021 Jun 16]. https://bvsms.saude.gov.br/bvs/publicacoes/dietary_guidelines_brazilian_population.pdf .
- [MOH] Ministry of Health, Brazil. 2017. United Nations decade of action on nutrition. Brazil. SMART commitments on ending obesity [Letter and commitments dated 22 May 2017]. Brasília, Brazil: Ministry of Health, Federative Republic of Brazil. [accessed 2021 Jun 16]. https://www.who.int/nutrition/decade-of-action/Brazil-doa-commitments.pdf .
- Silva Monteiro L, Kulik Hassan B, Melo Rodrigues PR, Massae Yokoo E, Sichieri R, Alves Pereira R. 2018. Use of table sugar and artificial sweeteners in Brazil: National Dietary Survey 2008–2009. Nutrients. 10(3):295. doi:https://doi.org/10.3390/nu10030295.
- Toledo MCF, Ioshi SH. 1995. Potential intake of intense sweeteners in Brazil. Food Addit Contam. 12(6):799–808. doi:https://doi.org/10.1080/02652039509374372.
- [WHO] World Health Organization. 2015. Guideline: sugars intake for adults and children. [accessed 2021 Jun 16]. https://www.who.int/publications/i/item/9789241549028 .
- [WHO] World Health Organization. 2019. Evaluations of JECFA. List of chemicals in functional class SWEETENER. Geneva, Switzerland: Joint FAO/WHO Expert Committee on Food Additives (JECFA). [accessed 2021 June 16]. https://apps.who.int/food-additives-contaminants-jecfa-database/search.aspx?fc=66 .