
Abstract
Cadmium (Cd) was measured in bulk exports of Canada Western Amber Durum collected from 1992–1993 to 2019–2020 shipping years. Cd concentrations decreased by more than a factor of two over this period, from the highest annual median concentration of 0.160 mg/kg in 2003–2004 to the most recent annual median of 0.070 mg/kg for 2019–2020. Over the same time period there was no trend in Cd concentrations in bulk exports of Canada Western Red Spring wheat. The decrease in durum Cd concentrations was correlated with the decrease in production of high Cd accumulating cultivars, demonstrating the success of the Canadian breeding programme at developing low Cd accumulating cultivars, the registration system and producer support in reducing the Cd content of Canada Western Amber Durum.
Graphical Abstract
Introduction
Cadmium (Cd) is a heavy metal, and due to its presence in soils, it is a natural contaminant found in many foods. Various anthropogenic activities, including nearby industrial activity (Douay et al. Citation2008) and use of phosphate-based fertilisers also contribute to the presence of Cd in foods (Joint FAO/WHO Expert Committee on Food Additives Citation2011). Elevated chronic exposure to Cd can result in various negative health effects, including kidney damage and cancer.
Diet is the main source of exposure to Cd, with consumption of grains and grain-based foods being a major source of Cd exposure for some populations (European Food Safety Authority Citation2012). Independent of growing location proximity to Cd point sources, some food plants accumulate more Cd than others. Spinach, lettuce, cruciferous vegetables, tomatoes and potatoes are noted as ‘high accumulators’ of Cd (Kuboi et al. Citation1987; Page et al. Citation1987; Grant et al. Citation1998). Even though members of the Gramineae family, which includes wheat and durum, were considered to be ‘moderate accumulators’, high consumption of these grains can lead to grain-based foods comprising a significant portion of consumers’ dietary exposure to Cd. Within the Gramineae family, durum wheat can be a greater accumulator of Cd as compared to other cereal grains. Meyers et al. (Citation1982) noted higher concentrations of Cd in durum grown in the US, as compared to common wheat.
Species, cultivar, and geographical growing location are the main factors affecting Cd in plants (Grant et al. Citation1998). Cd behaviour in soil is complex, and in addition to larger scale factors affecting the presence of Cd in soil, more localised factors including soil pH, chloride concentrations, drainage and temperature, also affect Cd accumulation by plants (Roberts Citation2014). The high accumulation of Cd in durum is largely controlled by a single gene, characterised as having a simple inheritance and high heritability (Clarke et al. Citation1997).
In order to manage dietary exposure to Cd, regulations limiting the amount of Cd in grains have been established. After beginning assessments in the 1980s, the Codex Alimentarius Commission adopted a maximum level (ML) of 0.2 mg/kg in wheat in 2005 (Codex Alimentarius Commission Citation2016). The European Union adopted MLs of 0.18 mg/kg for durum and 0.10 mg/kg for other cereals in mid-2021 (European Commission Citation2021). In China, there is an ML of 0.1 mg/kg for ‘grains (including paddy rice)’ (United States Department of Agriculture Citation2017). There is no ML in Canada for Cd in grains or food. However, quality objectives for western Canadian wheat and durum stipulate that samples of durum cultivar candidates grown in the Co-operative Registration Trials used in the Canadian registration system must have Cd concentrations lower than 0.1 mg/kg (Prairie Grain Development Committee Citation2019).
A durum breeding programme was established in Canada in 1991 in order to lower Cd concentrations in grain (Grant et al. Citation2008) while maintaining the valuable quality characteristics. Improvements began by incorporating genetic material from low Cd accumulating parents, with all new durum cultivars having at least one low Cd parent in late 1991 (Grant et al. Citation1998). Napoleon, the first low Cd cultivar registered in Canada (Humphreys et al. Citation2010), was released for production in 2001. In 2004, low Cd accumulation was instituted as a requirement for all new durum cultivars in the registration process in Canada (Clarke et al. Citation2010).
Cd concentrations in grain have been monitored throughout the establishment of the breeding programme and registration activities designed to lower Cd accumulation in Canadian durum. This work summarises and presents results from approximately three decades of monitoring, beginning in the early 1990s.
Materials and methods
Samples
Samples of bulk export shipments of Canada Western Amber Durum (CWAD; n = 2239) and Canada Western Red Spring wheat (CWRS; n = 1546) were taken during vessel loading. Shipments were systematically selected for sampling and analysis throughout an entire shipment year beginning 1 August and ending 31 July of the following calendar year.
Moving grain was sampled according to standardised procedures at a constant interval using Canadian Grain Commission-approved automated cross-stream sample diverters and dividers during vessel loading at terminal grain elevators (Canadian Grain Commission Citation2015). The increments obtained during loading of the entire lots were combined into a composite sample that was considered to be representative of the entire lot. A Boerner divider (Seedburo Equipment Co., Des Plaines, IL, USA) was used to divide the composite sample into a laboratory sample for Cd analysis. Over the duration of monitoring reported here, laboratory sample size varied between 1 and 10 kg. For shipments from 2009–2010 to 2011–2012, laboratory sample sizes were 10 kg. For all other years, laboratory sample sizes were 1 kg. Laboratory samples were stored at room temperature in canvas bags for up to 5 weeks until further preparation.
Sample preparation
For most years, laboratory samples were ground using a modified commercial flat burr coffee grinder (model KR 804, Ditting Maschinen AG, Bachenbülach, Switzerland). The sample was ground fine enough that ≥85% of the sample mass passed through a US 50 sieve (nominal sieve openings of 300 μm). After each sample, the grinder was cleaned by running the grinder briefly with no sample and then brushing and vacuuming the discharge tube and hopper. In years when 10 kg laboratory samples were used (2009–2010 to 2011–2012), samples were ground using a Retsch SR-300 rotor beater mill fitted with a 750 µm sieve as described in Tittlemier et al. (Citation2012). Ground samples were stored in polyethylene bags at room temperature until analysis. Test portions of ground grain (1 g) were manually scooped from the ground laboratory sample. In-house studies showed that the ground laboratory sample was ‘sufficiently homogenous’ (Fearn and Thompson Citation2001) with respect to Cd concentration when sub-sampled in this manner.
Analysis of cadmium
Three analytical methods were used over the 27 years span of monitoring presented in this article. All CWAD and CWRS bulk exports shipped from 1992–1993 to 2012–2013 were analysed using closed vessel microwave digestion followed by graphite furnace atomic absorption spectroscopy (GFAAS) as described in Gawalko et al. (Citation1997). Briefly, a 0.5 g test portion of ground grain was digested in ultrapure grade nitric acid (70%) using a multi-stage programme on the microwave digestion system (CEM MDS-2000, CEM Corporation; Anton Paar Multiwave 3000, Perkin Elmer, Waltham, MA, USA) that optimised pressure (CEM MDS-2000 only), or pressure and temperature, to ensure complete sample digestion. A maximum number of samples were digested in each batch, with one sample vessel monitored by pressure and temperature control (pressure control only for CEM MDS-2000) during the digestion programme. Sample digestates were cooled for 15 min after completion of the digestion programme and then diluted with deionised water to a concentration of 0.1 g sample matrix/mL.
Digestates were analysed for Cd using one of three GFAAS systems: Perkin-Elmer 5100 PC equipped with AS70 autosampler, Perkin-Elmer SIMAA 6100 with AS800 autosampler, or Perkin-Elmer AAnalyst 800 with AS800 autosampler, all with a System 2 electrodeless discharge lamp power supply at wavelength of 228.8 nm and slit width of 0.7 nm. An optimised graphite furnace programme was used to ensure ashing, atomisation, and clean-out was complete for each digestate; temperatures, hold and ramp times, argon flow rates, and other graphite furnace programme parameters are provided in Gawalko et al. (Citation1997). Direct calibration using one blank and one stock calibration standard was used. The working range of the method for Cd analysis was 0.01–0.500 mg/kg in sample. The method detection limit of 0.01 mg/kg was determined as 3x the within-run standard deviation for seven replicates of an in-house wheat reference material (Gawalko et al. Citation1997).
Bulk exports of CWAD and CWRS shipped from 2013 to 2014 onwards were analysed for Cd using closed vessel microwave digestion followed by inductively coupled mass spectrometry (ICP-MS). For these samples, a test portion of 1 g ground grain was digested in 5 mL of distilled concentrated nitric acid and 3 mL of deionised water (Anton Paar Multiwave 3000; or UltraWAVE single reaction chamber microwave digestion system, Milestone, Shelton, CT). Before use, concentrated nitric acid (67–70%, Environmental Grade, Anachemia Science, Richmond) was distilled using a DST-1000 sub-boiling distillation system (Savillex, Eden Prairie, MN). Deionised water (≥18 MΩ) was obtained by passing distilled water through a Millipore water purification system with Milli-Q RO 12 PLUS/Milli-Q TOC PLUS filter cartridges. A multi-stage microwave programme (Supplementary Table 1) was used to ensure complete sample digestion (Kingston and Haswell Citation1999). After cooling to room temperature, digested samples were manually taken to a volume of 50 mL using deionised water. Diluted digested samples were further diluted by a factor of 5 with deionised water using an automated sample dilutor (EasyPREP, SCP Science, Baie D'Urfé, QC, Canada). In order to avoid contamination, labware was systematically cleaned prior to use by acid steam cleaning with distilled nitric acid/deionised water (9:1 v/v) at 170 °C for 1 h (traceCLEAN, Milestone).
From 2013–2014 to 2016–2017 digested and diluted samples were analysed for Cd using a PerkinElmer Elan DRC-e ICP-MS with Elan 3.5 ICP-MS instrument control software, fitted with an ASX-520 autosampler (Cetac Technologies, Omaha, NE), an IsoMist Programmable Temperature Spray Chamber (Glass Expansion, Pocasset, MA) set at 5 °C, and a recirculation chiller (PolyScience, Niles, IL, USA) set at 15 °C. The ICP-MS was fitted with nickel sampler and skimmer cones and a standard quartz torch. Plasma power was set at 1450 W, with a plasma gas (Ar) flow rate of 15.0 L/min, auxiliary gas (Ar) flow rate of 1.2 L/min, and nebuliser gas (Ar) flow rate of 1.0–1.2 L/min. Ions of m/z 111 and 114 were acquired in peak hopping scan mode for Cd, using dwell and integration times of 150 and 2250 ms, respectively, and 115In as internal standard to correct for matrix interferences between samples and standard solutions and instrument variability occurring during an analytical sequence. Impacts of interferences on m/z 111 from MoO+ and on m/z 114 from MoO+ and Sn were mitigated using mathematical correction. A correction factor for Mo was calculated using a standard solution of Mo analysed in each ICP-MS run; the correction factor for Sn used the natural abundances of the Sn isotopes. Direct calibration using one blank and a series of calibration standards were used. The working range of the method for Cd analysis was 0.01–25 mg/kg on a sample basis. The method detection limit of 0.01 mg/kg was determined as the mean + 3 standard deviations of the noise from reagent blanks (n = 20) analysed on different days.
From 2017 to 2018 onwards, digested and diluted samples were analysed for Cd using the same microwave digestion equipment and method, but analysis was performed on an Agilent 7800 ICP-MS with a quartz Scott-type double pass spray chamber, with spray chamber chiller set at 2 °C and recirculation chiller set at 15 °C (Model 6106 T, PolyScience, Niles, IL, USA). The instrument used an automated inline dilution system (ESI prepFAST, Elemental Scientific, Omaha, NE, USA) for dilution of standards and samples. The ICP-MS was fitted with a nickel-plated sampler cone, a nickel skimmer cone, and a 2.5 mm quartz torch. Plasma power was set at 1550 W, samples depth 8 mm, with a plasma gas (Ar) flow rate of 15.0 L/min, auxiliary gas (Ar) flow rate of 0.9 L/min, and nebuliser gas (Ar) flow rate of 1.0–1.2 L/min. The ion at m/z 111 was acquired in spectrum scan mode for Cd, using dwell and integration time of 2000 ms, respectively, and 103Rh as internal standard. Impacts of interferences on m/z 111 from MoO+ were mitigated using a collision cell in He gas mode with a gas flow of 4.6 mL/min and energy discrimination of 5 V. Direct calibration using one blank and a series of calibration standards were used. The working range of the method for Cd analysis was 0.01–20 mg/kg on a sample basis. The limit of quantitation of 0.01 mg/kg was determined as 10× the standard deviation of the solution blank results, using 7 digested solution blanks analysed over 5 d. The limit of quantitation was also confirmed using a commercially available certified reference material (NIST apple leaves standard reference material 1515; 0.0132 ± 0.0015 mg Cd/kg) with 7 × 1 g test portions of the material analysed over 3 d.
Quality control
A number of strategies were used to ensure accurate and precise data were generated over the course of the multi-decade monitoring. A variety of quality control samples were included in each sample batch to monitor the performance of the analytical methods. These quality control samples were taken through all steps of sample preparation, microwave digestion and instrumental analysis. Quality control samples included reagent blanks that contained no matrix, but were otherwise treated the same as samples; in-house grain-based reference materials and commercially available certified reference materials used to monitor method accuracy and precision; duplicate test portions of one sample per batch used to monitor method precision; and a triplicate test portion of the sample used to monitor method precision, fortified with Cd at 0.2 mg/kg (GFAAS and ICP-MS methods) and 1 mg/kg (ICP-MS methods only) prior to microwave digestion to monitor analyte recovery. During the time period of the Cd monitoring, participation in proficiency tests was also routine for the GFAAS (n = 26 rounds) and ICP-MS (n = 18). All results submitted for proficiency testing were assessed as satisfactory, with |Z-scores| <2.
Since the methods and instrumentation used evolved over the course of this monitoring, additional analyses of a variety of reference materials were performed to ensure the continuity of data quality. Replicate test portions of certified reference materials of apple leaves (n = 9), rice flour (n = 8), and wheat flour (n = 8), in addition to in-house reference materials of wheat (n = 21), durum (n = 19) and solin (n = 18) were analysed over a period of 18 months by both AA and ICP-MS methods in order to compare results from both methods.
Cultivar production
The production of various cultivars was represented by the proportion of total insured acres. From 1998 to 2012, data on the proportion of total insured acres for each cultivar were obtained from personal communications with Canadian Grain Commission personnel. From 2013 to 2019, data were obtained from a publically accessible database (Canadian Grain Commission Citation2020).
Results
Summary data on Cd concentrations measured annually in CWAD and the CWRS bulk export shipments are listed in and , respectively. illustrates trends in median and percentile concentrations of Cd across the 28 years of analysis, and between the two grains.
Figure 1. Cadmium content of bulk export shipments of Canada Western Amber Durum (CWAD) and Canada Western Red Spring (CWRS) between 1992 and 2020. Boxes represent 25–75th percentiles; whiskers represent 10–90th percentiles. Lines within boxes indicate median concentrations.
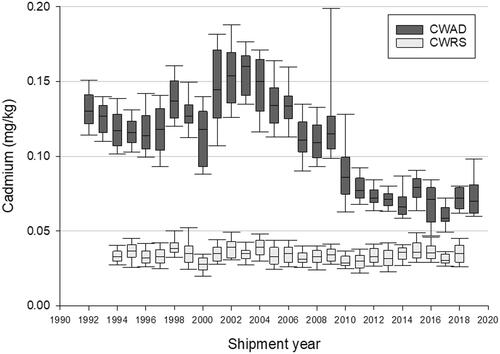
Table 1. Cadmium concentrations (mg/kg) in Canada Western Amber Durum bulk export shipments.
Table 2. Cadmium concentrations (mg/kg) in Canada Western Red Spring bulk export shipments.
After peaking in the early 2000s, Cd concentrations in CWAD bulk exports began to decline (). The decrease in Cd concentrations continues through the late 2000s and early 2010s, with concentrations appearing to plateau in the late 2010s. The highest median Cd concentrations in CWAD occurred at 0.160 mg/kg in exports from the 2003–2004 shipment year, which is over twice as high as the most recent data (0.070 mg/kg), obtained for exports from the 2019–2020 shipment year.
Not surprisingly, analytical methods used during this monitoring of Cd evolved over 28 years of analyses. The equivalency of data generated over the years and across different methods was demonstrated by the analysis of various certified and in-house reference materials, as well as by proficiency testing. Three of the 26 rounds of proficiency tests run by GFAAS were also run by ICP-MS; one round was run using both ICP-MS instrumentation. Results from the analysis of same test material in these four instances were satisfactory for all methods, with |Z-scores| <2.
shows a comparison of results from the analysis of various reference materials that were analysed by AA and ICP-MS methods. The reference materials, while not all grain, were selected to cover a range of Cd concentrations. Aliquots of replicate test portion digestions were analysed by AA and ICP-MS over time periods ranging from 13 to 18 months for the various reference materials. Therefore analytical conditions over the course of this comparison incorporated variability due typical laboratory environmental variation that would likely be encountered during long-term monitoring.
A paired t-test (SigmaPlot version 14.0, Systat, Palo Alto, USA; level of significance at p = 0.05) was used to test for the difference of means for each reference material analysed by both AA and ICP-MS. Statistically, significant differences were only noted for the apple leaves certified reference material and the wheat in-house reference material; however, Cd concentrations were within the one standard deviation of the reference materials’ reference values. The small differences in mean Cd concentrations measured by the two methods for these materials, plus the slightly higher concentrations measured by ICP-MS, strongly suggest that the method change did not bias the monitoring data, and therefore did not affect temporal trend assessment of Cd concentrations in the study.
Discussion
Decrease in CWAD cadmium concentrations
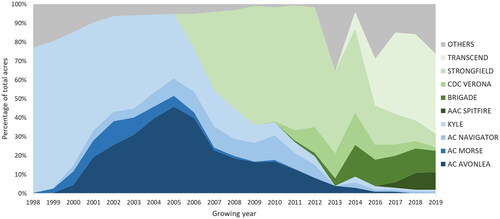
The decrease in Cd concentrations in CWAD bulk exports is consistent with the decrease in planting of high Cd accumulating cultivars in the mid-2000s, as illustrated by the percentage of insured acres of various CWAD cultivars (). The decrease in production of high Cd accumulating cultivars began in 2006, when the newly registered low Cd accumulator Strongfield cultivar was planted in notable amounts. Strongfield rapidly increased to 63% of total CWAD acres in 2009, and was joined by Transcend, CDC Verona, Brigade and AAC Spitfire cultivars in the mid 2010s. By 2019, the high Cd accumulating cultivars of Kyle, AC Navigator, AC Morse, and AC Avonlea, which had comprised 78–95% of durum produced from 1998 to 2005, only accounted for approximately 2% of durum grown in Canada.
Figure 2. Predominant Canada Western Amber Durum cultivars grown in the provinces of Manitoba, Saskatchewan and Alberta from 1998 to 2018. Data are unavailable for the 2015 growing year. Insured acres of each cultivar listed comprised greater than 5% of total insured acres in at least one year from 1998 to 2019. The grey ‘Others’ category includes cultivars comprising less than 5% of total insured acres, cultivars that were not in the current list of Canadian Grain Commission designated varieties for a given growing year, and cultivars whose name was not provided. Cultivars represented by shades of green were registered in 2004 and later, and are low cadmium accumulators. Cultivars represented by shades of blue were registered from 1984 to 2002, and are high cadmium accumulators.
The decrease in Cd concentrations in CWAD bulk exports is not due to environmental changes impacting accumulated Cd. Over the same time period of monitoring Cd in CWAD, there were no trends in Cd concentrations in CWRS bulk exports (). CWRS is grown in a broader region than CWAD, but its production encompasses south eastern Alberta and south western and central Saskatchewan, the CWAD production area, as well. Therefore the absence of trends in CWRS bulk exports rules out environmental changes, such as decreasing industrial activity, as a factor in the decrease of Cd in CWAD over time.
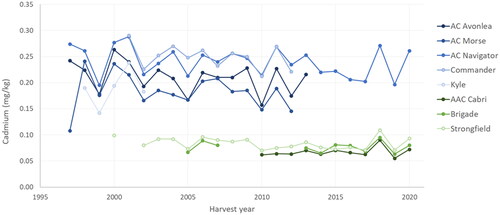
The decrease in Cd concentrations in CWAD bulk exports is also not due to analytical artefacts affecting concentrations measured. shows the results from annual analysis of Cd in CWAD cultivars from 1997 to 2019 used as standards (or ‘checks’) in the Co-operative Registration Trials used in the Canadian registration system. The checks are grown in annual field trials held in various locations in western Canada and analysed annually for Cd using the analytical methods described in the ‘Materials and Methods’ section. illustrates annual variability in Cd concentrations within cultivars due to growing conditions as well as laboratory/analytical conditions. While there was variability of Cd concentrations from year to year within cultivars (percent relative standard deviation ranged from 8 to 17%), there were no trends in Cd concentrations with the change from AA to ICP-MS in 2013–2014.
Figure 3. Cadmium concentrations in Canada Western Amber Durum used as check cultivars in Co-operative Registration Trials. Cultivars represented by shades of green were registered in 2004 and later, and are low cadmium accumulators. Cultivars represented by shades of blue were registered from 1984 to 2004, and are high cadmium accumulators.
Compliance of CWAD and CWRS cadmium concentrations
Since 2010 and the significant production of low Cd accumulating cultivars, all CWAD bulk exports measured have complied with the Codex ML of 0.2 mg/kg in wheat. CWRS exports have complied since the beginning of monitoring in 1994. In addition, only a very small percentage of CWAD bulk exports (from 0 to 4% per year) have exceeded the specification of 0.1 mg/kg Cd for registered Canadian cultivars. These exceptions may reflect CWAD grown in localised areas with higher soil Cd content, such as areas between Regina and Saskatoon, Saskatchewan (Garrett et al. Citation1998).
The Cd concentrations measured in CWAD and CWRS bulk exports are within the ranges of Cd reported for wheat and durum produced in other areas. summarises Cd measured in wheat and durum from a variety of growing locations. A straight forward comparison cannot be made between export shipment results from this study and those summarised in the table, as the data from the previous works represent a wide variety of different conditions, including samples taken at harvest from individual producers (Gawalko et al. Citation2002) or locations (Wolnik et al. Citation1983; Douay et al. Citation2008; Yang et al. Citation2020), to means of individual samples (Zook et al. Citation1970; Clarke et al. Citation1997; Harcz et al. Citation2007) or composites of individual samples grouped by cultivar, growing location and/or growing year (Conti et al. Citation2000; Corguinha et al. Citation2015).
Table 3. Cadmium measured in wheat and durum grown in various locations.
The export shipments can be considered a type of composite, as shipments can be a mix of up to 55,000 t of grain from different cultivars in a particular class grown across various years and various locations, and combined to obtain the quality factors required by end users. Overall, the range of Cd in individual CWRS export shipments (0.016–0.093 mg/kg) is similar to concentrations of Cd reported in in composite-type wheat samples over a wide time period and unknown cultivar composition (0.018–0.10 mg/kg).
There are less published data for Cd in durum. The upper end of the range of Cd in individual CWAD export shipments (0.044–0.412 mg/kg) is beyond what has been reported by others (; 0.016–0.183 mg/kg). However, the most recent 5 years of CWAD export shipments range (0.045–0.123 mg/kg) is more similar to what has been reported in other work.
Conclusions
The more than 2-fold decrease in Cd concentrations observed in CWAD bulk exports during the past three decades demonstrates that the breeding programmes, cultivar registration requirements in the Canadian registration system, plus the adoption of low Cd accumulating cultivars by producers successfully reduced the Cd content of CWAD.
Supplemental Material
Download TIFF Image (592.7 KB)Acknowledgements
Eugene Gawalko, Klara Jarrin, Jason Chan, Shannon Neumann, Debbie Salazar, Nelson Pereira and Colleen Kobialka assisted with sample preparation and analysis over the period of monitoring.
Disclosure statement
No potential conflict of interest was reported by the author(s).
References
- Canadian Grain Commission. 2015. Sampling systems handbook and approval guide. [accessed 2020 June 19]. https://grainscanada.gc.ca/en/grain-quality/sampling-grain/sampling-systems-handbook/sampling-systems-handbook-1.html.
- Canadian Grain Commission. 2020. \\chenassoft\SmartEdit\WatchFolder\XML_Signal_to_CCE_High_Speed_WF\ESA\IN\INPROCESS\2. Grain varieties by acreage insured. [accessed 2020 June 19]. https://grainscanada.gc.ca/en/grain-research/statistics/varieties-by-acreage/.
- Clarke JM, Clarke FR, Pozniak CJ. 2010. Forty-six years of genetic improvement in Canadian durum wheat cultivars. Can J Plant Sci. 90(6):791–801.
- Clarke JM, Leisle D, Kopytko GL. 1997. Inheritance of cadmium concentration in five durum wheat crosses. Crop Sci. 37(6):1722–1726.
- Codex Alimentarius Commission. 2016. Codex general standard for contaminants and toxins in food and feed. Gen Std. 193–1995.
- Conti ME, Cubadda F, Carcea M. 2000. Trace metals in soft and durum wheat from Italy. Food Addit Contam. 17(1):45–53.
- Corguinha APB, Souza GAd, Gonçalves VC, Carvalho CA, Lima WEAd, Martins FAD, Yamanaka CH, Francisco EAB, Guilherme LRG. 2015. Assessing arsenic, cadmium, and lead contents in major crops in Brazil for food safety purposes. J Food Compos Anal. 37:143–150.
- Douay F, Roussel H, Pruvot C, Waterlot C. 2008. Impact of a smelter closedown on metal contents of wheat cultivated in the neighbourhood. Environ Sci Pollut Res Int. 15(2):162–169.
- European Commission. 2021. Commission regulation (EU) 2021/1323 of 10 August 2021 amending regulation (EC) No 1881/2006 as regards maximum levels of cadmium in certain foodstuffs. Official J Eur Commun. L288:13–18.
- European Food Safety Authority. 2012. Cadmium dietary exposure in the European population. EFSA J. 10:2551–2588.
- Fearn T, Thompson M. 2001. A new test for ‘sufficient homogeneity. Analyst. 126(8):1414–1417.
- Garrett RG, MacLaurin AI, Gawalko EJ, Tkachuk R, Hall GEM. 1998. A prediction model for estimating the cadmium content of durum wheat from soil chemistry. J Geochem Explor. 64(1–3):101–110.
- Gawalko EJ, Garrett RG, Nowicki TW. 2002. Cadmium, copper, iron, manganese, selenium, and zinc in Canadian spring wheat. Commun Soil Sci Plant Anal. 33(15–18):3121–3133.
- Gawalko EJ, Nowicki TW, Babb J, Tkachuk R, Wu S. 1997. Comparison of closed-vessel and focused open-vessel microwave dissolution for determination of cadmium, copper, lead, and selenium in wheat, wheat products, corn bran, and rice flour by transverse-heated graphite furnace atomic absorption spectrometry. J AOAC Int. 80(2):379–387.
- Grant CA, Buckley WT, Bailey LD, Selles F. 1998. Cadmium accumulation in crops. Can J Plant Sci. 78(1):1–17.
- Grant CA, Clarke JM, Duguid S, Chaney RL. 2008. Selection and breeding of plant cultivars to minimize cadmium accumulation. Sci Total Environ. 390(2–3):301–310.
- Harcz P, De Temmerman L, De Voghel S, Waegeneers N, Wilmart O, Vromman V, Schmit JF, Moons E, Van Peteghem C, De Saeger S, et al. 2007. Contaminants in organically and conventionally produced winter wheat (Triticum aestivum) in Belgium. Food Addit Contam. 24(7):713–720.
- Humphreys DG, Townley-Smith TF, Leisle D, McCallum B, Gaudet D, Gilbert J, Menzies J. 2010. Napoleon Amber durum wheat. Can J Plant Sci. 90(6):863–867.
- Joint FAO/WHO Expert Committee on Food Additives. Meeting. 2011. Safety evaluation of certain food additives and contaminants, prepared by the seventy-third meeting of the Joint FAO/WHO Expert Committee on Food Additives (JECFA). World Health Organization. https://apps.who.int/iris/handle/10665/44521
- Kingston H, Haswell S. 1999. Microwave-enhanced chemistry: fundamentals, samples preparation, and applications. Washington (DC): American Chemical Society.
- Kuboi T, Noguchi A, Yazaki J. 1987. Relationship between tolerance and accumulation characteristics of cadmium in higher plants. Plant Soil. 104(2):275–280.
- Meyers MW, Fricke FL, Holmgren GGS, Kubota J, Chaney RL. 1982. Cadmium and lead in wheat grain and associated surface soils of major wheat production areas in the United States. Agrosyst Geosci Environ. 5:e20288.
- Page AL, Chang AC, El-Amamy M. 1987. Lead, mercury, cadmium and arsenic in the environment: Cadmium levels in soils and crops in the United States. New York (NY): Wiley. p. 119–146.
- Prairie Grain Development Committee. 2019. Quality objectives for western Canadian wheat classes (revised September 17, 2019). http://www.pgdc.ca/pdfs/wrt/Wheat%20Quality%20Objectives%20-%20QET%2017Sept2019%20FINAL.pdf
- Roberts TL. 2014. Cadmium and phosphorous fertilizers: the issues and the science. Proc Eng. 83:52–59.
- Tittlemier SA, Roscoe M, Kobialka C, Blagden R. 2012. Considerations in the preparation of laboratory samples for the analysis of ochratoxin A in wheat. World Mycotoxin J. 5(2):107–116.
- United States Department of Agriculture. 2017. Foreign agricultural service global agricultural information network. China releases the standard for maximum levels of contaminants in foods (National Food Safety Standard for Maximum Levels of Contaminants in Foods). Report number CH18025. Attaché Report (GAIN). GB 2762–2017.
- Wolnik KA, Fricke FL, Capar SG, Braude GL, Meyer MW, Satzger RD, Bonnin E. 1983. Elements in major raw agricultural crops in the United States. 1. Cadmium and lead in lettuce, peanuts, potatoes, soybeans, sweet corn, and wheat. J Agric Food Chem. 31(6):1240–1244.
- Yang JI, Cang L, Wang X, Xu HT, Zhou DM. 2020. Field survey study on the difference in Cd accumulation capacity of rice and wheat in rice-wheat rotation area. J Soils Sediments. 20(4):2082–2092.
- Zook EG, Greene FE, Morris ER. 1970. Nutrient composition of selected wheats and wheat products. VI. Distribution of manganese, copper, nickel, zinc, magnesium, lead, tin, cadmium, chromium, and selenium as determined by atomic absorption spectroscopy and colorimetry. Cereal Chem. 47:720–731.
Appendix
Table A1. Comparison of results from the analysis of replicate test portions (N) of certified and in-house reference materials for cadmium (mean ± standard deviation, mg/kg) by atomic absorption spectroscopy (AA) and inductively coupled plasma mass spectrometry (ICP-MS).