
 ?Mathematical formulae have been encoded as MathML and are displayed in this HTML version using MathJax in order to improve their display. Uncheck the box to turn MathJax off. This feature requires Javascript. Click on a formula to zoom.
ABSTRACT
This paper integrates a unique dimension of gender in the analysis of economic vulnerability in urban contexts by focusing on women aged 50 and older. We use a probit model to predict the likelihood of vulnerability with a zero-one dummy dependent variable, and four categories of socioeconomic characteristics as predictors: educational attainment, labour market participation, individual demographics, and household characteristics. Using a pooled cross-section of data from the American Community Survey (2013–2017 5-Year estimates), we explore the transmission channel of vulnerability across the four largest cities in the US. The results show, through average marginal effects, a strong association between economic vulnerability and key socioeconomic indicators. The findings support the view that gender differences in labour market participation remain key in explaining disparities. Our two policy prescriptions focus on a more targeted approach in implementing retirement policy changes and loosening the link between labour supply and income.
Introduction
In the last four decades, socioeconomic inequality in the United States has been on the rise, culminating in the recent backlash against economic globalisation, international migration, and other neoliberal economic policies. While the rise of nationalism and protectionism has been observed in much of the Western world, the backlash against economic globalisation has been more pronounced in the US.
Recent events in the US have underscored the need for pragmatic interventions aimed at closing existing racial, gender, income, age, and urban inequalities to address persistent poverty. Growing levels of inequality continue to generate concerns, thereby featuring persistently on the front burner of the national public policy debate; albeit many pragmatic policy and programmatic interventions capable of addressing existing structural barriers to social and economic mobility can be implemented at the sub-national level. While the debate on socioeconomic inequality has traditionally focused on national trends, compared to regional and central governments, cities are often in a better position to address the needs of low-income neighbourhoods. Nonetheless, the country-level engagements in many research initiatives resonate because studies and data capturing variations across race, ethnicity, class, gender, age, and other important socioeconomic indicators are often aggregated at the national level. The reality is poverty and inequality are multifaceted phenomena with profound social, economic, political, spatial, and environmental consequences at the local and regional levels.
In this study, not only do we articulate the importance of the urban context in broader poverty and inequality discourses, but we also integrate a unique dimension of gender in the analysis. Gender diversity in the workplace is not just a social justice issue; it is, in fact, an economic and business imperative. Maximising female workforce participation is good for economic and social well-being. While educational and labour market opportunities for US women improved significantly in the second half of the 20th century, the trend has stagnated and reversed since 2000, with women’s labour force participation falling from 60.7% in 2000 to 57.2% in 2016 (Schanzenbach and Nunn Citation2017).
The combined effects of social norms and education are a key determinant of the final labour supply and demand outcomes; however, women labour force participation decisions are often driven by individual preferences, family circumstances, and labour demand conditions. Compared to a similar age cohort of men, women bear a greater burden of childcare and other family responsibilities; earn lower incomes and are less likely to have jobs; are more vulnerable to financial insecurity; and when employed, are more likely to have part-time jobs with fewer benefits (Webber and Williams Citation2008; Bianchi Citation2011; Carnevale et al. Citation2018). It is imperative for any efforts targeted at addressing these issues to consider the urban, class, age, and gender contexts under a joint framework. This is another major advance.
Public policy has a major role in addressing existing economic participation gender gaps, and by extension, economic vulnerability. In a bid to predict the likelihood of economic vulnerability, we estimate a probit model with a set of socioeconomic characteristics as predictors. These socioeconomic predictors fall under four categories: educational attainment, labour market participation, individual demographics, and household characteristics. For instance, compared to their male counterparts, less educated older women are much more likely to be economically vulnerable. The probability of vulnerability will likely be higher for older women who are unemployed or work part-time. This trend may be exacerbated by being disabled, being a person of colour, or having any dependents. Broadening the definition of poverty to economic vulnerability in a bid to predict the likelihood of vulnerability with various socioeconomic characteristics as predictors in urban contexts is the third major contribution.
We contribute to the gender equality in economic participation debate in a unique way by exploring the socioeconomic channel in the four largest cities in the US. This is particularly important because socioeconomic status encompasses not just income and poverty, but also educational attainment, employment, occupation, financial security, quality of life, and other opportunities and privileges that drive social and economic mobility. Our focus is older women in large cities because we want to identify the unique set of characteristics associated with vulnerability for this cohort. In the process, we pay special attention to the unique attributes of cities, considering how agglomeration economies and productivity shape labour market outcomes.
The rest of the paper is structured as follows. In the next section, we review related literature in a bid to evaluate the contributions of previous scholars, while also setting out a concise premise within which our work is located. Section 3 discusses the framework and estimation strategy, shedding light on how the probit model is used to predict the likelihood of vulnerability with a zero-one dummy dependent variable, and four categories of socioeconomic characteristics as predictors. Section 4 presents and discusses the results, while the fifth section provides concluding remarks and implications for policy.
Literature review
Background
Contemporary metropolitan research and policy initiatives aimed at addressing poverty and inequality have tended to use simplistic frameworks that underrepresent the heterogeneous effects of ageing, financial vulnerability, labour force participation, and other key socioeconomic characteristics on labour market outcomes for women. This work broadens the definition of poverty to economic vulnerability and predicts the likelihood of vulnerability with various socioeconomic characteristics as predictors in urban contexts. To the extent that urban centres remain key in fostering diversity and economic, educational, and social opportunities, this paper sheds light on the significant disconnect between the dependence of cities on agglomeration economies and productivity to shape labour market outcomes and the barriers faced by older women.
Age and gender discrimination
The economic costs and benefits associated with gender gaps and women labour underutilisation have been reviewed extensively in the literature. Aguirre et al. (Citation2012) argue achieving gender parity in labour force participation rate would increase GDP by the specified percentages in the following countries: US (5%), Japan (9%), United Arab Emirates (12%), and Egypt (34%).
Older women in the US face the twin challenges of age and gender-related discrimination. Although older women are a growing subset of the population, research on gender discrimination is generally focused on all age groups. Despite women achieving some gains in recent years, discrimination persists. In 2018, women who were full-time wage and salary workers earned 81.1% of men’s wages in a comparable group (United States Bureau of Labor Statistics Citation2019).
The empirical literature on the extent and trends in gender wage gaps provides varying degrees of insights. Blau and Kahn (Citation2017) use Panel Study of Income Dynamics (PSID) microdata over 1980–2010 and conclude that pay gap at the top of the income distribution has declined much more slowly than at the middle or bottom. They also show that differences in occupations and industries, as well as gender division of labour, are important determinants of the pay gap.
Other research points to evidence of sex discrimination in explaining pay disparities and hiring (Goldin and Rouse Citation2000; Hersch Citation2006). In what is termed the ‘quiet revolution’, Goldin (Citation2015a) explains that women’s participation has increased significantly in occupations that were once heavily male-dominated. Using data from the beginning of the 20th century until recently, Goldin explains the pollution theory of discrimination and shows that occupations that tended to be restrictive were those that paid above the female median wage, while those that paid below the female median wage were less restrictive and more inclusive of women. Goldin further shows that in the modern context, progress has been made to break down barriers at the top of the income and educational attainment distributions (e.g., lawyers and physicians), but ‘frog ponds’ – i.e., workplaces with particular characteristics and skills (e.g., firehouses, police departments, and trading floors in the financial sector) – still remain.
In the presence of employer uncertainty about worker productivity, firms have been shown to discriminate against women and minorities (Royalty Citation1996; Altonji and Blank Citation1999). A field experiment by Correll et al. (Citation2007) in which the researchers sent resumes and cover letters from fictional, equally qualified applicants to employers, found that prospective employers called mothers back about half as often as nonmothers, while fathers did not have any disadvantages in the hiring process. This discrimination is more profound for older women. Carlsson and Eriksson (Citation2019) ran a field experiment of over 6,000 fictitious resumes and randomly assigned information about age in Sweden and found that callback rates begin to fall substantially for workers in their early 40s and becomes very low for workers close to retirement age. Data from the United States Equal Employment Opportunity Commission (Citation2019) show that more than 20% of its discrimination cases are focused on age discrimination.
Family dynamics and differentiation of role
A model in which the household production process is based on pooling of income and sharing of consumption will have implications for needs, activities, the use of time, and family behaviour in general. To the extent that the allocation of time between market and nonmarket activities for households is asymmetric, and often tilted more towards nonmarket activities for women, complementarity and substitutability in family members’ time will have implications for economic psychology and differentiation of roles (Mincer and Polachek Citation1974). Gender differences in work experience and work hours also offer important insights into the wage gap (Flabbi and Moro Citation2012; Gayle et al. Citation2012).
Financial vulnerability and the burden of household responsibilities
Research also points to women undertaking a disproportionately higher burden of household responsibilities and working fewer hours compared to men. Generally, more men than women working full-time penalises wages earned and opportunities over women’s careers (Goldin Citation2015b). As the paper notes, women are more likely to work fewer than 40 hours per week. Despite being paid less, women’s earnings are key to the economic stability of families (Milli et al. Citation2017). The economic imperative for increased female participation in the economy is clear; addressing the issue of gender disparities in the labour force could open up currently untapped economic growth opportunities.
Concurrently, older populations encounter more obstacles in pursuing employment. Neumark et al. (Citation2019) created over 40,000 fake job applications and measured the call back rates to infer discrimination. They found that call back rates decreased significantly as age increased in almost all occupations. Looking at the economic well-being of older women also points to disparities. An analysis of gender disparities in older populations’ financial insecurity reveals that women are disproportionately more likely than men to face a poverty risk in the 27 European Union countries considered (Vlachantoni Citation2012). This research outlines how the design of pension systems disadvantages women with atypical employment patterns by emphasising uninterrupted periods of full-time employment, whereas other studies note that women in Europe are more likely to work part-time (Blau and Kahn Citation2013; Ilinca et al. Citation2016). This finding is also relevant to the US; a congressional report concludes that the median income for women ages 65 or older is 44% less than that of men, while women ages 75 and older are twice as likely to live in poverty (United States Congress Citation2016).
Wealth gap
In addition, studies show a stark contrast between women and men in accumulating wealth and assets, leading to worse economic outcomes in later life. Using data from PSID, Schmidt and Sevak (Citation2006) find that while households headed by a single female and single male show no significant wealth gaps, a comparison of their older counterparts reveals wide wealth gaps favouring men over women. Yuh (Citation2011) estimates that 44% of pre-retired households will not be able to maintain 70% of permanent income standard in retirement. This lack of adequate retirement savings is especially acute for older widows, who on average suffer a 30% drop in living standards on becoming widows (Holden and Zick Citation2000).
Although Social Security plays an important role in the retirement security of aged women, about 13.9% of widowed women aged 65 or older, 15.8% of divorced elderly women, and 21.5% of never-married elderly women have family incomes below the official poverty line in 2017 (Congressional Research Service Citation2019).
Health and recessionary shocks
In economic downturns, older women’s employment is also less resilient compared to their male counterparts. Monge-Naranjo and Sohail (Citation2015) found that long-term unemployment affected older women more, compared to older men, following the Great Recession of 2008. In the period before the recession (2006–07), the share of unemployed in long-term unemployment was 14% for women 65 and older; this climbed to 50% in the period after the recession (2012–13), an increase of 36 percentage points. For men 65 and older, the pre-recession ratio was 23%, compared to 48%, post-recession (an increase of 25 percentage points).
Older individuals have a higher incidence of involuntary job separations. Johnson and Gosselin (Citation2018) show that among US adults who had been working full-time in a long-term job, 56% of men and 57% of women experienced an employer-related involuntary job separation after age 50. The findings reveal further that women are somewhat more likely than men to leave a job involuntarily for personal reasons, primarily because women are more likely to experience health problems. The research also shows forced retirements increasing over time for both men and women, across all educational and racial and ethnic groups. For women, 50% of retirees reported being forced or partly forced to retire in 2014, up from 32% in 1998. Evidence also supports that women place greater priority on family responsibilities, with women more likely to quit jobs for family-related reasons, while men are more likely to quit for job-related reasons (Keith and McWilliams Citation1995; Sicherman Citation1996).
Poverty and vulnerability modelling
In poverty modelling, linking poverty incidence or consumption with determinants is very popular. The calculation of poverty indicators often depends on official statistics based on different poverty lines for different jurisdictions. The concept of economic vulnerability is complex and multifaceted. In a micro-theoretic sense, the line between poverty and economic vulnerability is blurry; there is no consensus in the economic development literature on the ideal measure of vulnerability.
Sen (Citation1976) concludes that the aggregate sum of individual poverty levels is, by implication, society’s poverty. Morduch (Citation1994) and Dercon and Krishnan (Citation2000) propose consumption and income smoothing as a risk sharing and vulnerability reduction strategy. While traditional poverty measures define a certain level of wellbeing below which the population of interest is targeted, more recent literature has begun to focus on the risks associated with falling below that poverty threshold due to fluctuations in well-being (Gallardo Citation2018).
There are a few studies that focus on the relationship between incidence of poverty and individual and household characteristics, which in turn have implications for poverty reduction. Biyase and Zwane (Citation2018) use panel data to study factors that influence poverty and welfare. Through a random effect probit estimation, they find that levels of education, dependency ratio, and employment status are all statistically significant determinants of welfare. A similar study conducted in Turkey by Sedefoglu and Akay (Citation2016), using probit models, concludes that education, age, gender, and employment sector are associated with poverty incidence. Both studies also find that urban households are less likely to be exposed to poverty than rural households.
Methods and empirical strategy
Empirical model specification
Our analysis is based on the probit model. This econometric approach for dichotomous outcome variables models the inverse standard normal distribution of probability as a linear combination of the predictors. The main idea behind the model is to predict the likelihood of economic vulnerability with a zero-one dummy dependent variable, and a set of socioeconomic characteristics as predictors. The socioeconomic variables we consider fall into one of four categories: educational attainment, labour market participation, individual demographics, and household characteristics.
We model economic vulnerability as a binary choice model with y as the dependent variable, determined by a pooled cross-section probit regression on x, the set of socioeconomic characteristics:
where the function 1[condition] equals one if the condition is true and zero if it is false.
For our purposes, we define economic vulnerability (y) as having main, real income less than the 40th percentile of the real wage distribution in each city or having any form of public assistance. Among the regressors (x), we characterise education level into five categories depending on the individual’s highest educational attainment: ‘Less than High School’, ‘High School’, ‘Some College’, ‘Bachelor’s’, and ‘Masters or above’. We classify employment into three categories based on work hours: unemployed (working zero hours), part-time (working less than 35 hours in a week), and full-time (working 35 or more hours in a week).Footnote1
The industry sectors of work are classified into ‘Finance, Insurance and Real Estate and Leasing’, ‘Professional’, ‘Labour-Intensive’, ‘Manufacturing’, ‘Wholesale Trade’, ‘Retail Trade’, ‘Information’, ‘Entertainment’, ‘Services’, ‘Education’, ‘Medical’, ‘Social Care’, and ‘Administrative Services’ based on the industrial classification system recorded by Integrated Public Use Microdata Series (IPUMS) (Citation2012). The occupational categories in American Community Survey (ACS) have been recategorised into five broad classifications: ‘Professional’, ‘Technical’, ‘Community’, ‘Service/Aid’, and ‘Labour-Intensive’ depending on the occupation description. For example, professional occupations include jobs such as financial managers, human resources managers; technical occupations include web and software developers and information security analysts; community occupations include social workers and clergy; service/aid occupations include nursing aides and dental assistants; and labour-intensive occupations include assemblers and fabricators, food processing workers etc.
Among individual characteristics, race categories are ‘White’, ‘Black’, ‘Asian’, ‘Hispanic’, and ‘Other’. Age is a numeric variable and presence of disabilities is coded as 1 if the individual is classified as disabled. An interaction term for race and education is also included, which captures the differential effect of college education and above on persons of colour. It is categorised as 1 if a non-white individual has a level of education of Bachelor’s and above. To capture the effect of whether being single or married at an older age has an impact on vulnerability, we also include a dummy variable characterising individuals that have a single female head of household in the labour force. Finally, we include a dummy for presence of dependents, taking a value of 1 if the individual has any related children, grandchildren living in the household, and presence of persons 65 years and over in the household when the individual is below 65.
Estimation strategy
We take a closer look at the cohort of economically vulnerable older women (specifically, women over 50) across four cities in the US: New York (NYC), Chicago (CHI), Los Angeles (LA), and Houston (HOU). Based on data from ACS, we calculate that in 2017, real wages at the 40th percentile are $31,859.13 for NYC, $30,877.71 for Chicago, $27,302.1 for Houston, and $24,268.54 for LA.
We do not use poverty line as a measure of economic vulnerability; doing so limits the possibility of focusing on the group that is currently poor. We model income vulnerability by recognising that there are downside risks a person faces in relation to how much above or below the poverty threshold they are in. Focusing on the bottom two quintiles captures the actual case of being below the poverty line, as well as chances of being below or near poverty. A similar approach is adopted by the World Bank (Citation2019).
In our categorisation of the economically vulnerable cohort, we also include women who may have income greater than the 40th percentile threshold, but who are on any form of public assistance, since such welfare dependency directly signals economic vulnerability. This is intended to complement the inclusion of individuals that are below the 40th percentile, since there may be individuals that are above the income threshold but still qualify for welfare assistance. Our definition is not directly linked to the probability of falling into poverty – every individual below the 40th percentile threshold is potentially vulnerable. In short, vulnerable women in the workforce are defined as those whose main income is less than the 40th percentile real wages, or those on any form of public assistance.
Educational attainment, labour market participation, individual demographics, and household characteristics all influence the likelihood of being vulnerable. In addition to the separate influence of each of these four categories, we consider the impact of interactions between predictor pairs on the dependent variable. These are captured through the average marginal effects, which explain the change in probability when the predictor changes.
Data sources
The pooled cross-section data for the study come from the ACS (2013–2017 5-Year estimates). Metropolitan Statistical Area (MSA)-level GDP data for the selection criteria for comparator cities come from the United States Bureau of Economic Analysis (Citation2020). Public Use Microdata Area (PUMA) data and regional division data are from the United States Census Bureau (Citation2019). To facilitate cross-regional comparisons, four cities are chosen: NYC, Chicago, LA, and Houston. These four regions have the largest average nominal GDP from 2007 to 2018 in the US. The Census Bureau divides the country into four major census regions: Northeast, Midwest, West, and South. Including NYC, Chicago, LA, and Houston ensures regional variations across the largest cities in the US are captured.Footnote2 In addition, when referencing ‘older women’, the cut-off age is 50. Therefore, the descriptive analytics and models that follow are based on women over 50. The sample sizes for each metro after these restrictions are incorporated are 34,951 sample points for NYC, 19,349 for Chicago, 15,963 for LA, and 42,535 for Houston.
Descriptive analytics
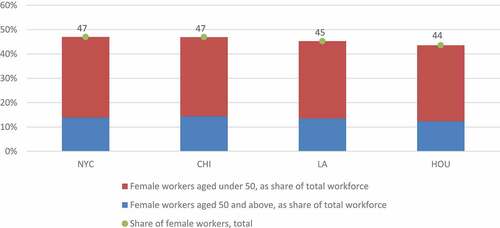
In this section, we use ACS data to establish some facts on the composition of the above 50 female work force in the four selected cities. Accounting for the characteristics in a descriptive sense will provide guidance on understanding the subsequent results of the estimated model. shows the share of female workers overall and female workers aged 50 and above. Across all four cities, less than half of the workforce is female, and a third of the female workers are above 50.
Figure 1. Female workers as share of total workforce, by age.
Across all four cities, the educational distribution of the labour force by gender and age group (under 50 and 50 plus) reveals that older women are less likely to have higher levels of education, compared to younger women and men in the same age range. For the NYC labour force, for example, 2.9% are women over 50 with a Bachelor’s degree, compared to 10.6% for women under 50 and 3.3% for men over 50. We see similar trends in the other three cities (see in the appendix section).
A quick examination of both industry and occupational distributions of the labour force shows that the professional sector is among the largest in all four cities, and the largest proportion of labour force in the professional sector are men under 50, followed by women under 50, men over 50, and women over 50. In terms of occupational distributions, roughly 5 to 6% of the labour force in the four cities are women over 50 in professional category occupations, compared to women under 50 at about 11% and men over 50 at roughly 4% (see in the appendix section).
Based on racial and/or ethnic distribution, most of the working population is White, followed by Hispanic, except in Houston with almost equal proportions of White and Hispanic. Black community is the third largest in NYC, Chicago, and Houston, while the Asian community is the third largest in LA (see in the appendix section).
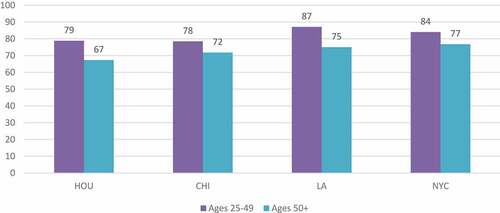
Next, we analyse the wage gaps by city and ethnicity. Currently, there is no consensus on the preferred method for measuring the gender wage gap; estimates often depend on data sources and assumptions underlying which workers are included in the sample (i.e., age and hours/weeks worked), earnings type, and typical earnings (i.e., average or median). Our methodology is based on median wages of employed women that either work or live in the reference city, as cents on every dollar earned by a man living/working in the same city. A cross-city comparison reveals that NYC has the narrowest wage gap at 77 cents for every dollar earned by a man (). However, for a younger cohort, specifically those aged 25–49, LA has the narrowest wage gap at 87 cents to a dollar. Houston has the widest wage gaps for both age cohorts, with the gap worsening for older women.
Figure 2. Cross-city comparison of median wages as a fraction of men’s wages by age bracket, cents per dollar.
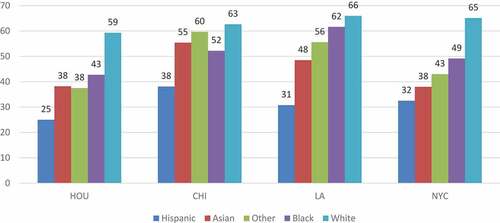
Looking at the gender wage gap by race/ethnicity shows that women of colour feel income disparities most acutely, and this trend is upheld across all four cities. Women of Hispanic ethnicity in particular face the widest gaps across all four cities, with median wages in Houston for a Hispanic woman almost a quarter of median wages for a White man over 50 (). Furthermore, LA has the smallest differential between median wages for Black and White (62 cents and 66 cents to a dollar, respectively).
Figure 3. Cross-city comparison of median wages as a fraction of men’s wages by race/ethnicity, cents per dollar.
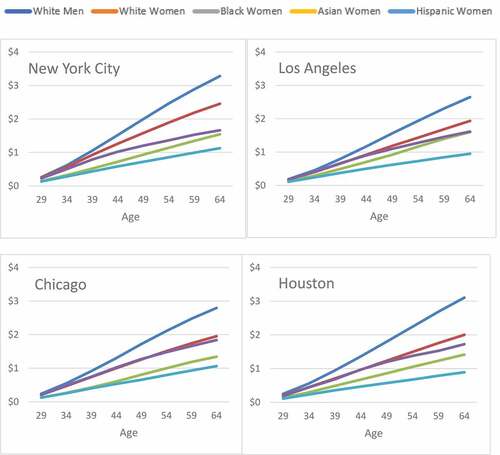
Gender wage gaps at every age mean that differences in earnings between men and women compound quickly, resulting in several thousands of dollars lost every year. Cumulated over lifetimes, women, especially women of colour, lose out on millions of dollars (). Across all four cities, Hispanic women are the most disadvantaged, with much lower cumulative median lifetime incomes, compared to White men’s lifetime incomes.
Figure 4. Cross-city comparison of cumulative median lifetime income by gender and race, millions.
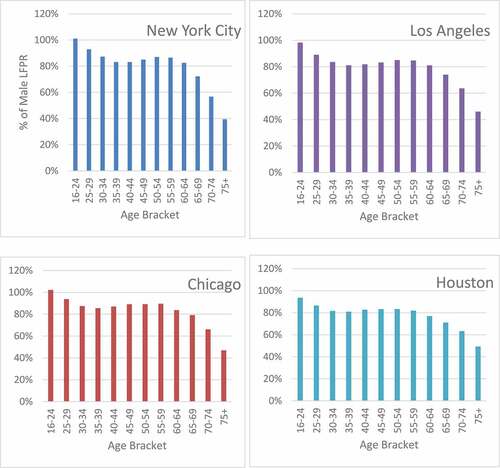
Also, labour force participation (LFP) gaps tend to widen as women get older. Our analysis shows that female labour force participation rates (LFPR) across all four cities, relative to males, follow the same trend as age increases (). For the youngest age bracket (16–24), they all have roughly 1:1 LFPRs, followed by a decline till 35–39, before a slight uptick till 50–54/55-59, and then a consistent decline after 60. The fall in the labour participation of women compared to men in the age ranges of 25–29 and 30–34 is possible due to these age ranges coinciding with the age of childbearing, but there is no straightforward explanation for the decline of female LFPR at older ages. Understanding this trend will require a more nuanced analysis, which is outside the scope of this paper.
Figure 5. Cross-city comparison of ratio of female to male participation rates by age group, %.
Estimation results and discussion
Estimation results
In this section, we analyse economic vulnerability for older women based on probit modelling of socioeconomic characteristics in each of the four cities. Our definition of economic vulnerability is neither a defining attribute nor an exclusive characteristic. Our focus is one-dimensional economic vulnerability, and not multidimensional vulnerability,Footnote3 which is beyond the scope of this paper. Furthermore, the analysis focuses on individuals vulnerable to one-period poverty; this conceptual framework does not address the concept of multi-period,Footnote4 or persistent poverty. Questions of long-term social mobility of individuals can be better answered with analysis of multi-period economic well-being indicators.
While a probit model is superior to a linear regression model since predicted probabilities are restricted between 0 and 1, with the probate incorporating non-linear effects of regressors, the coefficients from a probit regression are not as straightforward to interpret as those from a linear regression. Using average marginal effects rather than absolute changes addresses this challenge. We also run logit regressions as part of our robustness tests; the results are not significantly different from the probit analysis. The diagnostics are consistent with probit modelling of the inverse standard normal distribution of probability as a linear combination of predictors in a Stata environment. We discuss these results below.
Educational attainment
Compared to the group whose highest level of education is ‘Less than High School’, each higher level of education reduces the chances of vulnerability (). Having a bachelor’s degree reduces the probability by 23.4, 21.2, 26.3, and 21.9 percentage points (ppts) in NYC, Chicago, Houston, and LA, respectively. In comparison, the effects are stronger for a master’s degree or more: at 29.9, 29.4, 31.6, and 26.6 ppts, respectively. Notably, higher education has stronger effects on reducing the likelihood of vulnerability in NYC and Houston, compared to Chicago and LA.
Table 1. Regression results for women over 50
The fact that higher education has such a strong effect on reducing the likelihood of economic vulnerability does not come as a surprise. It is well documented that large cities draw a disproportionate share of highly educated workers, and this trend has been growing in recent decades, through the higher wage differential for the highly educated, compared to equally educated workers in a smaller town (Federal Reserve Bank of Philadelphia Citation2015). Two possible explanations are offered for this trend: (1) agglomeration externalities, where gains in efficiency are achieved because of high concentrations of workers, customers, suppliers, and rival firms coexisting in a given city, and (2) big cities are increasingly being valued highly for consumption amenities stemming from easy access to a wide variety of goods and services.
Labour market participation
The results show that in addition to unemployment, employment in industries like social care and services, and engagement in occupations such as service/aid workers increase the probability of vulnerability the most. We see that changing employment status from unemployed to employed reduces the likelihood of vulnerability. Part-time work does not play as important a role in reducing vulnerability as does full-time work. Full-time employment has the maximum effect of reducing the likelihood of vulnerability, by 66.2 to 68.8 ppts from the baseline, across all cities.
Being employed in certain industries also increases the chances of economic vulnerability. When compared to the FIRE (finance, insurance, real estate, and leasing) category, being employed in social care increases the likelihood to the maximum extent possible in all cities. This is followed by employment in the services industry in NYC and LA. In Chicago, employment in Retail Trade contributes the second largest increase in the probability of vulnerability, and in Houston, the corresponding industry is Entertainment. The type of occupation in an industry matters too. Compared to those whose current occupation is Professional, being a Service/Aid worker increases the likelihood by 16.8 ppts in Chicago to 20.5 ppts in NYC. Working in a labour-intensive occupation also increases the probability by 19.1 ppts in Chicago to 20.8 ppts in LA. Again, these trends support the notion that industries like professional services and finance are concentrated in large cities and generate high-wage occupations that are typically held by people with at least a bachelor’s degree.
Individual and household characteristics
Race and disability are statistically significant, implying that the likelihood of vulnerability is impacted by individual characteristics beyond one’s control. A woman of colour is significantly more likely to be economically vulnerable than a White woman, ceteris paribus. In particular, being Asian increases the probability by about 7.9 to 9.9 ppts; and being Hispanic by about 7.0 to 12 ppts.
As discussed under the empirical strategy section, unlike in linear models where the interpretation of the coefficient of the interaction between two variables is unambiguous, it is a little complicated under nonlinear models. This is because the average marginal effect of a change in the interacted variables is not necessarily the same as the marginal effect of changing only the interaction term. Across all four cities, LA is the only region where we notice a significant interaction between race and education. When a person of colour attains a bachelor’s degree or higher, there is a further reduction in vulnerability, compared to a White person attaining the same qualifications.
As well, the presence of a disability is statistically significant across all four cities: disability increases the likelihood of vulnerability by 2.8–5.8 ppts. The presence of any dependents is also statistically significant; it increases the chances of vulnerability by about 1.1–3.1 ppts, compared to the baseline of no dependents.
Comparison with control groups
To compare the results above with predicted probabilities of economic vulnerability among the control groups, the probit regression is conducted for two additional cohorts: women under 50 and men above 50. For both groups, we found that the same socioeconomic characteristics are also good predictors of economic vulnerability, albeit with different magnitudes of impact across the three groups.
When compared to women under 50, the impacts of higher levels of education are smaller for women over 50 on reducing chances of vulnerability in all four cities (). However, being employed has a larger impact on reducing the likelihood of vulnerability for women over 50 than women under 50 in the four cities. Similar to the finding for women over 50, part-time work does not play as important a role in reducing vulnerability as does full-time work. By industry of employment, the probability of vulnerability for women under 50 is increased the most when employed in social care, similar to women over 50. However, employment in the social care sector increases the likelihood of vulnerability for older women more than younger women in three of the four cities. For younger women, our results reveal that the probability of vulnerability increases the most when the occupational category is service/aid, with a much larger increase for older women. Race, disability, and presence of dependents are significant for younger women too. However, being Hispanic increases the likelihood of vulnerability for older women in all four cities. Disabilities penalise younger women more in these cities, but the effect of having dependents is stronger for older women in Chicago and Houston. The interaction of race and college is significant and larger for reducing economic vulnerabilities for younger women in Chicago and Houston.
Table 2. Regression results for women under 50
When compared to men over 50, the impacts of higher educational attainment are stronger for women over 50 on reducing the likelihood of vulnerability in all four cities (). Similar to when compared to younger women, comparison with older men also shows that being employed has a larger impact on reducing the probability of vulnerability for women over 50; part-time work does not play as important a role in reducing vulnerability as does full-time work.
Table 3. Regression results for men over 50
By industry of employment, for men over 50, being employed in the services sector in NYC, in the entertainment sector in Chicago, and social care in Houston and LA increases the probability of vulnerability the most. Comparing the likelihood of vulnerability when employed in the social sector for both groups reveals that the probabilities are higher for women. In terms of occupational categories, it is no surprise that service/aid occupations increase the probability of vulnerability the most across all occupational categories for older men as well; however, these effects are larger for older women in all four cities. As with the other two cohorts, race, disability, and the presence of dependents are significant for older men too. However, being Hispanic increases the likelihood of vulnerability for older women in all four cities.
Disabilities penalise younger women more in these cities, but the effect of the presence of dependents is stronger for older women in Chicago and Houston. The interaction of race and college is significant and larger for reducing economic vulnerabilities for younger women in Chicago and Houston. Broadly, the impacts of race on the probability of vulnerability are stronger for men than for women, with the exception of being Hispanic in Houston and Los Angeles, where the effects are stronger for older women. The interaction between race and college is significant in NYC and Chicago for older men, and stronger for men than for women.
Discussion
Our overview of the gender wage gap reveals a consistent gap between the wages of men and older women across the four largest cities in the US. Disaggregation by race and ethnicity further reveals the acute gaps for women of colour. Our regression analysis underscores the importance of gender and age differences in education and employment, as well as occupation and industry status along with individual and household demographic characteristics. In particular, our analysis validates the hypothesis that older women who have low levels of education, are unemployed or work part-time, or work in social care or services (or employed as service/aid workers) are much more likely to be economically vulnerable compared to women under 50 and men above 50. Furthermore, being disabled, being a person of colour, or having any dependents increases the probability of vulnerability for older women.
In spite of the relatively robust results reported above, we caveat the outcome: some of the independent variables included in the analysis may be correlated with each other. For example, the number of dependent children may be endogenous with respect to women’s labour force decisions, such as part-time work or working in an occupation that allows for more flexibility. Nonetheless, we obtain similar results upon excluding these variables in our robustness checks.
Furthermore, when we draw comparisons between the target group (women over 50) and the two control groups (women under 50 and men over 50), we highlight the impacts of the same set of socioeconomic predictors on the probability of being economically vulnerable. Probit coefficients lead to the odds ratio interpretations which are not necessarily comparable across groups or across time without assuming that the unobserved heterogeneity is the same across the groups being compared. However, by making comparisons at the same point in time, our model is justifiable because we include the same variables in both the target and control models, and therefore, conditional probabilities are based on the same set of characteristics, which allow for a high-level comparison. One might think of the probability of economic vulnerability as the outcome of certain characteristics, in which case it is useful to compare the differences in likelihoods among the two groups, because that can be attributed to unexplained characteristics such as discrimination, biases in hiring, etc.
In all, the estimated average marginal effects clearly establish a strong association between economic vulnerability and socioeconomic indicators across all four cities. The results agree with the findings of Biyase and Zwane (Citation2018), and Sedefoglu and Akay (Citation2016), also based on probit analysis of association of vulnerability with socioeconomic characteristics. We find that low levels of education are highly correlated with economic vulnerability.
Indeed, over the years, there has been marked greater participation of more educated women in the labour force, likely because of the knowledge economy and the rising returns to skill for highly educated workers (Autor et al. Citation2008). By implication, less educated workers are further marginalised by both the returns to higher education as well as widening wage inequality. Our results confirm that part-time work contributes to the likelihood of vulnerability and this broadly agrees with Goldin (Citation2014) who opines that occupational flexibilities often result in high wage penalties. The results on occupation and industry status agree with the findings of Blau and Kahn (Citation2017) that gender differences in labour market participation remain important in explaining disparities, despite occupational upgrading of women relative to men.
Conclusion and policy implications
A major motivation for this paper was the need to take a closer look at the twin issues of vulnerability and socioeconomic status from an urban perspective. We employed a probit model to predict the likelihood of economic vulnerability, based on a set of socioeconomic characteristics. To the extent that agglomeration economies and productivity remain important in shaping urban labour market outcomes, results were robust to the predictors.
The results, taken together, have interesting implications for policy. Public policy has a major role in addressing vulnerability and gender gaps in economic participation. Structural economic transformation implies a dynamic reallocation of factors from less productive to more productive sectors, especially in the digital age. Low female labour participation rate therefore limits the ability to leverage existing productivity gains to maximise output.
Gender disparities are a major deadweight loss. As discussed earlier, achieving economic and social mobility requires fixing existing structural barriers. Considering that socioeconomic mobility goes beyond more income and the absence of poverty, it is important to view gender gaps through multiple lenses, in order to give a nuanced policy attention to other key components like educational attainment, employment, occupation, financial security, and quality of life. Other subjective factors, like opportunities and privileges, are also fundamental to achieving an optimal policy solution.
Taken together, our findings suggest the opportunity cost of not fully utilising the productive capacity of women in the economy is huge; this hinders the ability of cities to foster economic, educational, and social opportunities. Addressing specific issues that reduce the likelihood of vulnerability will go a long way. With this in mind, we offer two policy recommendations below.
First, discouraging early retirement in a bid to strike the right balance between contributions and benefits can help address the distortionary impacts of childcare, household responsibilities, and maternity leaves on women’s pensions. This can be achieved, for instance, by subsidising women with children, as done in countries like Canada, France, Sweden, and Germany. A more targeted approach will involve implementing retirement policy changes to address the gender wealth gap. As discussed earlier, women are paid less on average than men, participate in the workforce at lower rates than men, and reach peak earnings earlier in their careers. These factors, taken cumulatively, imply that women have fewer opportunities to contribute to savings and retirement accounts like 401(k) and Individual Retirement Accounts (IRA). In this way, the gender wage gap may contribute to the gender wealth gap. Currently, contribution limits for 401(k) plans are $19,500 for workers under age 50, and $26,000 for those 50 and over. For IRAs, the limit is $6,000 for those under age 50, and $7,000 for people 50 and over (United States Internal Revenue Service Citation2020). A potential option is for federal policy to allow women to contribute to their retirement accounts during their high wage-earning years, such as by doubling the 401(k)/IRA allowable contribution or allowing backfilling prior years of savings.
As discussed under the literature section, policies targeted at boosting women’s economic participation often increase the incentives to work (Aguirre et al. Citation2012). Therefore, publicly financed training programmes that loosen the link between labour supply and income can trigger higher interests in labour market participation, especially for older, low-wage earning women. We therefore suggest a multi-pronged approach for identifying ‘opportunity occupations’ for older women; i.e., jobs that pay a living wage, are unlikely to be automated, and/or are relatively accessible via retraining or upskilling initiatives.
As discussed in Section 4, working in social care or services (restaurants, nail salons etc.) increases women’s financial vulnerability. Of course, we recognise that for older women, it is not straightforward to make a career change. Therefore, accelerated learning programmes, entrepreneurship incubators, scholarships for training, and venture capital funding specially targeted for this demographic – and supported by local governments, philanthropy, and the private sector – could make a huge difference. Better access to affordable and high-quality facilities for those with caregiving responsibilities will free up time for participation in job training and other activities capable of activating a re-entry into the labour market.
Acknowledgements
The authors would like to express their sincere gratitude to Joyce Jauer, Melissa Pumphrey, and Kyle Marks of the Economic Research & Policy Group at New York City Economic Development Corporation for their valuable inputs. The authors also thank Bertrand Teirlinck, Stephen Madsen, and Dani Stoilova for providing excellent research assistance and support.
Disclosure statement
No potential conflict of interest was reported by the author(s).
Data availability statement
The data that support the findings of this study are available from the corresponding author upon reasonable request.
Additional information
Notes on contributors
Fred Olayele
Dr. Fred Olayele is Chief Economist and Senior Vice President with the New York City Economic Development Corporation, where he oversees economic research and policy initiatives aimed at making New York the global model for inclusive growth and innovation – with collaborations across the public, private, philanthropic, and academic sectors. His research and practice focus on trade policy, innovation, FDI, urban policy, political economy, and inclusive development. He has published and shared best practices in these areas at numerous conferences and institutions around the world. Professor Olayele has taught courses in economics, strategy, and policy at the University of Regina and Carleton University, both in Canada. He has advised the Canadian provincial governments of British Columbia and Saskatchewan across the FDI, economic development, and energy policy domains. Earlier in his career, he was a global trade finance specialist with Citigroup. He has consulted widely and advised many public and private organisations in Canada, United States, and Africa. A passionate teacher and public intellectual, he is a Visiting Professor of Trade and Development at the University of Las Palmas de Gran Canaria in Spain. He was a Visiting Scholar at the World Trade Institute, Switzerland. Dr. Olayele serves on various non-profit boards and supports many social causes. He earned his PhD in Economics from Lancaster University, United Kingdom, and his MA in Economics from the University of Victoria in British Columbia, Canada.
Poorvi Goel
Poorvi Goel is an Assistant Vice President in the Economic Research and Policy Group at the New York City Economic Development Corporation. Her primary area of work includes applied economic research and public policy analysis, and she has authored several publications on a wide range of topics, including economic vulnerability, international trade, and development economics. She has previously served as a Research Officer in the Trade department of the Commonwealth Secretariat in London, UK. She has also worked in policy research and development practice roles with the United Nations Development Programme and Planning Commission of India. Poorvi holds an MPA in Development from Columbia University, an MSc in Economics from London School of Economics, and a BA (Hons) in Economics from St. Stephen’s College, Delhi.
Notes
1. The reference period for this variable is the past 12 months preceding the time when the survey question is answered.
2. For constructing community microdata sets for each of the four cities, we restrict data points to individuals either whose place or residence or place of work is within defined PUMAs of the reference city. For NYC, we extract ACS microdata for New York State as well as Connecticut, New Jersey, and Pennsylvania to capture workers that were commuting into the city for work, and filter individuals that have their place of work/place of residence in PUMAs 363,700, 3800, 3900, 4000, and 4100 (the five boroughs). For Chicago, ACS microdata are extracted for Illinois, Indiana, and Wisconsin, and filtered for individuals that had their place of work/place of residence in PUMA 1703400 (Cook County). Similarly, for Los Angeles, ACS microdata are extracted for California and Arizona, and filtered for PUMA 06 03700 (LA County), and for Houston, extracted for Texas and filtered for PUMA 4804600 (Harris County).
3. For further discussion on multidimensional vulnerability, refer to Whelan and Maitre (Citation2005); Abraham and Kumar (Citation2008); Calvo (Citation2008); Feeny and McDonald (Citation2016).
4. For further discussion on multi-period poverty, refer to McCulloch and Calandrino (Citation2003).
References
- Abraham R, Kumar K. 2008. Multidimensional poverty and vulnerability. Econ Polit Wkly. 43(20):79–87.
- Aguirre D, Hoteit L, Rupp C, Sabbagh K. 2012. Empowering the third billion: women and the world of work in 2012. New York: Booz and Company.
- Altonji J, Blank R. 1999. Race and gender in the labour market. In: Ashenfelter OC, Card D, editors. Handbook of labor economics (Vol. 3C). Amsterdam and Boston: Elsevier, North-Holland; p. 3143–3259.
- Autor D, Katz L, Kearney M. 2008. Trends in U.S. wage inequality: revising the revisionists. Rev Econ Stat. 90(2):300–323. doi:10.1162/rest.90.2.300.
- Bianchi S. 2011. Family change and time allocation in American families. Ann Am Acad Pol Soc Sci. 638(1):21–44. doi:10.1177/0002716211413731.
- Blau F, Kahn L. 2013. Female labor supply: why is the United States falling behind? Am Econ Rev. 103(3):251–256. doi:10.1257/aer.103.3.251.
- Blau F, Kahn L. 2017. The gender wage gap: extent, trends, and explanations. J Econ Lit. 55(3):789–865. doi:10.1257/jel.20160995.
- Biyase M, Zwane T. 2018. An empirical analysis of the determinants of poverty and household welfare in South Africa. J Dev Areas. 52(1):116–130. doi:10.1353/jda.2018.0008.
- Calvo C. 2008. Vulnerability to multidimensional poverty: Peru, 1998-2002. World Dev Elsevier. 36(6):1011–1020. doi:10.1016/j.worlddev.2007.10.001.
- Carnevale A, Smith N, Gulish A. 2018. Women can’t win: despite making educational gains and pursuing high-wage majors, women still earn less than men. Washington DC: Georgetown University Center on Education and the Workforce.
- Congressional Research Service. 2019. Social security: revisiting benefits for spouses and survivors. CRS Report R41479. Washington DC: Congressional Research Service.
- Correll S, Benard S, Paik I. 2007. Getting a job: is there a motherhood penalty? Am J Sociol. 112(5):1297–1338. doi:10.1086/511799.
- Dercon S, Krishnan P. 2000. Vulnerability, seasonality and poverty in Ethiopia. J Dev Stud. 36(6):25–53. doi:10.1080/00220380008422653.
- Federal Reserve Bank of Philadelphia. 2015. Big cities and the highly educated: what’s the connection? In: Business Review. Vol. Q3. Philadelphia: Federal Reserve Bank; p. 10–15.
- Feeny S, McDonald L. 2016. Vulnerability to multidimensional poverty: findings from households in Melanesia. J Dev Stud. 52(3):447–464. doi:10.1080/00220388.2015.1075974.
- Flabbi L, Moro A. 2012. The effect of job flexibility on female labor market outcomes: estimates from a search and bargaining model. J Econom. 168(1):81–95. doi:10.1016/j.jeconom.2011.09.003.
- Gallardo M. 2018. Identifying vulnerability to poverty: a critical survey. J Econ Surv. 32(4):1074–1105. doi:10.1111/joes.12216.
- Gayle G, Golan L, Miller R. 2012. Gender differences in executive compensation and job mobility. J Labor Econ. 30(4):829–872. doi:10.1086/666615.
- Goldin C. 2014. A grand gender convergence: its last chapter. Am Econ Rev. 104(4):1091–1119. doi:10.1257/aer.104.4.1091.
- Goldin C. 2015a. A pollution theory of discrimination: male and female occupations and earnings. Human capital in history: the American record. Chicago (IL): University of Chicago Press; p. 313–348.
- Goldin C. 2015b. Hours flexibility and the gender gap in pay. Washington DC: Center for American Progress.
- Goldin C, Rouse C. 2000. Orchestrating impartiality: the impact of “blind” auditions on female musicians. Am Econ Rev. 90(4):715–741. doi:10.1257/aer.90.4.715.
- Hersch J. 2006. Sex discrimination in the labor market. Found Trends Microeconomics. 2(4):281–361. doi:10.1561/0700000007.
- Holden K, Zick C. 2000. An assessment of the wealth holdings of recent widows. Journals of Gerontology Series B: Psychological Sciences and Social Sciences. 55: S90–S97.
- Ilinca S, Rodrigues R, Schmidt A, Zolyomi E. 2016. Gender and social class inequalities in active ageing: policy meets theory. Vienna: European Centre for Social Welfare Policy and Research.
- IPUMS. 2012. 2008-12 Industry Codes (IND). accessed 2020 May 8; https://usa.ipums.org/usa/volii/08indus.shtml
- Johnson R, Gosselin P. 2018. How secure is employment at older ages? New York: Urban Institute.
- Keith K, McWilliams A. 1995. The wage effects of cumulative job mobility. ILR Review. 49(1):121–137. doi:10.1177/001979399504900108.
- Carlsson M, Eriksson S. 2019. Age discrimination in hiring decisions: evidence from a field experiment in the labor market. Labour Econ. 59:173–183. doi:10.1016/j.labeco.2019.03.002.
- McCulloch N, Calandrino M. 2003. Vulnerability and chronic poverty in rural Sichuan. World Dev Elsevier. 31(3):611–628. doi:10.1016/S0305-750X(02)00216-4.
- Milli J, Huang Y, Hartmann H, Hayes J. 2017. The impact of equal pay on poverty and the economy. Washington DC: Institute for Women’s Policy Research.
- Mincer J, Polachek S. 1974. Family investments in human capital: earnings of women. J Political Econ. 82(2):S76–S108. doi:10.1086/260293.
- Monge-Naranjo A, Sohail F. 2015. Age and gender differences in long-term unemployment: before and after the Great Recession. Economic Synopses, Federal Reserve Bank of St. Louis, Issue 26. https://ideas.repec.org/a/fip/fedles/00052.html
- Morduch J. 1994. Poverty and vulnerability. Am Econ Rev. 84(2):221–225.
- Neumark D, Burn I, Button P. 2019. Is it harder for older workers to find jobs? New and improved evidence from a field experiment. J Political Econ. 127(2):922–970. doi:10.1086/701029.
- Royalty A. 1996. The effects of job turnover on the training of men and women. ILR Review. 49(3):506–521. doi:10.1177/001979399604900308.
- Schanzenbach DW, Nunn R. 2017. The 51%: driving growth through women’s economic participation. Washington DC: The Brookings Institute. The Hamilton Project.
- Schmidt L, Sevak P. 2006. Gender, marriage, and asset accumulation in the United States. Fem Econ. 12(1–2):139–166. doi:10.1080/13545700500508445.
- Sedefoglu G, Akay E. 2016. Determinants of poverty on household characteristics in Turkey: a heteroskedastic probit model. The Empirical Econ Lett. 15(6):555–563.
- Sen A. 1976. Poverty: an ordinal approach to measurement. Econometrica. 44(2):219–231. doi:10.2307/1912718.
- Sicherman N. 1996. Gender differences in departures from a large firm. ILR Review. 49(3):484–505. doi:10.1177/001979399604900307.
- United States Bureau of Economic Analysis. 2020. Gross domestic product by MSA [Data file]. accessed 2020 Feb 8; https://www.bea.gov/
- United States Bureau of Labor Statistics. 2019 March 22. The economics daily: women had higher median earnings than men in relatively few occupations in 2018. accessed 2020 Jun 9; https://www.bls.gov/opub/ted/2019/women-had-higher-median-earnings-than-men-in-relatively-few-occupations-in-2018.htm
- United States Census Bureau. 2019. American Community Survey 2013-2017 5-year estimates [Data file and data dictionary]. accessed 2020 Feb 9; https://www.census.gov/data.html
- United States Congress. 2016. Gender pay inequality: consequences for women, families and the economy. A report by the joint economic committee democratic staff. Washington DC: United States Congress.
- United States Equal Employment Opportunity Commission. 2019. Age discrimination in Employment Act [dataset]. accessed 2020 May 19; https://www.eeoc.gov/enforcement/age-discrimination-employment-act-charges-filed-eeoc-includes-concurrent-charges-title
- United States Internal Revenue Service. 2020. Information for retirement plans. [accessed 2020 Jan 17]; https://www.irs.gov/retirement-plans/plan-participant-employee/retirement-topics
- Vlachantoni A. 2012. Financial inequality and gender in older people. Maturitas. 72(2):104–107. doi:10.1016/j.maturitas.2012.02.015.
- Webber G, Williams C. 2008. Mothers in “good” and “bad” part-time jobs: different problems, same results. Gender Soc. 22(6):752–777. doi:10.1177/0891243208325698.
- Whelan C, Maitre B. 2005. Economic vulnerability, multidimensional deprivation and social cohesion in an enlarged European community. Int J Comp Sociol. 46(3):215–239. doi:10.1177/0020715205058942.
- World Bank. 2019. Global database of shared prosperity [Data file]. accessed 2020 Jan 7; https://www.worldbank.org/en/topic/poverty/brief/global-database-of-shared-prosperity
- Yuh Y. 2011. Assessing adequacy of retirement income for U.S. households: a replacement ratio approach. The Geneva papers on risk and insurance. Issues and Pract. 36:304–323.
Appendix A1.
Table A1. Educational distribution of the labour force by gender and age group
Appendix A2.
Table A2. Industry distribution of the labour force by gender and age group
Appendix A3.
Table A3. Occupational distribution of the labour force by gender and age group
Appendix A4.
Table A4. Race/ethnicity distribution of the labour force by gender and age group