
 ?Mathematical formulae have been encoded as MathML and are displayed in this HTML version using MathJax in order to improve their display. Uncheck the box to turn MathJax off. This feature requires Javascript. Click on a formula to zoom.
ABSTRACT
Maurer and Bretz developed a class of group-sequential weighted Bonferroni procedures with multiple endpoints. Performed as a step-down consonant shortcut to the group-sequential closed testing procedure, the class of procedures of Maurer and Bretz is simple to use for testing multiple endpoints in classical group-sequential settings. This class uses the correlations of sequential statistics, but does not leverage the correlations between endpoints. Thus, there is room for power improvement by suitably using the between-endpoint correlations in a group-sequential trial while maintaining strong control of the family-wise error rate. To this end, we propose a Holm-type step-down exact parametric procedure for situations in which between-endpoint correlations are known a priori or estimable. An adaptive strategy is suggested for situations in which such correlations are unknown. In addition, we briefly discuss a natural group-sequential extension of the partially parametric Seneta–Chen procedure.
1. Introduction
The classical group-sequential clinical trial methodologies for testing single hypothesis are well-developed and frequently used in late phase confirmatory trials. In a group-sequential trial, one or more interim analyses and one final analysis are preplanned, and hypothesis testing at each analysis is based on accumulating data collected up to the analysis. Compared with a fixed-sample trial, a group-sequential trial, when properly implemented, may provide savings in time and sample size because the trial can be stopped earlier for efficacy upon the rejection of the hypothesis at an interim analysis. Repeated significance testing at a fixed level on accumulating data during the course of a trial will greatly inflate the Type I error rate. To avoid this problem, a valid group-sequential testing method uses a set of appropriately determined critical boundaries such that the overall Type I error rate is controlled at the nominal level. There is a large body of literature on the topic. Jennison and Turnbull (Citation2000) provided a comprehensive exposition of the methods.
Recent years have seen the development of a class of group-sequential closed test procedures based on the weighted Bonferroni test (Maurer and Bretz Citation2013) for testing multiple endpoints (hypotheses) in clinical trials, where the objective is to reject at least one endpoint (hypothesis) while maintaining strong control of the family-wise error rate at a prespecified level α across all analysis time points and endpoints. Such a class of procedures has the following desirable properties: (1) it conveniently uses marginal test statistics, which are the individual test statistics corresponding to the individual endpoints; (2) it is sequentially rejective at each of the analysis time points; and (3) it provides a generalization in that the popular group-sequential fixed sequence procedure (e.g., Strategy 2 in Hung, Wang, and O’Neill Citation2007; Strategy 1 and Strategy 2 in Tamhane, Mehta, and Liu Citation2010) and the recently proposed group-sequential Holm procedure (the method GSHv in Ye et al. Citation2013) are special members of the class. Note that the terms “endpoint” and “hypothesis” are used interchangeably in this article.
Although a powerful α-propagation (also called “recycling” or “transferring”) rule is incorporated, the class of procedures (Maurer and Bretz Citation2013) does not consider between-endpoint correlations, which we refer to as correlations of the test statistics associated with the individual clinical endpoints. In a group-sequential trial with correlated multiple endpoints, power improvement can be achieved by suitably using the between-endpoint correlations. In situations where such correlations are nonnegligibly high, the proposed parametric procedure will provide substantial power improvement that can translate to a reduced sample size for a given power requirement. Many parametric procedures are available, and they partly depend on the specific test statistics which one can choose. For example, the parametric group-sequential procedure of Tang and Geller (Citation1999) uses the centered linear combination statistics. Our interest here is to propose parametric procedures that retain the sequential rejectiveness property of the original Holm procedure (1979) in the group-sequential settings. This desirable property is referred to as consonancy in the theoretical framework of the closed testing principle (Marcus, Peritz, and Gabriel Citation1976). The group-sequential parametric procedure of Tang and Geller (Citation1999) is exact, but not consonant.
The goal we set up in this article for the multiple testing procedures is to reject as many endpoints as possible while strongly preserving the family-wise error rate at a prespecified level. Thus, the testing is assumed to be continued until the rejection of all endpoints or the completion of the trial, whichever occurs earlier. We start by presenting a perspective on the classical group-sequential methodology for single hypothesis, and introducing some notations.
2. Univariate Critical Boundary for Single-Hypothesis
The error spending approach (Lan and DeMets Citation1983) is a convenient tool for group-sequential design and analysis. Several specific forms of error spending functions have been proposed, and a few are commonly used in clinical applications. To accommodate the problem of testing multiple hypotheses, Maurer and Bretz (Citation2013) attempted some slight generalizations of spending functions, and they redefined a family of error spending functions as follows: Parameterized by a prespecified Type I error rate α, 0 < α < 1,
is a cumulative Type I error spending function of the information fraction r, 0 ⩽ r ⩽ 1. They further suggested that mild monotonicity conditions should be imposed: (1) for a given α,
is nondecreasing in r, with
and
; and (2) for a given r,
is nondecreasing in α. A family of spending functions that are nonmonotonic may not be admissible for use. Commonly used error spending functions, such as the γ-family (Hwang, Shih, and DeCani Citation1990), the power family of error spending functions (Jennison and Turnbull Citation2000, p. 148), and the approximated O’Brien-Fleming and Pocock error spending functions (Lan and DeMets Citation1983) are strictly monotone in both r and α, α ∈ (0, α0), where 0 < α0 < 1. Note that practically α0 can be far less than 1, but usually needs to exceed 0.05 or 0.10, which are the commonly used significance levels in hypothesis testing.
Consider the problem of testing single hypothesis Hi based on a sequence of standardized test statistics (Zi, 1, …, Zi, T) in a T-stage group-sequential setting. Let δi be the parameter for treatment effect. A commonly used distribution model is that (Zi, 1, …, Zi, T) is a multivariate standard normal distribution with sequential means and sequential correlations
, where nt is the number of subject pairs (half of the sample size) at stage t for a comparative trial with equal allocation to two treatment arms. Let Pi, t be the p-value corresponding to the test statistics Zi, t based on the cumulative data collected up to the time of analysis t, t = 1, …, T. The group-sequential test rejects Hi if, for any t = 1, …, T, Pi, t ⩽ bi, t, where bi, t is the stage t univariate critical boundary expressed in terms of significance level. In the following, we review the derivation of the classical univariate boundary {bi, t, t = 1, …, T}.
Let be a continuous and strictly monotone error spending function that is prescribed to Hi. The allocation of spent levels {α1, …, αt, …, αT} across T analyses is immediately obtainable, with αt ≠ 0 for analysis t, t = 1, …, T, and ∑Tt = 1αt = α. Then, solve the following set of equations for the univariate (single hypothesis) critical boundary {bi, t, t = 1, …, T} under the null hypothesis.
(1)
(1)
The solution {bi, t, t = 1, …, T} to (1) can be treated in principle as an implicit vector function of α, α ∈ (0, α0), where 0 < α0 < 1. Thus, we replace bi, t(α) by a more suggestive notation . The vector function
denotes the
-induced univariate level-α group-sequential critical boundary for testing Hi. Further, it can be shown that
is monotonically increasing in α (Maurer and Bretz Citation2013).
Let Si, t(α) denote the event . Then, the critical region of the classical group-sequential test of Hi is ∪Tt = 1Si, t(α). Let Ri(α) = {Pi ⩽ α}, where Pi is distributed as U(0, 1). Then the equivalency of two events is
(2)
(2)
That is, the critical region of a group-sequential test can be seen as equivalent to that of a hypothetically constructed fixed-sample reference test. It follows that equivalent events have equal probabilities.
3. Parametric Test for Intersection Hypothesis
3.1. Fixed-Sample Parametric Test
Consider a fixed-sample parametric test for an intersection hypothesis before considering the group-sequential extension by analogy.
For the fixed-sample testing, the parametric procedure of Xie (Citation2012) implicitly uses a Holm-type weighted parametric test. The Xie procedure can also be viewed as a weighted version of the original Dunnett and Tamhane (Citation1991) step-down procedure using Holm’s weighting scheme. Xie’s (2012) parametric test is based on the use of adjusted p-values whereas ours, as demonstrated in the following, is based on adjusted significance levels. We choose to present our formulation of the parametric test, which is more conducive to its group-sequential extension.
Holm’s weighting scheme is illustrated in Holm’s (Citation1979) paper. Let I = {1, …, m} denote the index set of m null hypotheses. For I, assume a collection of initial weights wi(I), i ∈ I, with 0 < wi(I) ⩽ 1 and ∑i ∈ Iwi(I) = 1. The procedure starts by comparing each pi with wi(I)α at Step 1, and it rejects the hypotheses in the set R = {Hi, i ∈ I: pi < wi(I)α}. If R = ∅, then the test procedure stops without a rejection. Otherwise, the test proceeds to Step 2, and nonrejected hypotheses in the set I∖R are retested using updated larger weights wi(I∖R) = wi(I)/(1 − ∑r ∈ Rwr(I)), i ∈ I∖R. In Step 2, the procedure compares each pi with the larger critical value wi(I∖R)α to make a decision about rejection. Testing continues with updated weights for the non-rejected hypotheses until the first nonrejection.
To test an intersection hypothesis at a prespecified significance level α, a parametric test uses the joint null distribution of test statistics, which results in a larger critical region than that of the weighted Bonferroni test. Consider the testing of an intersection hypothesis , where J⊆I = {1, 2, …, m}. The parametric test rejects HJ if, for some i, i ∈ J, pi < ξJwi(J)α, where wi(J) > 0 is the weight for Hi and ξJ ⩾ 1 is the solution to the following equation (Bretz et al. Citation2011). Note that the probability is evaluated under the global (intersection) null hypothesis:
(3)
(3)
Lemma 3.1.
Holm’s weighting scheme when employed by α-exhaustive parametric tests for all subset intersection hypotheses ensures that the monotonicity condition (Bretz et al. Citation2011, p. 901) defined as for all J′⊆J⊆I and i ∈ J′ is satisfied.
The proof is given in the appendix.
Remark 3.1.
Lemma 1 can be stated for commonly used model settings, such as multivariate normal, absolute multivariate normal, multivariate t, and absolute multivariate t-test statistic; however, a particular distributional assumption is not required. Moreover, equal correlations that imply the exchangeability of the null p-values are not required either.
3.2. Group-Sequential Parametric Test
In this section, we construct a group-sequential parametric test for an intersection null hypothesis , where I = {1, 2, …, m}.
Assume a collection of weights {wi(I), i ∈ I} and a collection of error spending functions , with wi and
prescribed for Hi. Also assume for each Hi, i ∈ I, a sequence of standardized test statistics (Zi, 1, …, Zi, T), which is multivariate standard normal with the sequential means and the sequential correlation structure described in Section 2. Further assume for each t, Zi, t and
are jointly bivariate normal with a known correlation
between Hi and
. Note that correlation
between Hi and
is in fact the same for all t, t = 1, …, T, and it does not vary from t to t′ under the multivariate normal model. The correlation structure for the m endpoints, which is usually expressed by an m × m matrix, will be used in the boundary calculations for our proposed parametric procedures. We should mention that correlations exist for test statistics between different endpoints and different stages. Fortunately, as shown later, the proposed α-exhaustive (exact) parametric procedure does not require knowing such correlations for boundary calculations. We consider this feature an advantage with respect to simplicity.
A T-stage group-sequential parametric test is simply constructed as follows. This test rejects HI if there exist an i ∈ I and a t, t = 1, …, T such that , where ξI is the solution to Equation (3). Otherwise, the test does not reject HI.
Lemma 3.2.
The above described T-stage group-sequential parametric test for an intersection null hypothesis is a size-α test.
Proof 3.1.
The lemma can be verified by calculating the probability of rejecting HI under the global (intersection) null hypothesis.
Note that Lemma 3.2 also applies to situations in which different families (types) of error spending functions are prespecified for different hypotheses.
We next show that, under Holm’s weighting scheme, the monotonicity property exhibited in the fixed-sample parametric closed testing procedure is retained in its group-sequential extension.
Lemma 3.3.
The described T-stage group-sequential parametric tests for the family of all subset intersection hypotheses have the desirable property of monotonicity of critical values at each analysis time point t = 1, …, T.
Proof 3.2.
Without a loss of generality, let i ∈ J′⊂J⊆I. That is, let Hi be a component hypothesis in both and HJ.
4. Group-Sequential Parametric Procedure for Multiple Endpoints
In this section, we assume that the correlation matrix for the m endpoints is known or estimable. To utilize these between-endpoint correlations in perhaps the simplest way possible, we construct a group-sequential parametric procedure that has the same feature as the weighted Bonferroni procedures (Maurer and Bretz Citation2013) in that it is step-down, sequentially rejective at each analysis time point, requiring at most max (m, T) tests to finish the testing of m hypotheses. In the following, we outline the algorithm for performing the proposed T-stage group-sequential parametric procedure with m endpoints.
Algorithm
0. Set t = 1, I = {1, 2, …, m}, {wi(I), i ∈ I}, and .
1. Calculate ξI from Equation (3), and then calculate the critical boundaries (nominal significance levels) .
2. Construct an index set , where pi, t is the unadjusted p-value for Hi at analysis t.
3. If R ≠ ∅, then reject Hi, i ∈ R. Update I → I∖R and wi(I) → wi(I∖R). Go to Step 1.
4. If R = ∅, and t < T, then the trial is continued with t → t + 1. Go to Step 2; otherwise stop.
5. If |I| ⩾ 1, go to Step 1; otherwise stop.
Theorem 4.1.
The proposed group-sequential weighted parametric multiple testing procedure strongly controls the family-wise error rate.
Proof 4.1.
Immediate from applying the closure method to the group-sequential α-exhaustive parametric tests for all intersection hypotheses . Note that the intersection tests are α-exhaustive parametric tests (from Lemma 2), and the intersection tests have a monotone property (from Lemma 3).
Ye et al. (Citation2013) proposed two variants of their group-sequential Holm’s method, termed “group-sequential Holm variant (GSHv)” and “group-sequential Holm fixed (GSHf).” The distinction between the two variants is as follows. Suppose that the first rejection of an endpoint is made at t, t ⩽ T for a T-stage group-sequential trial. If the group-sequential critical boundaries (for those unrejected endpoints) are instantly updated for all stages 1, …, T, but effectively changed only for stages t, …, T, the procedure is termed GSHv; if the boundaries are updated only for the final stage T, the procedure is termed GSHf. The variant GSHv is obtainable simply by setting ξJ = 1 for all J⊆I in Equation (3) and, thus, represents a special case of our proposed group-sequential parametric procedure, because ξJ tends to 1 as all ρs tend to − 1/(m − 1). It can be shown that ξJ cannot be less than 1.
Recently, Xi and Tamhane (Citation2015) generalized the time at which boundary updates should be made upon the first rejection at t, and they proposed that the updating can be performed for stages s*, …, T, where 1 ⩽ s* ⩽ T. In their generalization, if s* = 1, then the procedure is the same as GSHv; if s* = T, then the procedure is the same as GSHf. Xi and Tamhane (Citation2015) further suggested methods for choosing s* to minimize the expected sample size for the given power requirement.
5. Simulation
We conducted simulation studies to investigate how our proposed parametric procedure compares with the Holm procedure in terms of the family-wise error rate and the average power, which is the expected proportion of rejected false null hypotheses, for one-sided tests using multivariate normal test statistics. Because the variant GSHv of the Holm procedure (Ye et al. Citation2013) is a special case of the proposed parametric procedure, we use it as a benchmark. For simplicity, we based the simulation on a two-stage (T = 2) group-sequential setting with the following assumptions: (1) equicorrelated multivariate normal test statistics with a mean μi for Hi and a common correlation coefficient ρ among endpoints; (2) equispaced information fractions (i.e., equal sample size for stages 1 and 2); and (3) same types of spending functions for all the endpoints. Note that both of the competing procedures are applicable if different types of error spending functions are prescribed for different endpoints, as long as the type that is prespecified for each endpoint remains unchanged during the course of the analysis.
All computations and simulations were conducted using R version 3.3.2. Without exception, all boundaries were conveniently calculated in terms of the nominal significance levels by invoking the R function gsDesign (Anderson Citation2016). This function returns boundary values to four decimal places.
We considered different values of m from 2 to 8, and did not attempt a larger value of m, because individual boundaries returned by the R function for smaller spending levels resulting from a larger m lack the accuracy required for group-sequential simulations.
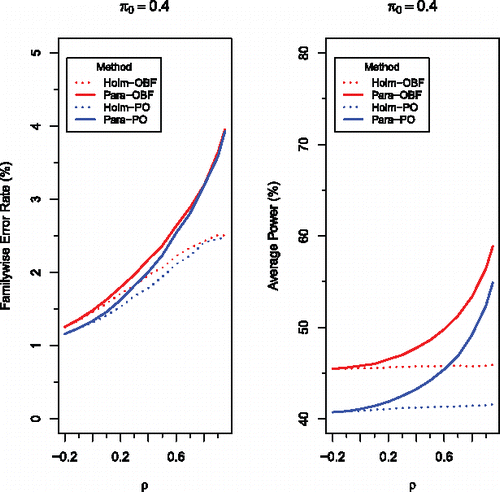
, which shows the relative performances of four methods for m = 5 equally weighted endpoints, is a representative of how our methods perform for m ⩾ 2. The four methods are as follows: the regular Holm procedure based on the O’Brien-Fleming error spending function (Holm-OBF), the parametric Holm procedure based on the O’Brien-Fleming function (Para-OBF), the regular Holm procedure based on the Pocock function (Holm-PO), and the parametric Holm procedure based on the Pocock function (Para-PO). shows that, for a given error spending function, the proposed parametric group-sequential method uniformly outperforms the regular Holm’s group-sequential method, especially when the between-endpoint correlation ρ is high. Similar results are seen in for a slightly different simulation configuration in which different hypotheses take different means.
Figure 1. Comparison of four methods, Holm-OBF (red dotted), Para-OBF (red solid), Holm-PO (blue dotted), and Para-PO (blue solid), for testing μi ⩽ 0 against μi > 0, simultaneously for i = 1, …, m = 5, at level α = 0.05 based on multivariate normal test statistics with the common correlation ρ. The mean is chosen to be 2 when a null hypothesis is false, and 0 when a null hypothesis is true, with π being the proportion of true null hypotheses. One million independent replications were used in all simulations.
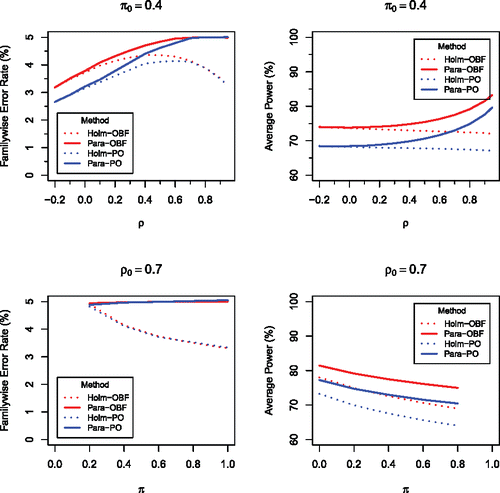
Figure 2. Comparison of four methods, Holm-OBF (red dotted), Para-OBF (red solid), Holm-PO (blue dotted), and Para-PO (blue solid), for testing μi ⩽ 0 against μi > 0, simultaneously for i = 1, …, m = 5, at level α = 0.05 based on multivariate normal test statistics with the common correlation ρ. The means are chosen to be 1.0, 1.5, and 2.0, respectively, for the 3 false null hypotheses, and − 1.0 and 0 for the 2 true null hypotheses, with π being the proportion of true null hypotheses. One million independent replications were used in all simulations.
6. Application and Example
In the real-world clinical trial practice, estimating the correlations among endpoints is generally difficult . However, situations occur in which such correlations are structural. Multiple composite endpoints are widely used in large-scale cardiovascular Phase III confirmatory trials, which typically enroll tens of thousands of subjects. For example, the MERIT-HF trial (Fagerberg Citation1999) is a group-sequential trial with two primary endpoints, which are (1) all-cause mortality and (2) the composite of all-cause mortality plus all-cause hospitalization. The trial also has four secondary composite endpoints, which include common components. We speculate that with the addition of certain reasonable assumptions, correlations of the log-rank test statistics for composite endpoints with common components can be appropriately estimated. Further research will be needed with respect to such estimations.
The proposed group-sequential parametric step-down procedure is also applicable to the problem of testing multiple hypotheses of the same endpoint, but associated with different populations of interest. These different populations overlap to some degree.
6.1. Example with Calculations Using R
We revisited the group-sequential MONET1 study, which enrolled a total of n = 1060 subjects (Section 4, Ye et al. Citation2013). This study is a classical two-stage (one interim and one final) group-sequential trial that uses equispaced information fractions. The study has two primary hypotheses H1 and H2, both of which concern the treatment effect on overall survival (represented by hazard ratio λ). H1 concerns this treatment effect in the adenocarcinoma subpopulation (70% of the total population), and H2 concerns this treatment effect in the total population. The allocated α is 0.010 for testing H1 and 0.015 for testing H2, both one-sided. For illustration purposes, Ye et al. (Citation2013) used the O’Brien-Fleming error spending function for both H1 and H2. The log rank test statistics are used. Under the null hypothesis log(λ) = 0, the variance of log rank statistics is approximated as 4/qt (Jennison and Turnbull Citation2000, pp. 77–79), where qt is the number of cumulative deaths at analysis t. This approximation holds under equal randomization, which is the case of the MONET1 study with the randomization ratio 1:1 (Chemotherapy:Placebo). The correlation of the two test statistics is high, which is a result of the large portion of the population that overlaps. Under the additional assumption that death rates are comparable among the total population and the adenocarcinoma subpopulation, the correlation coefficient of the Wald test statistics associated with H1 and H2 is estimated to be .
The critical values (in terms of z-score) of the group-sequential Holm procedure are tabulated (see the GSHv row of Table 1, Ye et al. Citation2013) as follows: c1 = 3.25, c′1 = 2.96, c2 = 2.18, and c′2 = 1.97 in the overall population (H2), and d1 = 3.46, d′1 = 2.96, d2 = 2.33, and d′2 = 1.97 in the adenocarcinoma subpopulation (H1), where ct and c′t, t = 1, 2, are two-stage group-sequential boundaries for H2 at the significance levels 0.015 and 0.025 respectively; and dt and d′t, t = 1, 2, for H1 at the significance levels 0.010 and 0.025, respectively. These notations are the same as those used by Ye et al. (Citation2013). We successfully replicated the above critical values, which are based on the approximated O’Brien-Fleming error spending function of Lan and DeMets (Citation1983).
The proposed parametric procedure calculates the boundaries as follows. By using the estimated correlation 0.837, we obtain ξ = 1.28, which is then used to calculate the following exact boundaries: c1 = 2.95, c′1 = 2.65, c2 = 2.08, and c′2 = 1.87 in the overall population; and d1 = 3.17, d′1 = 2.65, d2 = 2.24, and d′2 = 1.87 in the adenocarcinoma subpopulation. The proposed parametric procedure has a uniformly larger critical region, which is apparent from the above numbers. Moreover, the parametric procedure’s critical region is considerably larger since ξ = 1.28 > 1. Note that 1 is the value that ξ takes for the GSHv variant of the group-sequential Holm procedure. We provide the R code in the appendix.
6.2. Adaptive Strategy for Unknown Correlations
The proposed group-sequential parametric method is preferable when the correlation structure for the multiple endpoints is known a priori because solving for the constant ξJ to Equation (3) is made easy by modern computing. For a given α, the higher the between-endpoint correlations ρ's, the higher the calculated value of ξJ, and the larger the group-sequential critical regions for the unrejected endpoints. In practice, a complete set of correlations among endpoints is often impractical to determine, or simply the confidence in the presumably known correlations may be weak. In such situations, correlations can be estimated for each stage t based on the data collected up to stage t. The estimated correlations are then used to calculate the values of ξJ, and then boundaries, by which decisions are made about what to reject. This adaptive parametric procedure maintains strong control of the family-wise error rate asymptotically because sample estimates of the correlations tend to approach the true correlations asymptotically. For the same reason, this adaptive parametric method does not work well for smaller samples. The classical group-sequential test is based on the cumulative data, and correlation estimates become more reliable for the later stages of the trial. Further work is needed to evaluate the performance of the adaptive parametric procedure in the group-sequential applications.
Tang and Geller (Citation1999) provided an example of a cross-over trial with four respiratory endpoints of interest (FEV1, FVC, PEFR, and PI). The first part of the cross-over trial is treated as if it is the first stage of a two-stage group-sequential trial. The following is the estimated correlation matrix (Tang and Geller Citation1999, p. 1189) for stage 1:
Now suppose that the proposed consonant parametric procedure is used to perform simultaneous one-sided testing of the mean differences for the four equally weighted endpoints at the overall level α = 0.05. By solving Equation (3), we obtain ξI = 1.11 for I = {1, 2, 3, 4}. The initial boundaries are 0.0009 (O’Brien-Fleming) and 0.0079 (Pocock) using the ξI value, and 0.0007 (O’Brien-Fleming) and 0.0072 (Pocock) if the variant GSHv of the group-sequential Holm procedure (Ye et al. Citation2013) is used. Note that each of the four individual p-values for the first stage is to be compared with the initial boundaries to make the initial decision about rejection. This example shows that although the correlations among endpoints may be small on average, or even negative as seen in the above matrix, the impact on the critical boundaries by taking them into account can be nonnegligible.
7. Discussion
The class of group-sequential weighted Bonferroni procedures (2013) is a consonant step-down case of the generic group-sequential closed testing procedures (Tang and Geller Citation1999). The consonancy generates a shortcut to the fully closed procedure, and does not require greater than max (m, T) tests to finish the testing, thus, representing a considerable simplification of the generic group-sequential closed testing procedure (Tang and Geller Citation1999) that may require as many as T2m tests.
A Bonferroni-based closed testing procedure requires little restrictions on the allocation and reallocation of weights for the procedure to be consonant. Thus, there is an unconstrained freedom in selecting a particular weighting scheme to suit a specific study objective. However, to create consonancy in the parametric-based closed testing procedure, one has to resort to certain specific weighting schemes, such as Holm’s weighting scheme. Holm’s weighting scheme preserves the initial ratios of nonzero weights, which may represent the relative importance of the individual hypotheses. In clinical trials with multiple primary endpoints, Holm’s weighting scheme has a prominent place in suiting certain specific study objectives. A commonly used strategy is to base the initial weights assigned to individual endpoints on their relative importance. A different strategy is to choose the initial weights to maximize the disjunctive power, given the expected effect sizes for all endpoints.
Because of its particular underlying weighting scheme, the fallback-type parametric procedure (Huque and Alosh Citation2008) for hierarchically ordered endpoints cannot be easily extended for applications in group-sequential settings. For m ⩾ 3, the monotonicity condition (Bretz et al. Citation2011) does not hold for positive correlations, although it holds for the cases of independent or negative correlations.
In situations where the correlations between endpoints are known for some but not for all, Bretz et al. (Citation2011) provided a solution, which requires using a submatrix of those fully known correlations for solving Equation (3). It can be shown that their solution preserves consonancy in a consonant parametric procedure. However, the disadvantage is apparent, because not all known pairwise correlations between Hi and
, i, i′ ∈ I are used. For an example, consider the testing of three correlated endpoints H1, H2, and H3, with ρ12 and ρ23 known while ρ13 unknown. The solution of Bretz et al. (Citation2011) uses either ρ12 or ρ23, presumably the larger one, but not both. An alternative solution is to use the partially parametric procedure of Seneta and Chen (Citation2005), which uses all known pairwise correlations in boundary calculations, thus, can be more powerful. Seneta and Chen procedure (Citation2005) is a (consonant) step-down procedure. The procedure is not exact, but has the desirable property of allowing explicit formulas for the adjusted critical boundaries. Note that the fixed-sample Seneta and Chen (Citation2005) procedure is originally unweighted (or equally weighted), but its weighted version is readily available by applying Holm’s weighting scheme. A natural group-sequential extension of the weighted Seneta and Chen method can be achieved by employing monotone error spending functions, because the monotonicity condition referred to in Lemma 1 is preserved for each of the analysis time points. Sarkar, Fu, and Guo (Citation2016) improved the method of Seneta and Chen (Citation2005) using a convexity property of pairwise null p-values without increasing the computational complexity. These Holm-type step-down partially parametric methods can be extended to the group-sequential setting, and their group-sequential extensions strongly control the family-wise error rate and are generally more powerful than alternatives that do not use the correlations among endpoints.
If the correlations between endpoints are independent or positive, which is commonly observed in clinical trials, there exists an applicable group-sequential step-up procedure that is strictly more powerful than the group-sequential Holm procedure, and also maintains strong control of the family-wise error rate, and does not exceed the complexity of the Holm procedure. The group-sequential step-up procedure for testing correlated endpoints will be elaborated in a future communication.
Supplementary Material
Supplementary material available includes simulation R codes and outputs.
Supplementary Materials
Download Zip (223.4 KB)Acknowledgments
The author thanks Dr. Frank Bretz and Professor Ajit Tamhane for their valuable comments. The author acknowledges the constructive comments of editor Dr. José Pinheiro, the associate editor, and four referees, who tremendously helped to enhance the ideas and improve the accuracy and the clarity of this manuscript.
Related Research Data
References
- Anderson, K. (2016), “gsDesign: Group Sequential Design,” R Package Version 3.0-1, available at http://CRAN.R-project.org/package=gsDesign.
- Bretz, F., Posch, M., Glimm, E., Klinglmueller, F., Maurer, W., and Rohmeyer, K. (2011), “Graphical Approaches for Multiple Comparison Procedures Using Weighted Bonferroni, Simes or Parametric Tests,” Biommetrical Journal, 53, 894–913.
- Dunnett, C. and Tamhane, A. (1991), “Step-Down Multiple Tests for Comparing Treatments with a Control in Unbalanced One-Way Layouts,” Statistics in Medicine, 10, 939–947.
- Fagerberg, B. (1999), “Effect of Metoprolol CR/XL in Chronic Heart Failure: Metoprolol CR/XL Randomized Intervention Trial in Congestive Heart Failure (MERIT-HF),” Lancet, 353, 2001–2007.
- Holm, S. (1979), “A Simple Sequentially Rejective Multiple Test Procedure,” Scandinavian Journal of Statistics, 6, 65–70.
- Huque, M. F. and Alosh, M. (2008), “A Flexible Fixed-Sequence Testing Method for Hierarchically Ordered Correlated Multiple Endpoints in Clinical Trials,” Journal of Statistical Planning and Inference, 138, 321–335.
- Hung, J., Wang, S., and O’neill, R. (2007), “Statistical Considerations for Testing Multiple Endpoints in Group Sequential or Adaptive Clinical Trials,” Journal of Biopharmaceutical Statistics, 17, 1201–1210.
- Hwang, I. K, Shih, W., and DeCani, J. S. (1990), “Group Sequential Design using a Family of Type I Error Probability Spending Functions,” Statistics in Medicine, 9, 1439–1445.
- Jennison, C., and Turnbull, B. W. (2000), Group Sequential Methods with Applications to Clinical Trials, Boca Raton: Chapman & Hall/CRC.
- Lan, K. K. G., and Demets, D. L. (1983), “Discrete Sequential Boundaries for Clinical Trials,” Biometrika, 70, 659--663.
- Marcus, R., Peritz, E., and Gabriel, K. R. (1976), “On Closed Testing Procedures with Special Reference to Ordered Analysis of Variance,” Biometrika, 63, 655–660.
- O’Brien, P. C., and Fleming, T. R. (1979), “A Multiple Testing Procedure for Clinical Trials,” Biometrics, 35, 549–556.
- Maurer, W., and Bretz, F. (2013), “Multiple Testing in Group Sequential Trials using Graphical Approaches,” Statistics in Biopharmaceutical Research, 5, 311–320.
- Sarkar, S., Fu, Y., and Guo, W. (2016), “On Improving Holm’s Procedure Using Pairwise Dependencies,” Biometrika, 103, 237–243.
- Seneta, E., and Chen, J. (2005), “Simple Stepwise Tests of Hypotheses and Multiple comparisons,” International Statistics Review, 73, 21–34.
- Tamhane, A., Mehta, C., and Liu, L. (2010), “Testing a Primary and a Secondary Endpoint in a Group Sequential Design,” Biometrics, 66, 1174–1184.
- Tang, D-I., and Geller, N. L. (1999), “Closed Testing Procedures for Group Sequential Clinical Trials with Multiple Endpoints,” Biometrics, 55, 1188–1192.
- Xie, C. (2012), “Weighted Multiple Testing Correction for Correlated Tests,” Statistics in Medicine, 31, 341–352.
- Xi, D., and Tamhane, A. (2015), “Allocating Recycled Significance Levels in Group Sequential Procedures for Multiple Endpoints,” Biometrical Journal, 57, 90–107.
- Ye, Y., Li, A., Liu, L., and Yao, B. (2013), “A Group Sequential Holm Procedure with Multiple Primary Endpoints,” Statistics in Medicine, 32, 1112–1124.
Appendix
Proof of Lemma 1 in Section 3.1
Proof.
Without loss of generality, assume that J′ is a proper subset of J; that is, J′ = J∖R, where R ≠ ∅. Let be the solution to
(A.1)
(A.1) where wi(J∖R) = wi(J)/(1 − ∑r ∈ Rwr(J)), for i ∈ J∖R.
From (3) and (4), we have
(A.2)
(A.2) and by plugging
into (5), we have
(A.3)
(A.3)
(A.4)
(A.4) Replacing the right side of the inequality (6) by the η expression from (7), we get
(A.5)
(A.5) If η < 1, we have {Pi ⩾ ξJwi(J)α}⊂{Pi ⩾ η · ξJwi(J)α}, for i ∈ J∖R, leading to
, which is a contradiction to the inequality (8). It then follows that η ⩾ 1 for all i ∈ J′.
R code for Section 6
Note that sfu = ``OF′′ in the above coding stands for the original O’Brien-Fl eming error spending method (O'Brien and Fleming Citation1979).