
ABSTRACT
Future adaptive applications require lightweight and stiff materials with high active strain but low energy consumption. A suitable combination of these properties is offered by carbon nanotube-based actuators. Papers made of carbon nanotubes (CNTs) are charged within an electrolyte, which results in an electrical field forming a double-layer of ions at their surfaces and a deflection of the papers can be detected. Until now, there is no generally accepted theory for the actuation mechanism. This study focuses on the actuation mechanism of CNT papers, which represent architectures of randomly oriented CNTs. The samples are tested electrochemically in an in-plane set-up to detect the free strain. The elastic modulus of the CNT papers is analyzed in a tensile test facility. The influence of various ion sizes of water-based electrolytes is investigated.
During the tests, four parameters that have a significant influence on the mechanical performance of CNT papers were identified: the test conditions, the electrical charging, the microstructure and the ion size. All of these influencing factors point to the mechanically weak inter-tube linking at which the actuation seems to take place. Quadratic voltage-strain correlation suggests a combination of electrostatic and volumetric effects as the possible reason for CNT paper actuation.
Abbreviations: CNT: carbon nanotubes; CV: cyclic voltammetry; CVD: chemical vapor deposition; HiPCO: high pressure carbon monoxide; IL: ionic liquid; MWCNT: multi-walled carbon nanotube; MW: multi-walled; NHE: normal hydrogen electrode; PDMS: polydimethylsiloxane; PMMA: polymethylmethacrylate; PPy: polypyrrole; PVDF: polyvinylidenefluoride; SCE: saturated calomel electrode; SWCNT: single-walled carbon nanotube; SW: single-walled; 1M: one molar concentration
1. Introduction
After Iijima’s publication [Citation1], extensive research revealed excellent properties such as Young’s modulus above 1–1.2 TPa [Citation2] (with regard to bundles of single-walled CNTs, SWCNTs), strength of 45 GPa [Citation3] (with regard to CNT bundles), a reversible structural elongation of 12 [Citation4] (with regard to multi-walled CNTs, MWCNTs) as well as high electrical (3 * 104 S/cm [Citation5]) and thermal conductivities (6000 W/Km [Citation6]). Although the listed properties were measured experimentally, their transfer into commercially available applications turns out to be extremely challenging. Besides the costs of mass production and the poor quality of the supplied [Citation7] nanotubes [Citation7], a mesoscopic semi-finished material is still not available. This material may be able to close or at least reduce the performance gap between results based on nano-scale experiments/simulations and macroscopic structures featuring incorporated macroscopic-sized CNTs. In 1999, Baughman [Citation8] illustrated their active behavior using mats made of randomly oriented single-walled carbon nanotubes (SWCNTs). In his presented set-up, free strain of about 0.2% was detected. Later published theoretical calculations reveal possible active strains up to 1% [Citation9]. Baughman’s publication set the standard for the future experimental investigations of CNT mats: two electrodes in capacitor mode, one working electrode and its counter electrode, both made of CNT papers. These sheets are immersed in an electrically insulating but ionic conductive electrolyte. Furthermore, the three-electrode cell is completed by a Calomel reference electrode. The analyzed paper is activated via rectangular charge pulses (maximum free strain) or triangular voltage (cyclovoltammetry) and shows an almost quadratic correlation between strain and voltage steps, independent of the polarity. Considering their mechanical, adaptive properties, low density (1.33 g/cm3 for SWCNT [Citation10]) and energy consumption (
1 V), carbon-based actuators seem to be a promising material for future adaptive structures. However, the published results on free strain and the actuation force of CNT-based actuators should be viewed with caution since the results may either depend on the nano- and microstructure or on the analysis method used, which may detect secondary effects instead of the charge- or ion-induced reactions of the carbon structure itself. In this context, the term architectures will be used to represent macro-scale structures which are formed by nano- or micro-sized CNTs. Usually the length of the individual single tubes is too small to form the dimensions of macroscopic samples. Furthermore, due to their high specific surface, single-walled nanotubes tend to bundle with other CNTs to reduce their surface energy. Thus, a CNT bundle represents the first step towards an architecture. The carbon tubes within an architecture are entangled with each other and linked by van der Waals forces. This is why the results of tested CNT-based architectures can only partially represent the active behaviour of single tubes. The interlinking between the tubes is the weakest part of the architecture. Using out-of-plane set-ups to analyse CNT papers in bending mode [Citation8,Citation11] also yield rather qualitative results because secondary effects like thermal- or diffusion-induced volume change can significantly influence the findings. Another out-of-plane set-up is the measurement of a fixed paper in its thickness direction [Citation12]. However, this approach requires a high optical resolution due to smaller deflections which may be easily affected by errors. To reduce these effects, the papers are pre-stressed and the measurements are carried out in the in-plane direction of the paper [Citation8]. This test set-up requires a symmetrical composition of the tested samples. In addition to the already mentioned publications, a few others [Citation13–Citation16] have used similar in-plane test set-ups for characterising nanotube papers. An overview of the found results is given in .
Figure 1. Overview of published CNT paper measurements conducted in an in-plane set-up [Citation8,Citation13–Citation16,Citation18].
![Figure 1. Overview of published CNT paper measurements conducted in an in-plane set-up [Citation8,Citation13–Citation16,Citation18].](/cms/asset/57b4f5bd-a2c9-4e96-9c36-08d5097ab1d4/tsnm_a_1457573_f0001_c.jpg)
Additional information on the set-ups such as the type of reference electrode (saturated calomel electrode, SCE, or normal hydrogen electrode, NHE), the electrolyte used, and the type and supplier of the carbon nanotubes is given in for a better comparison of the results.
Table 1. Overview of experimental details of the tests presented in . All used electrolytes are tested as one molar (1 M) concentration. The suspension of tests marked with an asterisk () are homogenized (reduced amount of agglomerates) by centrifugation.
As it can be seen clearly in , similar, almost quadratic correlations between voltage and strain can be found in all publications. Some of them discussed the possible actuation mechanism. Baughman [Citation8] explained the found strain with the intra-planar linear correlation between voltage and deflection of graphite actuation (elongation at negative potentials, contraction at positive potentials [Citation17]). He suspected a quantumchemical effect as result of charge transfer between the carbon structure and ions of the electrolyte. In contrast, Suppiger [Citation15] believed that the strain of the CNT papers is caused by an electrostatic effect. She came to this conclusion because of an inverse correlation between elastic modulus and free strain. The less CNTs are linked to each other, the more the charged tubes can be repulsed from each other, creating the detected actuation. Spinks [Citation18] suggested gas evaporation during charging within the paper. The evaporation causes a swelling of the paper structure, which appears to be a stack of selectively linked layers. The folding of the layers is detected as actuation. Riemenschneider [Citation16] analyzed the influence of different ions of aqueous electrolytes but was not able to identify a clear trend due to overlapping results. Further investigations with a focus on structural issues carried out by Whitten [Citation19] revealed similar results compared to those of Suppiger. He verified a strong influence of the test conditions on the mechanical properties of CNT papers. For example, the stiffness of a paper drops significantly under wet conditions compared to the results obtained with dry paper. Furthermore, he was able to verify an influence of the ion size because the rather small ions of the aqueous electrolytes caused lower loss of mechanical stability compared to the larger ions of the ionic liquid (IL).
An even more nanoscopic scaled approach to identify the reason of paper actuation was carried out by Gupta [Citation20], using Raman spectroscopy. Raman spectroscopy is a sensitive method for detecting changes in the atomic structure of a single carbon tube. His approach did not yield any further details because the signals of too many different carbon walls overlapped each other, disguising any significant detail. However, Raman investigations using single carbon nanotubes [Citation21–Citation24] and tests using atomic microscopy [Citation25] revealed a charge- or ion-induced dimensional change of the carbon structure itself. Interestingly, the investigations also revealed a quadratic correlation between the change of atomic structure and the applied voltage. Due to a number of different effects, such as reduction of the peak intensity at higher electrical potentials, the effect cannot be attributed with absolute certainty to a carbon bond change. However, from a scientific point of view, there are many indications that CNTs intrinsically have the capability to work as actuators.
Typically, active materials can be used twice, as an actuator, but also as a sensor. This is only partly the case for CNTs. For graphene [Citation26] and single walled carbon nanotubes [Citation27] it has been verified that the carbon structure can be disordered by mechanical stress. Raman spectroscopy allows for a correlation between the deformation of the atomic structure and specific load levels. However, a direct stress-induced, active, electrical signal, as is the case for piezoelectric ceramics, has not yet been found when neat carbon nanotubes are used. As soon as carbon nanotubes networks (e.g. CNT papers) are combined with polymers such as polymethylmethacrylate (PMMA [Citation28]), polyvinylidenefluoride (PVDF [Citation29]), polydimethylsiloxane (PDMS [Citation30]) or many others, piezoresistive effects allow linear correlation of resistivity and stress level. This effect sounds similar to the diffusion-induced actuation, but is not related to intercalated materials. Rather the effect is a result of opened and closed electrical connections within the network of the CNT paper due to the mechanical stress. More similar effects in terms of a actuation can be found when analyzing multi-layered bending actuators, typically called bi- or trimorphs. These kinds of actuators exhibit top-layers of CNTs as electrodes and a centered polymeric, ion-conductive layer [Citation31]. In this case, the diffusion of ions torwards the charged electrodes results in volumetric changes of the polymeric chains, which is detected as actuation. In this set-up, the CNT films are working as electrodes with no specific active task. More basic investigations are performed using aligned CNT/polymeric composites such as highly aligned polypyrrole-coated CNT papers (PPy/CNT papers) [Citation32] and PPy-coated highly vertical aligned MWCNT arrays [Citation33]. Due to the fact that two active materials are combined, a clear distinction between the actuation-induced effects cannot be made. Furthermore, [Citation32] used CNTs only for mechanical reinforcement and Schoor’s results [Citation33] pointed out the dominant actuation role of PPy. Even light-driven CNT/polymeric actuators [Citation34] have been demonstrated, but a clear explanation of the effect could not be given due to the multi-material set-up. However, both, CNTs and CNTs/polymer hybrids generate interesting effects which can be used for a lot of applications such as gas sensors [Citation35], mechanical reinforcement [Citation36], energy harvesting [Citation37], energy storage [Citation38], light emission [Citation39] up to future quantum computers [Citation40]. Should the carbon actuation effect be investigated, neat CNTs within an liquid electrolyte must be tested; the electrolyte must not transfer forces or be active in any way. For further information about CNT-based actuators two review-publications are available [Citation11,Citation14], which also address related applications such as sensors.
This study deals with the influence of the ion size and paper structure on the actuation of CNT-based architectures such as CNT papers. Using two set-ups, the active and mechanical properties of CNT papers are analyzed. Consequently, all measurements are conducted using two different approaches for testing the samples:
The first approach only deals with one single CNT-sample which is used for all of the tests with different electrolytes. This approach carries the risk that electrolytes may be contaminated after the first test series due to residual ions of earlier tested electrolytes in the pores of the sample. Furthermore, a mechanical degradation of the sample may occur with every test.
In the second approach, separate samples are used for each electrolyte. Although they are all cut from the same master CNT paper, they may differ from each other with respect to their electrical and mechanical properties.
By following these two approaches and comparing their results, the identification of structural effects and the influence of ion sizes are addressed.
2. Experimental approach, test procedure and evaluation
The following subsections deal with all aspects of testing, from sample preparation, a presentation of used electrolytes, the test set-ups and the test procedure to the mathematical formulae used.
2.1. Sample preparation
The tested papers are paper-like architectures of randomly oriented single-walled CNTs, also called buckypaper [Citation8]. These papers are manufactured by a high pressure filtration process described elsewhere [Citation8,Citation16]. The process is complemented by a centrifugation of 5 minutes at an acceleration of 4000 g, comparable to the approach used by Suppiger [Citation15]. The CNTs are supplied by Thomas Swan (Elicarb P0925, Thomas Swan & Co. Ltd., UK). The sample geometries vary due to the test set-up. The samples used for the in-plane measurements are 14 mm long, while the samples used for the actuated tensile test are approximately 10 mm long. Both samples have a width of 2 mm and a mean thickness of 150 m. All samples are cut from the same circular master CNT film (diameter of 30 mm), which is manufactured in the above-mentioned filtration process. Raman spectroscopy and TEM analyzes of the neat SWCNT powder reveal a ratio of 50
single-walled CNTs to 40
double-walled CNTs (around 5
amorphous carbon), a purity of approximately 95
(3.6
ash, 1.51
iron content and 0.014
magnesium), a diameter of 1–3 nm and a length of several hundred nanometers. Due to acid washing being used as a purification step, OH groups may be present on the surface, which have not been removed by a thermal treatment under inert gas atmosphere.
2.2. Ion radii of tested electrolytes and test procedure
The CNT papers are immersed in an aqueous, one molar solution of various salts for at least 30 minutes to guarantee saturation. Six different one molar, aqueous electrolytes are used: sodium chloride (NaCl, Merck KGaA, Germany), potassium chloride (KCl, Synopharm GmbH & Co. KG, Germany), magnesium chloride hexahydrate (MgCl2 &HO, Synopharm GmbH & Co. KG, Germany), sodium nitrate (NaNO3, Fluka Analytical GmbH – now Honeywell International Inc., US) and sodium sulphate (Na2SO4, Sigma-Aldrich Inc. – now Merck KGaA, Germany). The experiments focus on the differences in electromechanical actuation when using different ions. On the positive potential side, the negative ion Cl- is kept constant while the three positive ions Na+, K+ and Mg2+ are compared. On the negative potential side, the Na+ ion was kept constant while its counter ions are varied (Cl-, NO and SO
). The effective and hydrated ion radii according to [Citation42] are given in .
Table 2. Effective and hydrated ion radii according to [Citation42].
The effect of ion radii is controversially discussed in literature. While some authors could not find an evidence for radius-related effects [Citation43,Citation44] without giving an experimental evidence. In contrast, Mirfakrai suggests the ion intercation as the dominating effect of CNT yarn actuation [Citation45]. In particular, the effect of different ion sizes (positive vs. negative charged ions and ions of aqueous electrolytes vs. ions of ILs) is pointed out. Riemenschneider [Citation16] conducted extensive tests with six natrium-based aqueous electrolytes. However, due to overlapping results he could not find a clear trend, which might be attributed to too many graphs, low statistical reliability or contamination of the CNT paper by earlier tested electrolytes. He also found that the electrolyte concentration correlates with the generated strain which, is in good agreement with other results [Citation18]. This effect illustrates that the amount of ions in and around the CNT paper has a direct influence on its active behavior. This assumption is further confirmed by the work of Whitten [Citation19], who found stiffness-reducing effects in the presence of humidity and ions on the properties of a CNT paper.
The measurements with the different electrolytes are each carried out twice. The first test series is carried out using different samples for each electrolyte. These measurement results may be influenced and affected by the individual sample structures. As was shown in [Citation46], the thickness and the electrical properties can vary within the same paper by about 10%. It can be assumed that the varying geometry and conductivity is a result of the paper microstructure which also affects the mechanical properties. However, to avoid large differences in the mechanical properties the tested samples are all cut from the same paper and the same area. The second test series is carried out using the same sample, similar to the approach used by Riemenschneider [Citation16]. This procedure entails the risk of electrolytes getting contaminated by electrolyte residues left behind by earlier tested electrolytes. Although the paper is washed thoroughly in deionized water for at least 10 minutes, it cannot be guaranteed that all ions have been removed. The aim is to compare the results of both approaches in order to identify an ion size- and structure-related effect in the tests when different papers are used for different electrolytes.
2.3. Test facilities
2.3.1. Free strain measurements using an in-plane set-up
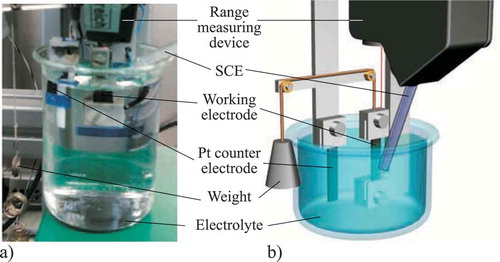
The in-plane free strain test set-up, as shown in , has a design similar to that used in earlier published tests [Citation8,Citation16], with the exception of a platinum plate being used as a counter electrode for better reproducibility. The test facility is used to measure the strain of a pre-stressed CNT paper under isotonic conditions (working against a constant force). Due to the fact that only 3.1 grams are used to stabilize the CNT paper in its vertical, in-plane, position, it can be assumed that the almost forceless free strain is detected. Furthermore, the set-up is designed such that it facilitates better mounting and removal of the CNT paper in order to reduce damage to the samples and allow for easier and thus a higher number of measurements. A calomel electrode (KE 10, Sensortechnik Meinsberg GmbH, Germany) is used as the reference electrode. The three-electrode cell is controlled by a potentiostat (1030 PC.T., IPS Elektroniklabor GmbH Co. KG, Germany) and is charged via a function generator (FG 300, Yokogawa Deutschland GmbH, Germany). The results are recorded via a data acquisition system (SCM05, LMS International, Belgium). The three-electrode cell and the data acquisition system are used for both set-ups.
Figure 2. In-plane test set-up: a) Realized set-up b) Simulated set-up.
2.3.2. Actuated tensile testing
This test method focuses on detecting structural changes based on a change of the test condition and charging of the sample. The key element of the actuated tensile test is a standard tensile test facility (Z005, Zwick GmbH Co. KG, Germany) which is supplemented by two clamping jaws made of polytetrafluorethylene (PTFE) and a container to immerse the samples into the electrolyte during the experiment (see left part of ). Within the framework of this tensile test, the previously mentioned in-plane set-up is also integrated so that the test can be conducted as it was explained before (compare detailed view of on the right side). PTFE is used as electrochemical inert material during charging the samples that prevents contamination of the electrolyte due to a chemical reaction with e. g. rust of ignoble parts. However, it is clear that PTFE is a comparatively soft material with which the CNTs cannot be tested to their maximum load. The aim of this experiment is a qualitative comparison of the sample’s mechanical stability under different conditions. However, the neat PTFE material features an elastic modulus of 700 MPa which is twice the value expected for CNT papers [Citation46]. Furthermore, the whole clamping set-up is designed solidly compared to the dimensions of the CNT paper specimen to guarantee a failure of the sample. The tests are conducted at a speed of 0.03 mm/min to prevent structural damages from occurring. To ensure a sufficient resolution, a 10 N load cell (KAP-Z, Zwick GmbH Co. KG, Germany) is used. The results are recorded by the software TestExpert II V3.31, also provided by Zwick. Both clamping jaws are equipped with electrodes for detecting the electrical resistivity of the sample, indicating damage to the specimen during mounting or inaccurate clamping.
Figure 3. Set-up of the actuated tensile test: a) Overview of the whole realized PTFE-based set-up b) Detailed view of the three-electrode cell.
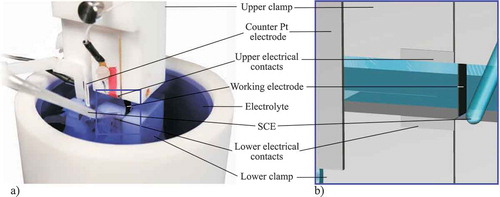
The actuated tensile test in is a modified version of the in-plane free strain set-up in . The main differences are the PTFE clamping, the testing methods and the testing modes. This set-up allows testing the samples in dry condition, wet condition (immersed in the electrolyte) and charged condition. Here, the voltage steps (0.3 V,
0.5 V and
0.7 V) are varied within the electrochemical window of
1 V for water-based electrolytes. The elastic behavior (elastic modulus) of the papers under different conditions is measured and compared in order to determine the influence of different conditions and the electrolyte.
2.4. Mathematical formulas
The following formulas are used to calculate the mechanical properties detected using the actuated tensile test (see ). The elastic modulus E of a material is calculated using the stress , which in turn is caculated by the measured force Fn and the specimen’s cross section geometry of width wsp and thickness tsp (compare Equation (1) [Citation47]). As a second parameter, the relative strain
is calculated using the detected displacement
lsp, see Equation (2) [Citation47]
The displacement
lsp is calculated by subtracting l0 from the current, in situ measured lsp. Due to the chemical process of ion diffusion, lsp asymptotically reaches a constant value after a certain time, typically within 10 mHz. The calculation of the relative strain is used for the Young’s modulus in tensile tests as well as to determine the free strain at in-plane measurements. Finally, E is calculated between all measured points using Equation (3). The experiments are only conducted in the linear elastic region of the CNT sheets. The elastic regime is proven by repeating the same test six times without experiencing a drop of the modulus. The presented Young’s moduli are calculated according to the test standard for fiber reinforced plastics DIN EN ISO 527-5 [Citation48] as the gradient of the stress/strain curve calculated using Equation (3). To calculate the strain, the test standard uses the force and strain results at
= 5
and 25
. As mentioned before, the tests are only performed in the linear elastic regime, and
= 5
and 25
in the test standard are related to the fracture elongation. However, in the presented tests the limits for
are set to 10
and 50
because the tests are carried out only to the half to the fracture elongation. This approach avoids plastic deformation which is not the aim of the investigation and was already tested and published earlier [Citation46].
For a better understanding of the electrochemical reactions of the different electrolytes and sample types, the specific capacitance is calculated according to Equation (4) [Citation49]. For this reason, the mass msp of the tested specimen must be determined before the experiment. Using the measured data of current I and voltage U during the cyclic voltammetry (CV) the capacitance Csp of the sample can be determined based on the scan rate dU/dt.
To establish an additional correlation, the specific electrical conductivity of the tested CNT papers is measured using the four-point measurement method. This method takes the paper thickness tsp and width wsp into account. Furthermore, the distance of the inner electrodes d = 5.5 mm is used. The specific conductivity Y is caculated using the applied current I and measured voltage U according to Equation (5) [Citation50].
Y is averaged from the results using 1 mA, 5 mA and 10 mA as applied current.
3. Results and discussion
In the following section, the morphology-assessment of CNT papers, results of free strain measurements and mechanical properties are analyzed and discussed.
3.1. CNT paper morphology
The filtrated paper made of CNT powder is analyzed using scanning electron microscopy due to the nano- and micro-scaled dimensions of CNTs. (a)–(c) present different resolutions of the CNT paper cross section which reveals the internal micro- and nanostructure. In (a), several delaminations are visible between the different layers of the paper. A closer view of the interface of one layer reveals even more, smaller delaminations in (b), which are bridged by single SWCNTs or bundles of SWCNTs. It can be assumed that the layers are weakly attached to each other by SWCNT bundles in thickness direction. In terms of mechanical loading, the in-plane mircostructure seems to be more homogeneous and therefore loadable. A top view of the fracture line as is shown in (d) reveals aligned SWCNTs bundles. These bundles are tapered conically as they consist of several dozen SWCNTs at the fracture line and are reduced to single CNTs at their free standing ends.
Figure 4. SEM pictures of an analyzed CNT paper: (a) Cross-section view of a broken CNT paper revealing a layer-like morphology (b) Detailed view of the cross-section showing a larger number of small cracks and delaminations between different layers of the paper (c) High resolution view of the interlinking SWCNTs between the separated layers of the paper (d) Top view of the fold line of a broken CNT paper.
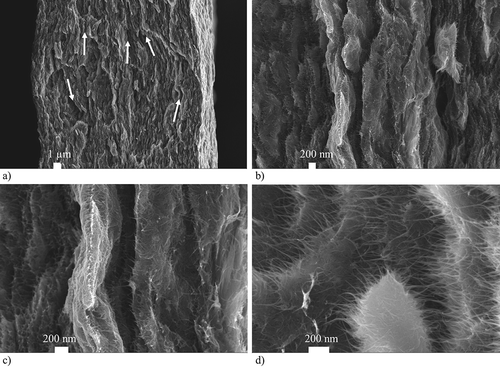
These SEM pictures give us an idea about the internal nano- and microstructure that causes the macroscopic mechanical behavior of a CNT paper. Due to their surface energy, the individual SWCNTs tend to form bundles. During filtration, these bundles are probably forming islands. They are bonded to each other via Van der Waals force and are also partially entangled. The CNT layers are not completely separated but connected by a few individual CNTs and CNT bundles. During the gravity- and flow-induced filtration, a density-induced sedimentation of the dispersed material takes place. This results in density layers and a density gradient in thickness direction of the paper with high density because highly agglomerated material is deposited directly on the filter membrane. In contrast, low density, nano-scopic material remains comparatively long in dispersion. It can be expected that the remaining material of this category sediments as soon as the last water is pushed through the membrane. The view of the top microstrucre appears to be very homogeneous and smooth because of a layer of highly compacted small low density particles. However, the layer density is comparatively high due the compacted material. It is the opposite near the membrane where the mircostructure is not as homogeneous due to bigger agglomerates. The global density of the membrane-near layer would be lower. Due to the small dimensions of a CNT paper, even computer tomographic analyzes of the mircostructure density are too imprecise to prove this structure model of a CNT paper. Earlier experiments revealed a buckling of the CNT papers tested in ionic liquids. This finding further confirms the assumption that a CNT paper can be considered a porous structure, that features anisotropic microstructure when comparing the in-plane and thickness direction. A comparison of the determined strain values of the presented in-plane strain measurements illustrated in and the results of Haque and Koslido [Citation12,Citation43] support this theory. Bother tests were conducted along the thickness direction [Citation12] and reached one order of magnitude higher strain results.
3.2. Results of in-plane measurements
The following section deals with the results obtained using the in-plane test set-up. Two procedures are used for the measurements: The first test series is performed using different papers for each electrolyte, while in the second test series one paper is used for all electrolytes.
3.2.1. Cyclic voltammetry
All cyclic voltammetry measurements which are presented in are conducted under similar conditions with the exception of the sample: a scan rate of 40 mV/s, a voltage cycle of 0.5 V and the same saturated calomel reference electrode.
Figure 5. Results of the cyclic voltammetry experiments at a scan rate of 40 mV/s using a SCE: (a) Cyclic voltammetry of tests conducted on the same CNT paper with different electrolytes (b) Cyclic voltammetry of tests using different CNT papers for each electrolyte.
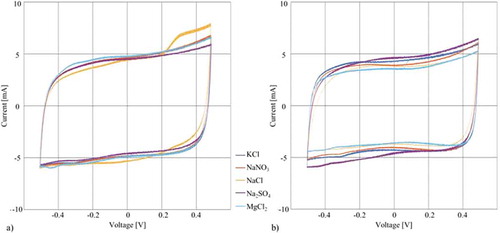
As illustrated in (a), using the same CNT paper for all electrolytes results in almost congruent graphs. However, taking the active mass of the sample into account for calculating the specific capacity that is presented in , some differences can be observed. For these calculations only the weight of the working electrode is used. While most of the specific capacities are around 22 F/g and below, the NaCl solution reaches a comparatively high value. This correlates with the findings of Riemenschneider [Citation51] who also measured the highest capacity for a one molar NaCl electrolyte compared to other aqueous electrolytes. It is difficult to explain this effect by the radii of the ions. While the Cl- ion is the smallest crystalline and hydrated, negative charged ion, which may easily diffuse into porous paper and accumulate in a high density at the electrode causing the aforementioned results, the same effect cannot be suggested as an explanation for the Na+ ion since the Mg2+ ion has the smallest crystalline size and the K+ ion is smallest in a hydrated state.
Table 3. Specific capacitances of different one molar electrolytes using the two sample approaches at 0.5 V and a scan rate of 40 mV/s (calculated using one CV cycle in constant state).
Maybe the differences between the radii are too small to be measured using cyclic voltammetry. The NaCl electrolyte may reach the best results because it is tested first without any contamination, unlike all of the other electrolytes that are tested afterwards.
The CV graphs in (b) and the corresponding specific values in reveal more divergent courses, calculated specific capacitances and completely different relations compared to the earlier test. Here, the sodium nitrate-based electrolyte reaches almost double the capacitance compared to all other results which are distributed around a mean value of 19.62 F/g. In both cases, with respect to the Na+ and NO ion, their crystalline and hydrated radii are of medium size. Therefore, taking the radii into account will not provide an explanation. Although the CNT-samples are cut from the same master paper and almost the same area, it can be assumed that even a little change in morphology and density has a tremendous influence on such sensitive results. These influences seem to overlap all effects caused by the different ion sizes. However, in Section 3.3 the morphological variations are addressed by comparing the mechanical and electrical properties of the tested papers.
Regardless of the test approach the current rises near 0.5 V because of chemical reactions (oxidation). Possibly residues of the CNT paper contamines the electrolyte and causes the moderate peak. However, while the peaks in (a) are almost overlapping a further oxidation-induced contamination by ions of earlier tests can be neglected. In contrast, the peaks in (b) are different in gradient and height. This is a clear indication that the morphology varies and causes with interaction of the electrolyte different chemical reactions.
In a nutshell, the cyclic voltammetry results already show decisive differences between the two approaches. Regardless of the approach, establishing a correlation of the results with the ion radii is difficult based on the prevalent opinion that charged ions are attracted by oppositely charged electrodes. No ion radius-related trends in terms of increasing capacitances can be verified. This may, for example, be caused by effects that are too small to be measured and/or a less sensitive measurement and/or ion radii which feature geometries of almost the same size. When an individual paper is used for each electrolyte, a morphology-based density influence on the results is obvious and overlaps at this approach with all ion-dependent effects. However, a correlation between ion radii and specific capacitance cannot be proven.
It seems like the approach required to correlate the specific capacitance with the ion radius, which is based on the concept of ions gathering on the electrode surface, is much more complex. Fundamental experiments revealed a multi-layered system instead of a simple double-layer system on the electrode [Citation52]. Furthermore, sieving effects limit accessibility due to a porous electrode microstructure which is only accessible for a certain range of ion radii [Citation53].
3.2.2. Results of different CNT papers used for each electrolyte
In the first approach, each electrolyte is tested using a separate CNT paper. This approach prevents a contamination with earlier tested electrolyte ions. In (a), the results of the isotonic free strain measurements are presented with the focus on a variation of the positive ions when the negative ion Cl- is kept constant. (b) shows the results for a variation of negative ions which all have the same counterion, Na+.
Figure 6. Free strain of different electrolytes using individual CNT paper cut from the same master CNT paper: (a) Results of the free strain measurements using the same negative ion Cl- (b) Results of the free strain measurements using the same positive Na+ ion.
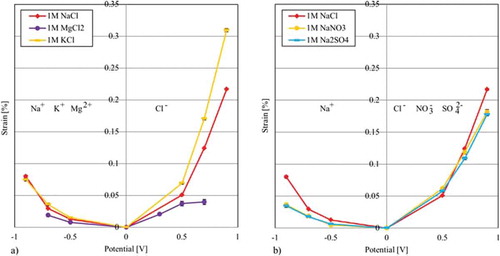
Due to the fact that the free strain generated by the positive ions is only half to a third of that generated by the negative ions, a comparison is more difficult here. Furthermore, high standard deviations result in an overlapping of the results so that a clear differentiation between the ions can only be found for voltages −0.5 V. For the results of −0.5 V and −0.7 V, which are collected for all electrolytes, K+ reaches the highest values followed by the results of the Na+ ion and Mg2+ ion. Taking the results shown in into account, these findings show a linear correlation to the crystalline radii. With 133 pm, K+ features the largest radius compared to the Na+ ion (95 pm) and the Mg2+ ion (65 pm). If it can be supposed that ions lose their hydrate shell as result of, e.g. the pore size of the electrode nanostructure, the ion size could be a decisive factor for causing the measured deflection. However, it also has to be considered that the negative ion Cl- causes differing strain results in (a) on the right side of the graph. Since the amount of negative ions is the same, the effect can only be morphology-induced. The nanostructure seem to differ only within mm on the master paper. Another reason could be the cutting of the samples which may cause cracks as shown in (b). These cracks enable ions access into the nanostructure; the more cracks are generated by cutting, the higher the accessibility.
The comparison of the negative ions in (b) is easier due to higher actuation values. Here, a clear trend can be found for +0.7 V and +0.9 V, with sodium chloride to reaching the highest values, followed by sodium nitrate, and very closely behind sodium sulphate. At +0.5 V, sodium chloride generates the lowest strain, while the relation between NaNO3 and Na2SO4 keeps the same. Due to the fact that both radii, are increasing in the same way, the strain values inversely correlate with the ion size: the smaller the ions, the higher the strain. This correlation can also be explained with a sieving effect, i.e. only ions with a specific radius can diffuse into the porous structure of the CNT paper. It has to be mentioned again that also the graphs of the Na+ ions are not perfectly superimposing.
3.2.3. Results of tests using the same CNT paper for all electrolytes
The analysis of the free strain results of the test series in which the same CNT paper is used for all electrolytes is conducted analogue to the previous series. In (a), the negative ion chloride is kept constant and the positive ions are switched. Due to comparatively small values, the identification of a clear trend is rather difficult since the standard deviations may cause superimposed results. Again, the K+ ion reaches the highest values, followed by the graph of the sodium ion. This is in good agreement with earlier findings of a correlation between strain and crystalline radius. In terms of a correlation with the hydrated radii, sieving effects of the nanostructure affecting ions with radii 358 pm provide a reasonable explanation.
Figure 7. Free strain of different electrolytes using the same CNT paper: (a) Results of the free strain measurements using the same negative ion Cl (b) Results of the free strain measurements using the same positive Na
ion.
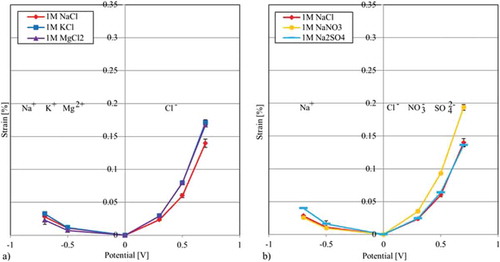
(b) shows the results for having a constant positive ion and altering negative ions. Here, we find the highest results for nitrate, followed by chloride and sulphate with almost identical values. Upon closer examination it can be seen that there are no clear trends since the sulphate ion reaches slightly higher values at +0.3 V and +0.5 V while, Cl- generates higher strains at +0.7 V. Due to the fact that the NO ion is the mid-size ion but reaches the highest results, this test cannot reveal any clear trends in terms direct radius/strain correlation.
For an even better overview of the effects of the ion radii on the generated strain, all results are condensed in . The correlations of the crystalline radii are presented in (a, b), while the results of the hydrated radii are shown in (c, d). Furthermore, the approach using individual CNT papers for each electrolyte is presented in (a, c). Results using one CNT sample for testing all electrolytes can be found in (b, d).
Figure 8. Correlations between crystalline/hydrated radii and generated strain of the two different approaches: (a) Correlation of the crystalline ion radii and strain using an individual paper for each electrolyte (b) Correlation of the crystalline ion radii and strain using one paper for all electrolytes (c) Correlation of the hydrated ion radii and generated strain using an individual paper for each electrolyte (d) Correlation of the hydrated ion radii and strain using one paper for all electrolytes.
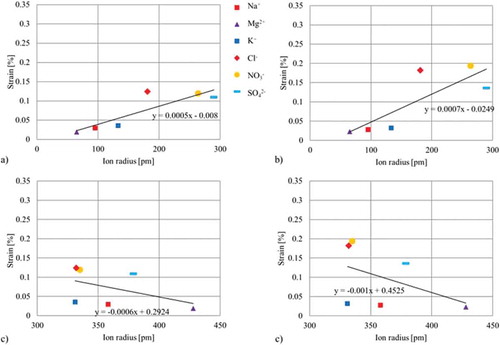
Due to the wider range of crystalline radii of 65–290 pm (see (a, b)), a clearer correlation in the form of a linear trend between the ion radii and the measured strain – the smaller the ion, the smaller the generated strain – can be found. This correlation is even more obvious when looking at the results of the smaller positive charged ions, regardless of the sample approach used. Furthermore, a significantly smaller strain effect can be found for small-sized (positive) ions compared to bigger-sized (negative) ions. However, the high standard deviation of results and a less obvious correlation with respect to the larger, negative charged ions may be caused by sieving effects. The low strain results of the biggest ion SO42-, in particular, indicate a limitation of accessibility. The question as to why the ions should completely lose their hydrate shell still remains open. One explanation may be that they need to reduce their size to intercalate into the electrode and that they are only able to diffuse into the pores by leaving the hydrate shell outside of the material. Furthermore, a deformation of the hydrate shell as result of an electrostatically-induced accumulation takes place within the narrow pores on the surface of the charged electrode. Due to the presence of too many ions per free electrode area, the flexible hydrate shell is deformed or even lost. Therefore, according to the Grahame model [Citation54], the solvent and less hydrated ions form a compacted inner and outer Helmholz-layer, which indicates a more dominating effect of the crystalline radius. In the latter case, the hydrate shell would be able to adapt its size, which would not be assumed as circular any more. In comparison, correlations with respect of the hydrated ion radii are presented in (c, d). Here, an even more inverse behavior – the larger the size, the lower the strain – can be found. These completely different results may be a result of the very small range of radius sizes between 331 and 428 pm. Some radii such as the K+, Cl- and NO ions only differ by one to four pm, which might be too small a difference to be detected using this even more macroscopic method. However, a possible explanation for this correlation could be that the larger hydrated ions are not as attracted by the charged electrodes as is the case for the smaller ions, and thus do not accumulate as much on the electrode’s surface an into the electrode’s micro- and nanostructure. This reduced accumulation results in a reduced density of larger ions within the electrode, causing lower strain.
3.3. Results of the actuated tensile tests
In a first investigation, all individual CNT papers are analyzed mechanically to determine whether the different papers have mechanical properties which may influence the active behavior as Suppiger [Citation15] supposed. The papers are tested mechanically under dry and wet condition (deionized water) within the framework of the test series, which includes between 8 and 13 individual tests. An overview of the results is given in . In addition, the specific electrical conductivity is also calculated and added to the following Table in order to show a correlation for these paper properties.
Table 4. Mechanical properties of the tested CNT papers under dry and wet conditions (all electrolytes with one molar concentration) and their specific electrical conductivity in dry state.
As was already mentioned in an earlier publication [Citation46], the elastic modulus varies between 248.8 MPa and 310 MPa although all the samples are cut from the same master-paper at almost the same area. Based on the values for the dry state, the results for the wet state show a decrease ranging from 0.12 (MgCl2) to 27.5 (NaCl) for two groups of papers featuring different mechanical stability, regardless of the dry values. The first group reveals the highest mean mechanical loss of 22 (NaCl, Na2SO4, NaNO3) by reaching a comparatively high mean elastic modulus of 271 MPa while, the second group shows losses of only 2.6
while featuring a comparatively similar mean elastic modulus of 272 MPa within the test series (KCl, MgCl2). Here, with regrads to the two groups no general trend can be seen. An even clearer correlation can be found when comparing the strain (of both potentials, in this case
0.7 V) with the elastic modulus. This correlation is shown in (b) and is in good agreement with earlier findings of Suppiger [Citation15]. An almost linear correlation reveals the influence of the mechanical stability of the nano- and microstructure on the active behavior.
Figure 9. Different correlations of the elastic modulus: (a) Correlation between elastic modulus and measured electrical conductivity (b) Correlation between the elastic modulus and the free strain results at 0.7 V.
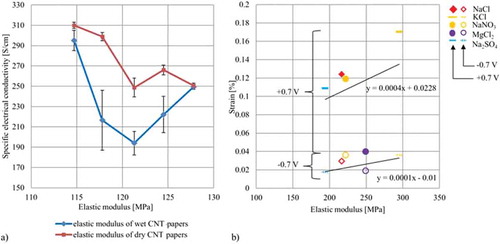
Furthermore, an evaluation of the elastic modules and the electric conductivity is presented in (a) to prove a direct correlation between the structural integrity and the electrical conductivity. Here, a linear inverse correlation can be found for dry papers. This result can be explained by the nano- and microstructure, which might differ with respect to the material. The smaller the material, such as amorphous carbon and residues of broken tubes the higher the electrical resistance due to more interfaces. A similar trend cannot found watching the wet results since here papers ranging in the middle loose most of their conductance. However, one would expect that due to the wetting the linkings between bundles and single tubes is reduced resulting in a decreasing mechanical stiffness and electrical conductance. With regards to a dramatically rise of the standard deviation this assumption can be confirmed. However, the actual graph can be explained by CNT papers with low stiffness/high micromechanical flexibility, which is not further reduced by wetting. The stiff CNT papers are almost untouched by wetting due to a stiff microstructure. Again, the results verify the strong influence of the mircostructure on the active behavior. In the last test series of the actuated tensile test, the mechanical change of CNT papers under various conditions is tested. Therefore, CNT papers are tested mechanically under wet condition within the individual electrolyte and in charged mode (within the electrolytes) using the voltage steps 0.5 V. The aim of this approach is to demonstrate a charge-induced influence of the ion diffusion and its effects on the mechanical stability of the paper. shows all of the results. It can be seen that the Young’s modulus reduces with charge at all electrolytes except for the MgCl2 solution where the results remain almost constant regardless of the charging. The negative charged anions Cl- and NO
reveal a bigger impact on the elastic modulus than the positive cations at the same potential. Interestingly, the effect of the negative ion (Cl-) is different when different electrolytes (NaCl, KCl and MgCl2) are used. These findings are in accordance with the results of the in-plane strain measurements mentioned before and may be attributed to the ion radii and/or varying stiffnesses of the samples. While the negative Cl- ions of the NaCl solution cause a loss of 1.4% at a voltage of +0.5 V, a comparatively high result and MgCl2 where the Cl- ions cause almost no loss or even reach slightly higher values. In contrast, the NO
ions cause a loss of 17.6% at +0.5 V. This effect of NO
ions can be expected due to their bigger geometry as shown in . However, the stiffness reduction of 2% of the SO42- is comparatively small with respect of its ion radius. It is very likely that more Cl- ions are attracted to intercalate into the paper. Reasons for different results for the same ion (Cl-), although the same counter and reference electrode, molar concentration and charge are used, can either be unknown interactions with the positive counter ion and/or different ion geometries and/or an effect of the electrode’s specific inner and outer surfaces and/or an incomplete dissociation of the ions or a combination thereof. This way an even more general conclusion with respect of the crystal or hydrated radius of the different ions can be stated which is in accordance to the earlier findings of the in-plane strain measurements: smaller ions generate lower stiffness losses compared to the bigger negative charged ions. The biggest ion in this study seems to be almost ineffective (regardless of the test), while smaller ions can cause significant mechanical degradation. However, a linear correlation might not be able due to overlapping ion- and microstructure-induced effects.
Table 5. Overview of results of the actuated tensile tests of CNT papers conducted with electrolytes of one molar concentration using a SCE.
In general, a reduction of the elastic modulus caused by charging the sample seems to be a basic trend. The effect of the charged KCl, MgCl2 and Na2SO4 ions is comparatively insignificant. In contrast, in the test series in which the sodium chloride solution is used, the effect of the Cl- ions is more dominant, while in the series in which NaNO3 is used, the negative ion NO causes a loss of almost 38
and the positive Na+ ion causes an overall loss of 6.4
(calculated in comparison to the wet but uncharged state). Using higher voltages steps would further highlight the impact of different ion radii on the mechanical properties.
3.4. Measurement-induced sample geometry change
Similar to Equation (2), the strain of the in-plane measurements is calculated using an initial length l0. If it can be assumed that the tested material remains the same regardless of wetting and electrical charging, the first measured length can be used for all strain calculations. However, since a change of the structural properties has been detected during the tests of this study, the sample must be monitored. Therefore, the current initial length is measured before every test in order to calculate the correct strains. In , the results of the sample geometry monitoring are presented.
Figure 10. Overview of the results obtained from monitoring the geometry of three samples; monitoring took place during in-plane strain tests and revealed significant changes of geometry. The blue graph shows the change of the sample which was used for different electrolytes. The red graph reveals similar changes of the sample based on the measurement values taken at different sections, using one molar Na2SO4.
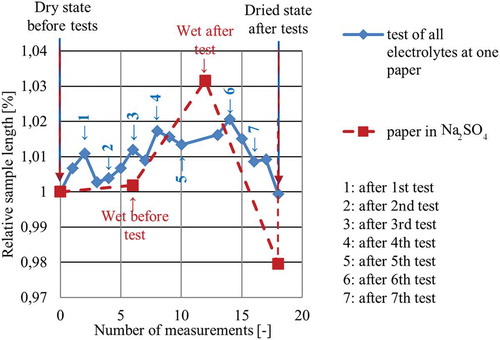
Just as it is the case for the mechanical degradation, the sample’s geometry changes with respect to its length (propably the whole shape) based on the test conditions. This fact can easily be seen when taking a look at the red and green graphs of , which present the in-plane measurements of Na2SO4. The sample swells when it is immersed into the electrolyte, resulting in an increased length compared to l0 before the test. After the measurements are taken, a strong contraction can be detected during sample drying, which results in an almost recovered length. The Na2SO4 sample contracts stronger which results in a smaller length compared to the initial length measured before the tests.
The measurements conducted at the one sample which is used for all electrolytes reveal similar geometry changes but with smaller values. However, after the 4th measurement, somewhat of a plateau is reached, maybe some sort of saturation of the paper structure after which the paper tends to contract. A measurement of the sample length in dry conditions on the same day reveals a slightly larger geometry, while a measurement on the next day shows dimensions which are smaller than the initial geometry. This indicates that the drying process may be very long. In conclusion, the final length lfinal which is shorter than the initial length l0 in dry condition seems to be standard. This again illustrates the flexibility of the nano- and micostructure which seems to be the most important factor when it comes to strain generation of CNT papers.
4. Conclusion and outlook
In this study, several approaches are presented to identify the decisive parameter for CNT paper actuation. Within the framework of the test series, several effects such as the structural integrity of the nano- and microstructure, the ion size, the interactions of ions with the charged inner and outer electrode surfaces, the test conditions and the electrical charging are addressed. Several significant influencing factors are also identified by these tests. The nano- and mircostructure itself changes within the tests and does not even seem to be a constant parameter throughout the master paper in a dry state. Regardless of the test the structure stiffness behaves inversely linear to the generated strain. Furthermore, the ion size, based on the crystalline radii, affects the generated strain. The effect is all the more impressive for the small crystalline radii of the positive ions. Here, the trend can be verified regardless of the approach. A correlation for the bigger, negative ions is not as clear as it is the case for the cations. However, results clearly differ when small positive ions (smaller strain) are used as compared to when bigger negative ions (higher strain) are used. The results obtained indicate a sieving effect for bigger ions since the effect of the biggest anion in this study, SO42-, is comparatively small. The ion radii are probably too similar, especially for the hydrated ions so that conclusive statements are lost in the standard deviation and uncertainties of the set-up.
In further investigations the 0.5 molar concentrations of MgCl2 and Na2SO4 are analyzed in order to have comparable conditions in terms of the potential charge. However, the results are almost the same compared to those of the 1 M concentration and therefore not giving any different view on the findings. They are not mentioned because of reasons of clarity. The presented study has to be considered as a comparison of the same amount of different ions.
Future tests should focus on elctrolytes with ions which can be clearly distinguished in terms of crystalline and hydrated ion radii. Furthermore, more detailed sample monitoring, such as specific surface measurements may reveal the microstructure and structural properties of individual CNT-samples. If possible, the sensitivity of the test set-ups should also be improved by replacing the PTFE clamps and the usage of force transmission elements to fix the samples within the mountings. In addition, it would make sense to monitor the electrolytes used in the tests to detect changes in concentration and contamination in order to evaluate their quality.
Acknowledgments
This work is part of the basic research on future smart materials at the DLR – Institute of Composite Structure and Adaptive Systems. It was supported by the German Research Council (DFG) within the framework of the DFG PAK 355 – ‘Basics for CNT-based Actuators’ and the German Federal Ministry of Education and Research (BMBF) project ‘Aktu_Komp’. Tribute also has to be paid to Prof. Karl Schulte and his assistant Dr. Thea Schnoor of the Institute of Composite Polymers at the Technical University of Hamburg-Harburg (TUHH) and Prof. Frank Endres and Dr. Timo Carstens of the Institute of Mechanical Process Engineering, Department of Interface Chemistry, at the University of Clausthal-Zellerfeld for supporting the presented research with their analysis techniques and expertise in the field of ionic liquids.
Disclosure statement
No potential conflict of interest was reported by the authors.
Additional information
Funding
References
- S. Iijima, Helical microtubules of graphitic carbon, Nature 354 (1991), pp. 56–58. doi:10.1038/354056a0
- M.-F. Yu, B.S. Files, S. Arepalli, and R.S. Ruoff, Tensile loading of ropes of single wall carbon nanotubes and their mechanical properties, Phys. Rev. Lett. 84 (1998), pp. 5552–5555. doi:10.1103/PhysRevLett.84.5552
- D.A. Walters, L.M. Ericson, M.J. Casavant, J. Liu, and D.T. Colbert, Elastic strain of freely suspended single-wall carbon nanotube ropes, Appl. Phys. Lett. 74 (1999). doi:10.1063/1.124185
- M.-F. Yu, O. Lourie, M.J. Dyer, K. Moloni, T.F. Kellyand, and R.F. Ruoff, Strength and breaking mechanism of multiwalled carbon nanotubes under tensile load, Science 287 (2000), pp. 637–640. doi:10.1126/science.287.5453.637
- Q.W. Li, Y. Li, X.F. Zhang, S.B. Chikkannanavar, Y.H. Zhao, A.M. Dangelewicz, L.X. Zheng, S.K. Doorn, Q.X. Jia, D.E. Petersen, P.N. Arendt, and Y.T. Zhu, Structure-dependent electrical properties of carbon nanotube fibers, Adv. Mater. 19 (2007), pp. 3358–3363. doi:10.1002/adma.200602966
- U. Vohrer and N. Zschoerper, Kohlenstoff-Nanoroehren - Pḧoenix aus der Asche, Vakuum Forschung Und Praxis 19 (2007), pp. 22–30. doi:10.1002/(ISSN)1522-2454
- N. Grobert, Nanotubes - grow or go? Mater. Today 9 (2006), pp. 64. doi:10.1016/S1369-7021(06)71680-7
- R.H. Baughman, C. Cui, A.A. Zakhidov, Z. Iqbal, J.N. Barisci, G.M. Spinks, G.G. Wallace, A. Mazzoldi, D. De Rossi, A.G. Rinzler, O. Jaschinski, S. Roth, and M. Kertesz, Carbon nanotube actuators, Science 284 (1999), pp. 1340–1344. doi:10.1126/science.284.5418.1340
- W.L. Guo and Y.F. Guo, Giant axial electrostrictive deformation in carbon nanotubes, Phys. Rev. Lett. 2 (2002), pp. 311–314.
- E.T. Thostenson and T.-W. Chou, On the elastic properties of carbon nanotube-based composites: Modelling and characterization, J. Phys. D: Appl. Phys. 36 (2003), pp. 573–582. doi:10.1088/0022-3727/36/5/323
- C. Li, E.T. Thostenson, and T.-W. Chou, Sensors and actuators based on carbon nanotubes and their composites: a review, Comp. Sci. Tech. 68 (2008), pp. 1227–1249. doi:10.1016/j.compscitech.2008.01.006
- U. Koslido, D.G. Weis, K. Hying, M.H. Haque, and I. Kolaric, Development of measurement set-up for electromechanical analysis of bucky paper actuators, J. Nanotechn. 3 (2007), pp. 1–11.
- M. Hughes and G.M. Spinks, Multiwalled carbon-nanotube actuators, Adv. Mater. 17 (2005), pp. 443–446. doi:10.1002/(ISSN)1521-4095
- H. Ebron, Z. Yang, D.J. Seyer, M.E. Kozlov, J. Oh, H. Xie, J. Razal, L.J. Hall, J.P. Ferraris, A.G. MacDiarmid, and R.H. Baughman, Fuel-powered artificial muscles, Science 311 (2006), pp. 1580–1583. doi:10.1126/science.1120182
- D. Suppiger, S. Busato, P. Ermanni, M. Motta, and A. Windle, Electromechanical actuation of macroscopic carbon nanotube structures: Mats and aligned ribbons, Phys. Chem. Chem. Phys. 11 (2009), pp. 5180–5185. doi:10.1039/b822862k
- J. Riemenschneider, H. Temmen, and H.-P. Monner, CNT based actuators: experimental and theoretical investigation of the in-plain strain generation, J. Nanosci. Nanotech. 7 (2007), pp. 3359–3364. doi:10.1166/jnn.2007.837
- G. Sun, J. Kürti, M. Kertesz, and R.H. Baughman, Dimensional changes as a function of charge injection in single-walled carbon nanotubes, J. Amer. Chem. Soc. 124 (2002), pp. 15076–15080. doi:10.1021/ja020616j
- G. Spinks, G.G. Wallace, L.S. Fifield, L.R. Dalton, A. Mazzoldi, D. De Rossi, I.I. Khayrullin, and R.H. Baughman, Pneumatic carbon nanotube actuators, Adv. Mater. 14 (2002), pp. 1728–1732. doi:10.1002/1521-4095(20021203)14:23<1728::AID-ADMA1728>3.0.CO;2-8
- P.G. Whitten, G.M. Spinks, and G.G. Wallace, Mechanical properties of carbon nanotube paper in ionic liquid and aqueous electrolytes, Carbon 43 (2005), pp. 1891–1896. doi:10.1016/j.carbon.2005.02.038
- S. Gupta, M. Hughes, A.H. Windle, and J. Robertson, In situ raman spectroelectrochemistry study of single-wall carbon nanotube mat, Diam. Relat. Mater. 13 (2004), pp. 1314–1321. doi:10.1016/j.diamond.2003.10.015
- L. Kavan, P. Rapta, and L. Dunsch, In situ raman and vis-nir spectroelectrochemistry at single-walled carbon nanotubes, Chem. Phy. Lett. 328 (2000), pp. 363–368. doi:10.1016/S0009-2614(00)00940-4
- P. Corio, P.S. Santos, V.W. Brar, G.G. Samsonidze, S.G. Chou, and M.S. Dresselhaus, Potential dependent surface raman spectroscopy of single wall carbon nanotube films on platinum electrodes, Chem. Phy. Lett. 370 (2003), pp. 675–682. doi:10.1016/S0009-2614(03)00157-X
- K. Murakoshi and K.-I. Okazaki, Electrochemical potential control of isolated single-walled carbon nanotubes on gold electrode, Electrochimica Acta 50 (2005), pp. 3069–3075. doi:10.1016/j.electacta.2004.12.045
- M. Kalbac, H. Farhat, L. Kavan, J. Kong, K.-I. Sasaki, R. Saito, and M.S. Dresselhaus, Electrochemical charging of individual single-walled carbon nanotubes, ACS Nano 3 (2009), pp. 2320–2328. doi:10.1021/nn9004318
- S. Roth and R.H. Baughman, Actuators of individual carbon nanotubes, Cur. App. Phy. 2 (2002), pp. 311–314. doi:10.1016/S1567-1739(02)00116-5
- T. Yu, Z. Ni, C. Du, Y. You, Y. Wang, and Z. Shen, Raman mapping investigation of graphene on transparent, flexible substrate: The strain effect, J. Phys. Chem. C Lett. 112 (2008), pp. 12602–12605. doi:10.1021/jp806045u
- A. De La Vega, I.A. Kinloch, R.J. Young, W. Bauhofer, and K. Schulte, Simultaneous global and local strain sensing in swcnt-epoxy composites by raman and impedance spectroscopy, Comp. Sci. Tech. 71 (2011), pp. 160–166. doi:10.1016/j.compscitech.2010.11.004
- H. Yoon, J. Xie, J.K. Abraham, V.K. Varadan, and P.B. Ruffin, Passive wireless sensors using electrical transition of carbon nanotube junctions in polymer matrix, Smart Mater. Struct 15 (2005), pp. 14–20. doi:10.1088/0964-1726/15/1/004
- X. Yu, R. Rajamani, K.A. Stelson, and T. Cui, Carbon nanotube-based transparent thin film acoustic actuators and sensors, Sens. Actuat. Phys. 132 (2006), pp. 626–631. doi:10.1016/j.sna.2006.02.045
- Y. Tai, T.K. Bera, Z. Yang, and G. Lubineau, Leveraging a temperature-tunable, scalelike microstructure to produce multimodal, supersensitive sensors, Nanoscale 9 (2017), pp. 7888–7894. doi:10.1039/C7NR01662J
- Y.-H. Yun, A. Miskin, P. Kang, S. Jain, S. Narasimhadevara, D. Hurd, V. Shinde, M.J. Schulz, V. Shanov, P. He, F.J. Boerio, D. Shi, and S. Subramanian, Carbon nanofiber hybrid actuators: Part II - solid electrolyte-based, J. Intell. Mater. Sys. Struc. 17 (2006), pp. 191–198. doi:10.1177/1045389X06057531
- W. Zheng, J.M. Razal, P.G. Whitten, R. Ovalle-Robles, G.G. Wallace, R.H. Baughman, and G.G. Spinks, Artificial muscles based on polypyrrole/carbon nanotube laminates, Adv. Mater 23 (2011), pp. 2966–2970. doi:10.1002/adma.201100512
- T.I. Schnoor, U. Vainio, L.-H. Shao, E.T. Lilleodden, M. Mueller, A. Schreyer, K. Schulte, and B. Fiedler, Nanostructured mwcnt/polypyrrole actuators with anisotropic strain response, Carbon. 18 (2015), pp. 597–607.
- S. Lu and B. Panchapakesan, Optically driven nanotube actuators, Nanotech. 16 (2005), pp. 2548–2554. doi:10.1088/0957-4484/16/11/014
- Y. Wang and J.T.W. Yeow, A review of carbon nanotubes-based gas sensors, J. Sens. 2009 (2009), pp. Article ID 493904.
- F.H. Gojny, M.H.G. Wichmann, U. Kpke, B. Fiedler, and K. Schulte, Carbon nanotube-reinforced epoxy-composites: Enhanced stiffness and fracture toughness at low nanotube content, Compos. Sci. Technol. 64 (2004), pp. 2363–2371. doi:10.1016/j.compscitech.2004.04.002
- S.H. Kim, C.S. Haines, N. Li, K.J. Kim, T.J. Mun, C. Choi, J. Di, Y.J. Oh, J.P. Oviedo, J. Bykova, S. Fang, N. Jiang, Z. Liu, R. Wang, P. Kumar, R. Qiao, S. Priya, K. Cho, M. Kim, M.S. Lucas, L.F. Drmmy, B. Maruyama, D.Y. Lee, X. Lepr, E. Gao, D. Albarq, R. Ovalle-Robles, S.J. Kim, and R.H. Baughman, Harvesting electrical energy from carbon nanotube yarn twist, Science 357 (2017), pp. 773–778. doi:10.1126/science.aam8771
- F. Bguin, V. Presser, A. Balducci, and E. Frackowiak, Carbons and electrolytes for advanced supercapacitors, Adv. Mater 26 (2014), pp. 2219–2251. doi:10.1002/adma.201304137
- Y. Sun, R. Wilson, and D.I. Schuster, High dissolution and strong light emission of carbon nanotubes in aromatic amine solvents, J. A. Chem. Soc. 123 (2001), pp. 5348–5349. doi:10.1021/ja0041730
- S. Rips and M.J. Hartmann, Quantum information processing with nanomechanical qubits, Phys. Rev. Lett. 110 (2013), pp. 120503. doi:10.1103/PhysRevLett.110.120503
- U. Koslido, M. Omastova, M. Micusik, G. CiriC-Marjanovic, H. Randriamahazaka, T. Wallmersperger, A. Aabloo, I. Kolaric, and T. Bauernhansl, Nanocarbon based ionic actuators - a review, Smart Mater. Struc. 22 (2013), pp. 104022. doi:10.1088/0964-1726/22/10/104022
- E.R. Nightingale, Phenomenological theory of ion solvation. Effective radii of hydrated ions, J. Phys. Chem. 63 (1959), pp. 1381–1387. doi:10.1021/j150579a011
- M.H. Haque, I. Kolaric, U. Vohrer, T. Wallmersperger, M. Dóttavio, and B. Kroplin, Multiwalled carbon-nanotubes-sheet actuators: Theoretical and experimental investigations, Proc. SPIE. 5759 (2005), pp. 1–11.
- G. Spinks, G. Wallace, R. Baughman, and L. Dai, Carbon nanotube actuators: Synthesis, properties and performance, in Electroactive Polymer (EAP) Actuators as Artificial Muscles, J. Bar-Cohen, ed., 1st ed., SPIE Press, Bellingham, WA, 2008, pp. 261–295.
- T. Mirfakhrai, Carbon nanotube yarn actuators, Ph.D. diss., University of British Columbia, 2009.
- S. Geier, T. Mahrholz, P. Wierach, and M. Sinapius, Experimental investigations of actuators based on carbon nanotube architectures, in Smart Structures and Materials, Selected Papers from the 7th ECCOMAS Thematic Conference on Smart Structures and Materials, C.M.S.A. Araujo, ed., 1st ed., Springer International Publishing AG, Heidelberg, 2017, pp. 67–95.
- J. Wittenburg and E. Pestel, Festigkeitslehre, Ein Lehr- Und Arbeitsbuch, 3rd ed., Springer, Berlin, Heidelberg, New York, 2001.
- Normenausschuss Kunststoffe (FNK) im DIN, Din En Iso 527-5 Kunststoffe - Bestimmung Der Zugeigenschaften, DIN Deutsches Institut für Normung e. V., Beuth Verlag GmbH 01, 2010, pp. 1–19.
- C. Lämmel, M. Schneider, M. Weiser, and A. Michaelis, Investigations of electrochemical double layer capacitor (edlc) materials –A comparison of test methods, Mat.-Wiss. U. Werkstofftech 44 (2013), pp. 641–649. doi:10.1002/mawe.201300122
- R.L. Miller, W.L. Bradford, and N.E. Peters, Specific conductance: Theoretical considerations and application to analytical quality control, U.S. Biol. Survey Water-Supply Paper. 2311 (1988), pp. 116.
- J. Riemenschneider, Charakterisierung und modellierung von kohlenstoff-nanoröhren basierten aktuatoren, Ph.D. diss., Technical University of Braunschweig, 2008.
- R. Hayes, N. Borisenko, M.K. Tam, P.C. Howlett, F. Endres, and R. Atkin, Double layer structure of ionic liquids at the au(111) electrode interface: An atomic force microscopy investigation, J. Phys. Chem. C 115 (2011), pp. 6855–6863. doi:10.1021/jp200544b
- T.M. Arruda, M. Heon, V. Presser, P.C. Hillesheim, S. Dai, Y. Gogotsi, S.V. Kalinin, and N. Blake, In situ tracking of the nanoscale expansion of porous carbon electrodes, Energy Environ. Sci. 6 (2013), pp. 225–231. doi:10.1039/C2EE23707E
- D.C. Grahame, The electrical double layer and the theory of electrocapillarity, Chem. Rev 41 (1947), pp. 441–501. doi:10.1021/cr60130a002