
 ?Mathematical formulae have been encoded as MathML and are displayed in this HTML version using MathJax in order to improve their display. Uncheck the box to turn MathJax off. This feature requires Javascript. Click on a formula to zoom.
ABSTRACT
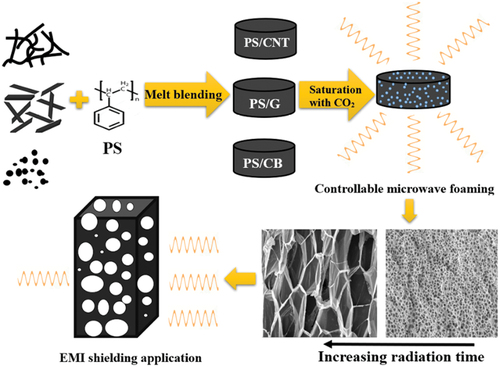
The effect of carbon black (CB), carbon nanotube (CNT), and graphene (G) on foaming, electrical conductivity (EC), and electromagnetic interference (EMI) shielding of polystyrene (PS) foam that has been produced via microwave heating operation and supercritical carbon dioxide (CO2) was studied. Foams containing 1 wt %, CNT, and G reached over 90% porosity after 30 s and 3 min radiation time, respectively; however, PS/CB foam did not expand properly even after 3.5 min. In addition, the expansion ratio of PS/CB and PS/G was one-sixth and one-half of PS/CNT, respectively – due to the great CNT’s ability to convert microwave radiation to heat. EC of solid and porous nanocomposites has been increased via raising filler content; however, PS/CNT displayed the highest value at the same volume fractions. This ascending trend could not endure during foaming, so a remarkable optimum-point has been observed for nanocomposite foams. Eventually, EMI-shielding properties of solid and foam nanocomposites were discussed.
Graphical Abstract
1. Introduction
Since introducing polymeric composites, having a high weight has been an undeniable problem in nanocomposites in many fields such as aerospace and medical applications [Citation1–8]. Overall, polymeric foams are porous materials that have outstanding properties like lightness, large surface area, a high strength/weight ratio, good thermal stability, low dielectric constant, superior thermal insulation, and low cost [Citation9]. Accordingly, having a lightweight composite using foam strategy is a great idea, but controlling the microstructure, dictating different properties, of the final composite foams is a challenging part of choosing a suitable foaming process and filler (due to the weak efficiency of neat polymers).
Micro and nano-sized fillers could ameliorate and enhance the final properties (like electrical properties) of polymer composites and their foams in which these properties hinged on filler size, shape, concentration, and aspect ratios [Citation10–15]. Thus, to tailor the excellent composite foams, it is essential to examine their microstructural features as well as their ability to employ them in different applications. As a rule of thumb, it has been found that smaller amounts of nano-scaled particles with higher aspect ratios compared with regular fillers are able to improve cellular morphology through cell size reduction and cell density increment via heterogeneous cell nucleation mechanisms [Citation16]. In as little as two decades, carbonaceous nano-fillers (graphene [Citation17–19], carbon black [Citation20], carbon nanotubes [Citation21–23], and so on) were profoundly investigated in composites and foamed materials and have engrossed much attention in academic and industrial research due to their superior properties in comparison to metal- and ceramic-based particles, having low flexibility and processability. Playing an undeniable role in the filler shape (or its geometry) is the critical issue of polymeric composite foams, especially in the electrical properties that nobody can rule out this hypothesis without frills [Citation24–26]. In other words, the various structures and filler–filler interaction of carbonic particles can fork out for the composite’s microstructure, and it also is capable of determining microcellular patterns [Citation27].
In addition to the role of filler, the foaming process and its conditions can determine the final properties of composite foam. Basically, the foaming process consists of three steps: 1. Saturation of polymer with a foaming agent, 2. Cell growth, and 3. Stabilization. At first, samples are saturated with supercritical gas – especially with CO2 or N2, which are environmental-friendly – to create a single-phase polymer-gas solution [Citation28–30]. Then, by applying thermodynamic instability (increasing temperature or decreasing pressure suddenly [Citation31,Citation32]), the initial viable bubbles started to appear, proceeding to grow as the dissolved gas diffused into the bubbles [Citation33]. The most known thermoplastic foaming processes are batch foaming, extrusion foaming, and foam injection molding. The type of polymer may dictate which foaming method is proper [Citation34–37]. Thus, different foaming technologies such as batch (single-step and multi-step) foaming, semi-continuous, and continuous processing routes have been implemented regarding the nature of the matrix [Citation38]. In addition to the importance of choosing the best process, foaming process conditions undoubtedly have an essential and inseparable part of polymer foam’s microstructure [Citation39–42]. Among various foaming process conditions, the role of temperature is critical in order to achieve a proper cell morphology. The high temperature (higher than optimum state) would cause low melt strength of a polymer resulting in cell rapture. Conversely, longer foaming times and an increase in polymer viscosity are the results of too low temperature. Therefore, based on the effect of foam’s microstructure on final properties, temperature decides which composite foams have a promising microcellular structure with an acceptable performance like electrical properties.
Due to the limitations as well as environmental and safety factors of the mentioned traditional procedures, such as high pressure and temperature special in developing thick samples (>1 cm), microwave radiation has been recently suggested as an alternative heating source. This unique method can locally raise the temperature of the nanocomposite after the saturation process to design the microcellular specimens more safely [Citation43–46]. The carbonaceous fillers can act as microwave radiation absorbers and local hot spots to heterogeneously create nucleation sites. To conclude, a fine-cellular structure with a high expansion ratio and uniform cell size, even in the thick samples, is achievable via microwave heating [Citation47] due to its advantages over the conventional methods, including (I) quick heating; (II) selective material heating; (III) volumetric heating; (IV) controllable start-up and stopping; (V) higher level of safety and automation [Citation46]. The microwave heating mechanism depends on the properties of the target and absorber materials and their interaction with microwaves [Citation48]. Since most polymers are, to some extent, transparent to the microwaves, it is necessary to disperse conductive additives to increase the polymeric matrix’s temperature by microwave radiation [Citation45]. Carbon-based additives have attracted significant interest not only because of their excellent mechanical, thermal, and electrical properties but also because of their strong microwave absorbance [Citation49–51]. The interfacial polarization mechanism – called Maxwell-Wagner-Sillars (MWS) – is the reason for converting microwave radiation into heat. Moreover, Joule heating also plays a significant role in heating such materials by microwave, owing to delocalized π-electrons in the graphitic structure [Citation52].
The microwave heating (MA) of materials containing carbon nanotubes (CNT), graphene (G), and carbon black (CB) has been investigated in countless studies [Citation45,Citation53,Citation54]. Based on the previous research, the heating rate of carbon-based nanocomposites has directly correlated with electrical properties. Galindo et al. [Citation55], for example, discussed the microwave absorption performance of multiwall carbon nanotubes (MWCNT) and multilayer graphene (MLG) nanosheet as the additives in polypropylene (PP) at the frequency of 5.8 GHz. The outcomes revealed that the conversion rate of radiation to heat for MWCNT nanocomposites was more significant than that for MLG samples. Noteworthy, the heating behavior of nanocomposites containing 0.5 wt % MWCNT was similar to the samples with 10 wt % MLG because the higher mobility of electrons and dipole rotation in MWCNT is able to absorb more electromagnetic radiations. Eventually, the best electrical conductivity is recorded for composites containing 5 wt % filler (2.3 × 10⁻⁶ S/m for PP/MLG and 2.2 × 10⁻³ S/m for PP/MWCNT). The comparison study on the electrical properties of glass fiber/epoxy composites filled with MWCNTs, thermally exfoliated graphene (XG), and graphene was performed by A. Khurram et al. [Citation56]. The higher electrical conductivity was seen in G nanocomposites compared to XG and G/XG/MWCNTs nanocomposites. Unfortunately, microwave absorber characteristics remained obscure in this work. In addition, the percolation threshold, as an influential parameter in heat production, has an inverse relation to the aspect ratio of filler. Hence, it is expected that CNTs with an aspect ratio>100 indicate a significantly lower threshold than CB with an aspect ratio = 1. As a result, in the exact percentages, CNT nanocomposites showed a higher rate of absorption than CB [Citation45]. In the last decades, due to the superior electrical properties of nanofillers especially carbonic nanoparticles, numerous studies have been conducted on their application in EMI shielding performance [Citation57–63]. Wang et al. [Citation64] produced high flexible and heat-resistant carbon nanotube/graphene/polyimide(PI) foam for shielding applications. They found that hierarchical 3D structures of CNT/G/PI and cellular structure resulted in high flexibility and superior microwave absorption with a reflection loss of −32 dB.
The aim of the present work is defined by investigating the effect of carbon-based fillers on PS foam’s morphology and properties. PS has been chosen as a matrix due to its importance in the foam industries, easy foaming process, and non-crystal structure. Accordingly, three families of carbonaceous nanocomposites (CB, CNTs, and Gs) were incorporated with PS matrix and foamed by microwave heating operation to study: I) their efficiency of microwave absorption, II) effect of their performances, shapes, dispersion on the different stages of foaming and final cellular morphology, III) correlation between radiation time and cell size, cell distribution, cell density, and foam density, and IV) impact of cell morphology on electrical conductivity and EMI shielding. Plus, the microwave foaming procedure has been monitored to show a moment-to-moment change. In the case of high aspect ratio fillers (CNTs, and Gs), most properties were remarkable, and their mechanism was similar. In contrast, CB/PS foams’ properties were beneath two others. We hope such notable developments in adjusting radiation time and its effect on electrical behavior and microcellular structure of these foam materials can broaden new horizons.
2. Experiments
2.1. Materials
Polystyrene (PS GPPS1460) granules were supplied by Tabriz petrochemical company (T.P.C) with a melt flow index (MFI) of 6.5 g/10 min (200°C-5 KG, ASTM D-1238 test method). CB from Orion Ex: Evonik Degussa, with trade-mark Printex V, few-layered Graphene nanosheets (N002-PDR) from Angstron Materials, and CNT (NC7000) from NanocylTM, Belgium were used as the microwave absorber particles. CO2 with a purity of 99.95% was used as a physical foaming agent, and tetrahydrofuran (THF) was purchased from Carlo Erba as the solvent.
2.2. Methods
2.2.1. Preparation of nanocomposites
The masterbatch-melt blending technique was chosen to prepare PS composites [Citation65]. At the first stage, 5 wt. % Masterbatch of PS/CNT, PS/G, and PS/CB composites were prepared to produce final 0.5 and 1 wt % composites by diluting them. For this purpose, ultrasonication provided a stable suspension of each carbonaceous particle in THF and then mixed with PS/THF solution. After mixing mechanically by stirring for 2 h, the solution is dropped into a large volume of water to coagulate the PS composites. For filtering and drying, it has been kept in a circulating oven at 80°C for 10 h, followed by drying in a vacuum oven at 80°C for 24 h. The dried masterbatch was melt-blended and eventually diluted to various final filler concentrations using a Brabender mixer at 180°C with a rotor speed of 80 rpm for 8 min. The resulting nanocomposites were then hot-pressed into disk bars within 1.8 mm thickness and 25 mm diameter.
2.2.2. Foaming process
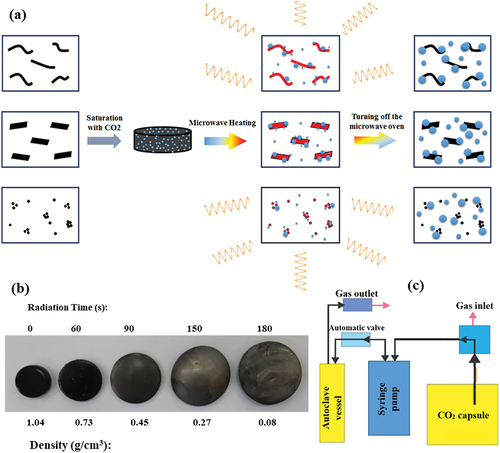
For producing foams, samples first were saturated with CO2 for 3 h in a high-pressure autoclave vessel (which contained a syringe pump to reach high pressures, as shown the schematic in ). A saturation pressure (170 bar) was applied at 35°C to dissolve CO2 in the composites. After the maturation process, the pressure was slowly released to the ambient. Afterward, after 1 min rest, saturated samples were put in the microwave oven (Samsung-ME201, 800 W, 2.45 GHz) and radiated at various times. For each foaming time, three different composites (PS/CNT, PS/G, and PS/CB) were placed on the polyethylene stand and then radiated simultaneously in the same run. Radiation power was chosen at 600 W for all foaming procedures. It should be mentioned that an experiment tested the transparency of the PS matrix to microwave. The saturated neat PS sample was irradiated with microwave energy for up to 4 minutes, and any expansion was not observed in the sample, yet in higher radiation times, neat PS was initiated to expand through the convection mechanism. So 210s maximum radiation time was chosen to minimize the convection mechanism effect.
2.3. Characteristics
Transmission electron microscopy (TEM) was assessed to observe the dispersion and distribution of the carbonaceous particles into the PS matrix via using a Zeiss-EM10C at an accelerating voltage of 100 kV. The densities of the composites and foams were measured via the water displacement method in accord with ASTM D792. Expansion ratio and porosity were calculated through Equationequations (1)(1)
(1) and (Equation2
(2)
(2) ), respectively, where ρs and ρf are the density of solid and foamed samples, respectively. The morphology of the foamed samples was observed with a SERON AIS-2100 scanning electron microscope (SEM). The samples were freeze-fractured in liquid nitrogen and sputter-coated with gold. Image processing software Image-J was used to measure the cell density and the average cell size [Citation66]. The cell density was calculated by the following equations [Citation67]:
Where n is the number of cells in the A area of the micrograph, the DC volume electrical conductivity of the samples was measured with a 4-probes KEITHLEY 610C electrometer (KEITHLEY Instruments Inc., Cleveland, Ohio). The sample surfaces were coated with gold to reduce the contact resistance between the electrodes and the sample. Three samples were tested for each composite and foam, and the average value was reported as a final result.
A vector network analyzer, Hewlett Packard 8410C (USA), was used to measure EMI SE over the frequency range of 8.2–12.4 GHz (X-band). LCR-meter from GW Instek was applied for measuring dielectric properties. The samples were cut into rectangle plates with a dimension of 22 × 11 mm2 to fit the waveguide sample holder. The thickness of the samples was about 2.5 mm. Also, the foamed samples were carefully cut to reach the same dimension.
3. Results and discussions
3.1. Dispersion and distribution of carbonaceous fillers into PS matrix
According to the fact that the equal distribution of carbonic fillers is an effective parameter to have uniform composite foams by microwave heating mechanism, the TEM of solid composites is projected to display the dispersion state of the nanoparticles in the PS matrix. illustrates the TEM micrographs of PS/carbonaceous nanocomposite containing 1 wt % carbon nanotube (CNT), graphene (G), and carbon black (CB) on two scales, 250 and 60 nm. Understandably, the proper level of CNT dispersion can be detectable, as shown in – it may be chiefly attributed to the convenient processing procedure that is used to prepare the PS nanocomposite. Also, the bundles and hollows shape of CNTs are evidently perceptive. The twisted lateral shape of G platelets is manifestly depicted in . Despite those being blurred, these platelets are more apparent on a large scale (60 nm). obviously represents numerous agglomerates of CB particles distributed within the PS matrix. It is challenging to observe continuous networks of CB aggregates because there is strong filler–filler interaction between these spherical fillers that cause the creation of the aggregates and agglomerates separately [Citation54].
Figure 1. TEM micrographs of the composites in two different scales: a) PS/CNT1, b) PS/G1, and c) PS/CB1.
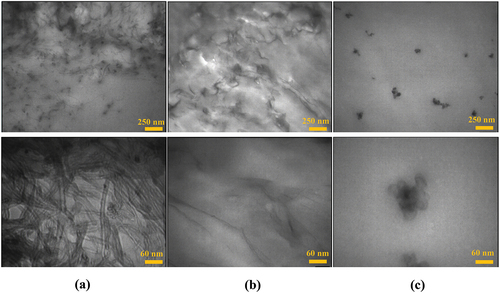
Figure 2. (a). Schematic of microwave-assisted foaming procedure, and (b) PS/G1 foamed samples in various radiation times, (c) schematic of the gas foaming procedure.
3.2. The effect of filler type and content on the solubility of CO2
The shape, size, surface property, and concentration of fillers affect CO2 solubility and diffusivity in polymer composites. Hence, as the main parameters in the foaming of nanocomposites, we examined the effect of filler type and concentration on the solubility of CO2 in PS carbonaceous particle nanocomposites. Gas solubility as a function of filler concentration is elucidated for various carbonic filler types via the weight measurement of saturated nanocomposites precisely after the saturation process. The weight measurement was performed via a laboratory scale with an accuracy of a 4-decimal scale before and after the saturation process. Each sample was measured three times with average values. From , it is evident that PS/G nanocomposites have slightly higher CO2 sorption, followed by PS/CNT and PS/CB nanocomposites. The higher absorbability in composites containing graphene nano-pellets could be attributed to the greater surface area of graphene, which provides higher CO2-philic functional groups on its surface that absorb more gas molecules during the saturating process. Also, the pellet-like shape of graphene provides excellent gas barrier properties resulting in hindering gas escape during depressurization, which could be considered another reason for higher gas absorption in PS/G composites. As expected, it is also illustrated that the solubility of CO2 in the composites increased with increasing filler loading. These results are considered the advantage of carbonaceous utilization in foaming procedures that can improve foamability due to the heterogeneous cell nucleation and enhance gas absorption during the saturating process.
Table 1. Solubility of CO2 in produced nanocomposites.
3.3. Decoding density of nanocomposite foams
3.3.1. The effect of radiation time
The mechanism of microwave-assisted foaming is illustrated in . The interior temperature has increased due to microwave absorption via conductive nanoparticles by increasing the radiation time. After that, the matrix near the absorber particles reached the softening point, and the initial stage of nucleation had gotten into operation. The dissolved CO2 in the bubbles was diffused in the following, so cell growth was being progressed and full-fledged. As a result, the foam density has been decreased by increasing the microwave radiation time due to the growth of the nucleated cells (). This descending trend in density, however, is directly related to (and tightly depends on) the type and the amount of the absorbing fillers. These absorbed microwaves, which were converted into heat energy, are capable of determining the expansion ratio of foam composites – this ability is more convenient for this comparative study due to its more controllable and monitorable rather than traditional foaming.
represents the density of the foamed samples as a function of microwave radiation time. Regarding the plot, composites, including CNTs, were more susceptive to the microwaves and reached the minimum density in a shorter time than the Gs and CBs counterparts. PS/CNT1 composite in the 60s reached the minimum density with the stabilized cellular structure and maintained a maximum expansion ratio. As expected, the composites with lower incorporate weak force between cells of CNTs (0.5 wt %) required higher radiation time to reach the same density as the 1 wt % PS/CNT nanocomposite. When there was more absorber, the required time to reach the higher expansion ratio was reduced, so the reason for longer radiation time to attain stable structure in PS/CNT 0.5 wt % could be attributed to the fewer absorber hot-spots, coming from the lower number of electrically conductive particles. By incorporating more CNT, on the other hand, the more energy absorbed in the composites at the same radiation time and the number of nucleated cells increased, as well as cell growth could be completed in shorter time.
Figure 3. The density of microwave-assisted foam composites containing various types of fillers as a function of radiation time.
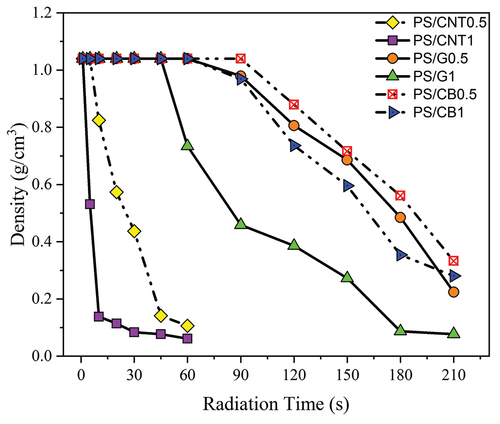
The PS/G composites were foamed in the higher radiation times than PS/CNT composites, which was attributed to the higher reflection of microwaves, lower electrical conductivity (which will be discussed later) as well as lower radiation to heat conversion ability of graphene nanosheets [Citation55]. PS/G1 composite reached a density of 0.07 g/cm3 at 210 s radiation time, which was close to the final density of PS/CNT – the required time of PS/G1 was approximately triple of PS/CNT1. However, cell nucleation started in the higher radiation times in the presence of 0.5 wt. % of Gs, and the density reduction rate was much smoother than the PS/G1. For instance, at 150 s radiation time, the PS/G1 and PS/G0.5 were reached the density of 0.27 g/cm3 and 0.68 g/cm3, respectively; however, after radiating the mentioned samples for 180 s, the PS/G1 and PS/G0.5 were reached to the density of 0.08 g/cm3 and 0.48 g/cm3, which are expanded 3.3 and 1.4 times respectively, as compared to foams produced at 150 s. In addition, the maximum expansion was not achieved prior to 210 s in PS/G0.5 (the maximum time in which the convection heating mechanism did not have an influence on the heating). It is clear that the effect of the absorber particle concentration is more pronounced in the PS/G composite. To better clarify this fact, at the radiation time of 120 s, PS/G1 reached a density of 0.38 g/cm3; however, the PS/G0.5 only reached a density of 0.8 g/cm3. It is worth noting that the effect of filler concentration was not noticeable on the PS/CNT and PS/CB composites as much as on PS/G. Therefore, the impact of a higher G surface area, which provides a large number of absorber spots with increasing the G amount, could not be ruled out.
Carbon black foam composites had a lower ability to absorb the microwaves than composites incorporated with CNTs and Gs. Furthermore, the proximity of PS/CB0.5 to PS/CB1 density charts exhibited that increasing the CB composition did not remarkably affect the microwave absorption rate. Also, PS/CB1 and PS/CB0.5 composites reached a density of 0.28 and 0.33 g/cm3 in the maximum radiation time, respectively – notably denser than the CNT and G counterparts. Compared with CNT and G, composites containing CB revealed lower electrical conductivity, which has had a much higher percolation threshold and much lower tanδ because of their spherical shape. These have resulted in weaker microwave absorption, which produced lower and non-uniform heat.
3.2.2. The effect of radiation power
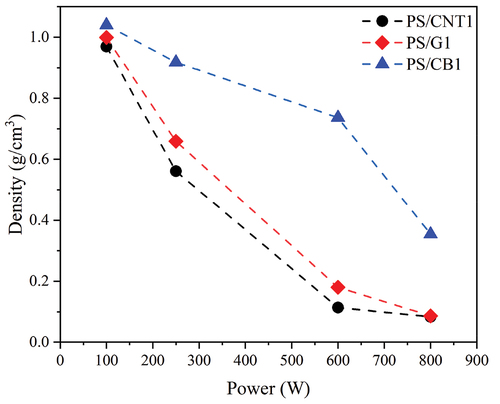
Increasing microwave power enhances the electromagnetic field, and dielectric loss, which is considered the main parameter for the produced energy in microwave heating, increases. As a result, the required heat for the foaming procedure increases. The density of foamed samples as a function of microwave radiation power is elucidated in for PS nanocomposites containing various filler types. The foaming radiation time for PS/CNT1 samples was 30s, and for PS/G1 and PS/CB1, 180 s was chosen. As shown in , the density of foams is reduced for all types of carbonaceous nanocomposites by increasing the radiation power. For instance, the density of PS/CNT1, PS/G1, and PS/CB1 foams that were produced via 250 W microwave power was 0.56, 0.65, and 0.91 g/cm3, respectively, and reached 0.08, 0.08, and 0.35 g/cm3 by increasing the radiation power to 800 W at the same radiation time. By increasing the radiation power, cell nucleation and growth occurred in shorter times. So, it can be concluded that by increasing the radiation power, samples could reach the desired density in shorter times. However, in high radiation powers, the controllability over the foaming procedure is overshadowed.
Figure 4. The density of microwave-assisted foams containing various types of fillers as a function of radiation power.
To conclude, due to the exemplary microwave absorption behavior of CNTs, manipulation of the PS/CNT foaming process was challenging. It witnessed a high level of loss factor in nanotubes and the higher mobility of CNTs’ electrons than that of the Gs and CBs.
3.4. Monitoring foam nanocomposite’s microstructure during microwave foaming
To investigate the effect of microwave heating on the cellular morphology, the cross-sectional SEM micrographs of the foamed PS/CNT1, PS/G1, and PS/CB1 nanocomposites versus different radiation times are depicted in , respectively. It is evident that the cell growth for all kinds of nanocomposites could be precisely adjusted by the radiation time. Since the conductive nanoparticles are responsible for raising the sample’s temperature, the well-dispersed nanoparticles induce uniform heating without any gradient temperature in specimens’ thickness. As cells initiate to nucleate and grow in the surrounding particles, we could control average cell size and cell density by controlling the radiation time.
Figure 5. SEM micrographs and cell size distribution of microwave-assisted PS/CNT1 foams created at various radiation times.
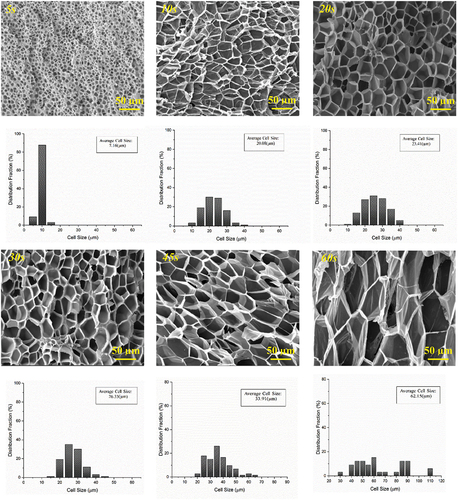
Figure 6. SEM micrographs and cell size distribution of microwave-assisted PS/G1 foams created at various radiation times.
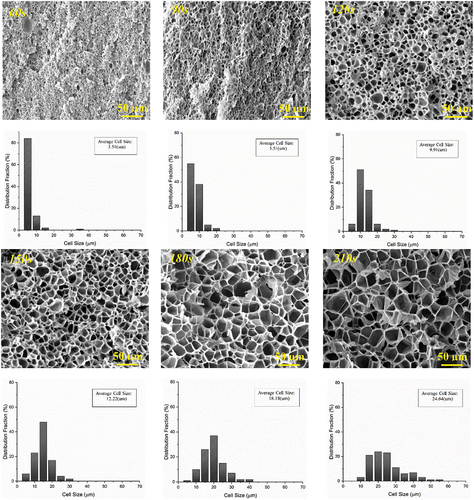
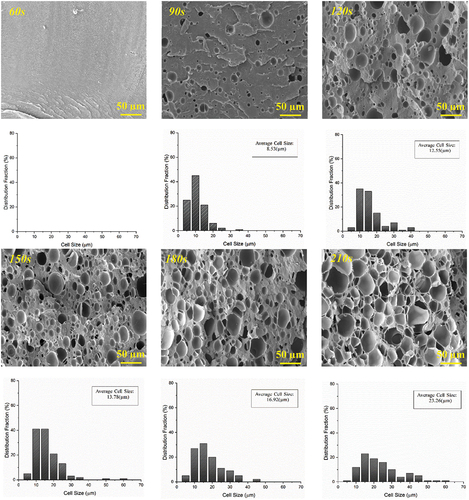
Figure 7. SEM micrographs and cell size distribution of microwave-assisted PS/CB1 foams created at various radiation times.
As earlier mentioned, the PS/CNT composite started cell formation in much shorter radiation times. Only by applying 5s microwave energy, PS/CNT1 composite was able to shape a fine-cellular structure with an average cell size of 7.16 µm and a cell density of 5.39 × 10⁹. In the lowest degree of foaming – the shortest radiation time that induced porous morphology in each kind of composite – PS/G1 foam produced in 60s radiation time () exhibited cellular morphology with the highest cell density and smallest cell size in comparison with PS/CNT1 foam with the same expansion ratio. This proper structure could come from the lower-yielding of graphene nanosheets in converting microwave into heat compared with carbon nanotubes, increasing the temperature in a shorter time.
Correspondingly, the presence of G nanosheets with an excellent surface area inhibits the cell growth rate. For more clarification, G nanoparticles could improve melt strength more than the other counterparts. So, superior restraining cell coalescence and hindering gas escape during the foaming process were accomplished by the platelet-like G nanoparticles with a higher aspect ratio; therefore, deliberated growths and higher controllability could be attained via incorporating graphene nanosheets.
The cellular morphology of PS/CB1 as a function of radiation time was recorded (see ). It is evident that carbon black (CB) particles need higher radiation time to gain the required heat for cell nucleation and growth. According to the SEM images, PS/CB1 not only started foaming in higher radiation times but also accompanied a non-uniform distributed nucleus. As expected, cell size and density have been increased by passing the radiation time. Noteworthy, in the following stages (150 s, 180 s, and 210 s), the cell nucleating was being progressed and advanced nuclei that were produced before, were also continuing their growth. Consequently, in the composites incorporated with CB particles, the absorbed electromagnetic waves embraced both cell nucleation and growth simultaneously, even in higher radiation times.
As a comparison, the average cell size and cell density of composite incorporated with all three types of carbonaceous nanoparticles against radiation time were reported in – including complement characteristics of all the foams for more elucidation. According to the distribution-cell size values, there is considerable uniformity in the cell size distribution of PS/CNT1 foams rather than PS/G1, and also, PS/CB1 is the worst one. On the basis of these results, which are determined as a nanoscale heating system, it could be claimed that the dispersion, distribution, and geometry of the fillers play dominant roles in the uniformity and cell size distribution. In the PS/G1 foams’ SEM micrographs, some large cells are observable among the usual ones, especially in the early stage of foaming, which could be attributed to some G aggregates with higher temperature due to absorption of more microwaves. As mentioned before, graphene nanosheets might augment melt strength and restrain the cell walls more than CNTs and CBs. As a result, in comparing with PS/CNT foams, in the higher foaming times, the cell size of PS/G1 foams is smaller and more uniform which was absolutely more appropriate.
Table 2. Characteristics of the microwave-assisted foams.
3.5. Electrical properties and total EMI shielding performance
Conductive carbon nanoparticles are vastly used in favor of their high electrical and thermal conductivity. Foaming affects the final transport properties because it leads to the filler interconnectivity that may be altered by introducing cellular structure. As a rule of thumb, due to creating cellular morphology into the carbonaceous composites, the electrical conductivity has been altered [Citation21,Citation68]. If electrical conductivity has an upward trend, it has resulted from the alignment and interconnection of conductive particles (formation of filler network) during cell growth and volume exclusion by voids, leading to the localization of nanoparticles within the cell walls. On the other hand, in some cases, the existence of porous structures can act as obstacles to electron travel and increase the distance of adjacent nanoparticles; therefore, the final electrical conductivity showed a descending trend [Citation69–72].
depicts the volume DC electrical conductivity of solid composites as a function of filler content. PS is an approved material for electrical insulating due to its low electrical conductivity, i.e. 1.69 × 10⁻¹⁴ S/cm. In general, the addition of carbonaceous filler increased the chance of electron transforming via creating an integrated network and the volume electrical conductivity. Undoubtedly, the aspect ratio of the incorporating fillers, as well as the dispersion state, plays a significant role in the formation of a conductive filler network, accordingly conductive composite. However, graphene nanosheet has the largest aspect ratio and potentially must show a higher conductivity; PS/CNT composites were founded as the more conductive ones. Therefore, the role of alignment and intrinsic filler–filler conductivity is dominated; hence, the conductivity of PS/CNT was greater than PS/G and PS/CB. As it could be seen, for each kind of composite contained a different kind of filler, incorporation of 1 wt % carbonic filler altered the mediocre electrical conductivity, but in foam samples, this behavior could be different and more intricate. In the first part of this study, microwave-assisted foaming was investigated regarding the type of fillers and radiating duration. To do so, a comparison study was conducted microstructurally on the constant same filler content of 1 wt %. In order to review, PS/CNT composites with higher particle concentrations have an intense dependency on the microwaves and showed a lack of desirable ability to control the sample’s temperature. Thus, in higher loading of them, the processing window becomes narrow, which leads to difficulties in the foaming process. To sum up, composites incorporated with 1 wt % carbonaceous particle were foamed to examine the effect of cellular morphology on the electrical properties in different radiation times, and also their conductivity was assessed.
Figure 8. (a) Electrical conductivity of the solid composites in different filler content. Electrical conductivity of (b) PS/CNT1, (b) PS/G1, and (c) PS/CB1 foams was produced in various radiation times as a function of cell size and final filler content.
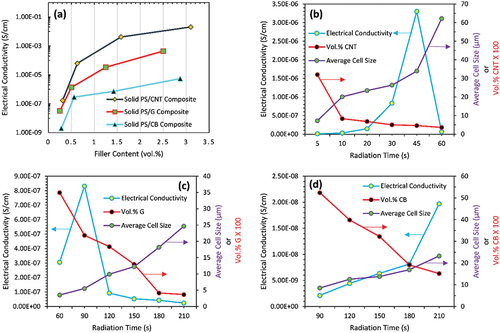
According to volume exclusion after the foaming process, the expansion ratio has firmly impacted the final filler’s volume content. In other words, the filler volume fraction has a radical change by altering the radiation time and expanding the composites. As a result, the electrical conductivities were calculated as a function of volume fraction concerning total volume. The influence of cellular structure on the electrical conductivity of composites was examined, and the results are depicted in . Also, the budding of bubbles rearranges the filler’s orientation and adjusts filler-filler interconnectivity, which has a detrimental impact on the electrical conductivity of samples. The degree of CNT orientation is also affected by the position of CNTs in the polymer matrix (). When a cell reaches a certain size, the fillers at the cell boundary become tangential to the cell walls and immediately enter this steady-state (perpendicular direction). However, the degree of orientation is poor for fillers located far away, so the fillers would not orient unless cell growth meaningfully. However, after the cell sizes had expanded dramatically (in the first moment of foaming), the filler structure did change significantly, so the increment in EC was prominent. The orientation of CNTs, henceforth, did change vividly as the cell size was increased because they were displaced in a radial motion direction. As a result, increasing the cell size had a positive effect on the electrical conductivity overall. At the end of the foaming process, the uniform filler orientation and microcellular structure have been damaged; having said that though, EC for PS/CNT foam that included the largest average cell size has plummeted.
In general, the microstructure is firmly connected to the electrical conductivity. Numerous experiments have shown that adding microcellular structure to polymer/carbonaceous filler nanocomposites would affect their electrical conductivity. Readers would be puzzled by the conflicting assumptions that the addition of a cellular structure could increase or decrease the EC. For different PS/CNT nanocomposite foams, shows the relationship between electrical conductivity and foaming degree. As mentioned earlier, there is an almost ascending trend in EC as cell size increases. In contrast, as the degree of foaming increased from 94% (34 μm cell size) to 96% (62 μm cell size), the electrical conductivity of PS/CNT decreased (). The bonds formed by the affinity of the CNT fillers are thought to be disrupted by foaming action, resulting in a decrease in EC, which results from the high cell-to-cell pressure force causing adjacent CNTs to break far apart.
For the PS/G nanocomposite foams (), on the other hand, the EC variation was broad, and the propensity of EC variation was different. The peak is observable for EC value in PS/G foams, like PS/CNT foams, while the EC steadily increased for PS/CB with an augmentation in radiation time, as shown in . It reveals that the same mechanism happened for PS/G and PS/CNT, but it is absent in PS/CB. In other words, it could be claimed that the conductive networks of filler (intrinsic filler feature) are able to determine electrical properties. Noteworthy, the role of microcellular structure in filler-network is inevitable. G and CNT can produce more heat under microwave-assisting, so PS/CNT and PS/G show an elegant cellular shape rather than PS/CB foams. This phenomenon causes disturbing the PS/CB cellular pattern as well as deleting critical value (a peak) in PS/CB conductive network.
The elucidation is that the small cells play a marginal role in splitting conductive filler at a lower foaming level. In most polymer nanocomposites, the EC takes place either through direct ‘contacts’ between the conductive fillers or through ‘tunneling’ of electrons between relatively near conductive particles. In the first example, the conductive fillers mechanically bind to form a conductive network, allowing electrons to travel freely as they might in a traditional naturally conducting material. However, in the ‘tunneling’ model, electrons would be in the point-of-fact tunnel between two sufficiently near conductive fillers, which can be isolated by a film made of macromolecule polymer material. The very near distance between neighboring carbonic conductive filler leads to the EC in the PS/CNT and PS/G – at 45 and 90s radiation time, respectively – nanocomposite foams with comparatively moderate cell size. Based on the aforementioned findings, it can be inferred that as the degree of foaming increased up to the critical value (35 μm cell size for PS/CNT and 8 μm cell size for PS/G), the EC increased, and as the samples have expanded more, the EC decreased. As a result, the tendency for EC to decrease would flatten, and the degree of foaming could be easily regulated by tuning it. reveals the electrical conductivity of foam composites at different radiation times. To the best of our knowledge, electrical conductivity is a crucial parameter for EMI shielding efficiency because it is an intrinsic ability of the material to absorb electromagnetic radiation [Citation73]. The carbonaceous nanocomposite foams are to show an essential combination of lightness and EMI shielding efficiency. Unquestionably, EMI shielding directly depends on the final foam morphology, as well as on the electrical conductivity [Citation30]. The overall EMI SE was calculated based on the S-parameters as follows at the X-band (8–12 GHz):
Table 3. Summary of electrical conductivity of the foam composites.
where |Sij|2 represents the power transmitted from port i to port j. As expected before, in solid composites (2.5 mm thick plates), when the filler type was constant, the EMI SE increases with the enhancement of nanofiller content (). For instance, The EMI SE of the PS/CNT, PS/G, and PS/CB solid composites increased from 1.9 to 14.4 dB, 1.1 to 12.6 dB, and 0.8 to 6.4 dB, respectively, with increasing filler concentration from 1 to 5 wt. %. On the other hand, the EMI SE of CNT-based nanocomposite at the same nanofiller loading is significantly higher than that of G and CB-based composites. This trend forcefully could be attributed to the higher electrical conductivity of the PS/CNT composites followed by PS/G and PS/CB composites.
Figure 9. EMI SE of the solid composites (a), PS/CNT1 (b), PS/CNT1 (c), and PS/CNT1 (d), foams as a function of cell size at a different frequency.
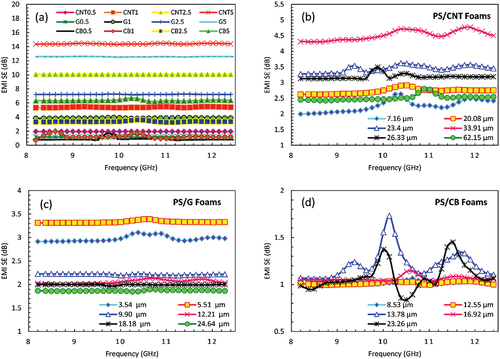
As a rule of thumb, the EMI shielding properties are nearly linearly related to the electrical conductivity. As approved earlier by the above results, the cellular microstructure can effectively change the electrical conductivity, further affecting the EMI shielding efficiency. In , the fundamental EMI SE values are plotted as a function of cell size to illustrate the direct relationship between the foaming-degree and the EMI shielding properties. Also, this figure represents the superior efficiency of foamed materials in microwave shielding applications. The specific EMI shielding efficiency was calculated on the basis of the rate of total EMI shielding efficiency and the sample density, and the results are shown in . As mentioned above, owing to the duration of radiation time, density was controllable in the foamed samples. Indeed, foamed samples revealed that much higher specific shielding effectiveness contributed to the much lower density in comparison with solid ones. In , the specific EMI SE of PS/CNT1 foams increased from 3.9 to 57.4 dB/(g/ cm3) by increasing radiation time from 5 to 45s, after which decreased to 40 for the foam with the highest expansion (cell size = 62.1 µm) – it had lower conductivity than the foam with lower cell size (33.9 µm). As a reminder, according to the conductivity against cell size and final filler content, the electrical conductivity of the foams reached its maximum at the foam with a cell size of 33.9 µm, which had a final filler content of 0.046 vol.%. Based on , PS/G1 and PS/CB1 foams also showed a similar pattern; for instance, by having passed radiation time from 60 to 210s, specific EMI SE increased from 4 to 24.2 dB/(g/ cm3) and 1.1 to 3.6 dB/(g/ cm3) for PS/G1 and PS/CB1, respectively. It should be noted that PS/CB1 has much lower electrical conductivity, which has resulted in lower EMI performance.
The electrical conductivity and EMI shielding properties were reported as a function of the degree of foaming in to provide a guide to modeling desired properties in the future by adjusting the foaming degree of nanocomposite foams. To sum up, if composite were more conductive, it would have better ability in EMI performance. Hence, all the EMI results at 9 GHz are depicted in . It should be noted that increasing the electrical conductivity tuned by the degree of foaming increased the specific EMI SE significantly – due to a dwindling in weight – whereas the EMI SE remained much higher in solid composites (). Composite foams with superior specific EMI shielding properties, a high EC, and a relatively high density (low degree of foaming) were easily obtained at PS/CNT samples owing to shaping a conductive network. Specific EMI SE values improved dramatically as the degree of foaming (i.e. EC) increased, and PS/CNT/0.046 vol.% foam had the most robust EMI shielding properties – this phenomenon is consistent with the electrical conductivity’s pattern.
As is clearly shown, the PS/G foams exhibited a little lower EMI performance (). A different primary mechanism could mention: if graphene-based composites want to amend their electrical properties, we should induce an overlapping between these carbonic sheets. So, we must embed a considerable amount of filler into the matrix; otherwise, by foaming, they would be far from reach. In this work, due to studying the effect of these carbonic fillers on electrical behavior, the filler content has remained low, especially in foam samples. Despite that, PS/G samples showed better ability rather than PS/CB foams () – it could magnify the role of the filler’s intrinsic features and shape. Based on results, it could be acclaimed that CNT fillers are more interested in teaming up together and making a conductive monolithic network. Also, Graphene nanosheets keep them away from the hustle and bustle, and CB particles are solitary; therefore, they make their empire in higher filler loading.
Exclusively about carbonic materials and their network inside the foam, EM microwaves are dispersed in the foam and also reflected inside it to discharge the EM energy due to cell life [Citation74,Citation75]. The leading CNT and Graphene were the backbone for migration and hopping and the fast transport of electrons. Where the EM wave extends into the surface of the absorber, multiple electrons in the carbonaceous filler may pass in the axial or hop direction. The especially interconnected infrastructure could develop a 3D driving network that could promote interfacial polarization and drive failure. This is called the Maxwell-Wagner effect, which captures mobile charges between the insulator interface or driver interface. The interface polarization caused by EM waves places a key role in EM dissipation, owing to many content interphases such as the CNT-PS and the CNT-air – the strongest and most prominent ones among samples in this study.
For further clarification of the effect of foaming degree on electromagnetic properties, the dielectric constant of foams produced in various radiation times is tabulated at a frequency of 100 Hz in . The dielectric constant (k) is the material’s ability to store an electrical charge during applying an electric field [Citation22]. It was proven that the dielectric constant is directly affected by the microstructure of materials. The chief role of the dielectric constant parameter is filler-filler distance. Hence, the k has decreased as the expansion ratio increases. In other words, the filler volume and k showed the same pattern. For PS/CNT foams, the dielectric constant decreased from 25.2 to 9.8 by surging radiation time. On the other hand, the reduction in dielectric constant was carried out due to the rearranging of the orientation on nanotubes and also hindering by bubbles.
For the PS/G nanocomposite foams, in relatively the same filler volume fraction, the dielectric constant reached the maximum of 19.2 and then reduced to 10.6. PS/G foams, in comparison with the PS/CNT foams, experienced a little lower dielectric constant that is related to the intrinsic feature of filler (follow up this discussion herein [Citation2,Citation76]). As the expansion ratio was increased, the graphene particles would become more perpendicular to the radial direction as PS/CNT. Consequently, the graphene nano-pellets became more parallel with respect to each other regardless of the initial orientation [Citation77]; it caused declining the amount of EMI SE (dB) in PS/G nanocomposite foams rather than PS/CNT ones. Furthermore, the PS/CB foams had a much lower dielectric constant, attributed to lower electrical conductivity resulting from poor filler–filler adjustment and network formation and weaker electrical conductivity of CBs with a zero-aspect ratio.
4. Conclusions
This research aimed to systematically investigate the role of microwave foaming on microcellular and electrical properties of polymeric foam nanocomposites. As being conductive filler is essential in this foam processing, diverse carbonic filler (CB, CNT, and Graphene) was considered the most prevalent particles in an industrial and scientific society, and their function in PS foam composites was studied thereafter. An amorphous PS matrix was chosen to ensure the formation of foaming does not have been influenced by crystallinity; thus, controllable foaming procedures were introduced to manufacture and record all of the process steps.
Results showed that in the case of PS/CNT foams with different porous nature, expansion, and density, the presence of CNT particles with more ability to convert microwave to heat causes a rapid decrease in density and a swift increase in expansion in comparison with other samples (PS/G and PS/CB foams). The intensity of this phenomenon depends on the intrinsic properties of filler, filler size, and volume %, and it is more outstanding in CNT-based foam composite containing 1 wt %. However, in the case of PS/G with a highly microcellular structure, the presence of a low fraction of carbonic platelets causes the creation of a proper porous structure along with the applied microwave assisting-time for three times higher than PS/CNT. Moreover, not only the average cell size of PS/CNT foam was three times higher than other samples, but also the expansion ratio of PS/CB and was PS/G one-sixth and one-second of PS/CNT, respectively. Electrical conductivity has been increased as filler content is raised; however, PS/CNT displayed the highest conductivity with the same volume fractions. Remarkably, this trend was not stable, and at a high expansion ratio, the EC of PS/CNT has lessened, so there is an optimized point in foaming degree. Ultimately, the best total EMI shielding value has been calculated for PS/CNT sample. To conclude, the type of filler has significant effects on the cellular structure and properties of PS foam composites produced by the microwave-assisted method and on final electrical properties, which is a function of filler content and nature.
Acknowledgments
This work was financially supported by the National Natural Science Foundation of China (Grant No. 51703083).
Disclosure statement
No potential conflict of interest was reported by the author(s).
Additional information
Funding
References
- Aghvami-Panah M, Panahi-Sarmad M, Seraji AA, et al. LDPE/MWCNT and LDPE/MWCNT/UHMWPE self-reinforced fiber-composite foams prepared via supercritical CO2: a microstructure-engineering property perspective. J Supercrit Fluids. 2021;174:105248.
- Panahi-Sarmad M, Noroozi M, and Xiao X, et al. Recent advances in graphene-based polymer nanocomposites and foams for electromagnetic interference shielding applications. Ind Eng Chem Res. 2022; 61: 4 ;acs.iecr.1c04116.
- Xiao X, Huang X, Wang A, et al. Subtle devising of electro-induced shape memory behavior for cellulose/graphene aerogel nanocomposite. Carbohydr Polym. 2022;281:119042.
- Zhang D, Sun M, Liu X, et al. Off-axis bending behaviors and failure characterization of 3D woven composites. Compos Struct. 2019;208:45–55.
- Seraji AA, Aghvami-Panah M, Shams-Ghahfarokhi F. Evaluation of ultimate engineering properties of polytetrafluoroethylene/carbon-aerogel/glass fiber porous composite. Colloids Surf A Physicochem Eng Asp. 2022;647:128975.
- Cai J, Murugadoss V, Jiang J, et al. Waterborne polyurethane and its nanocomposites: a mini-review for anti-corrosion coating, flame retardancy, and biomedical applications. Adv Compos Hybrid Mater. 2022;1–10.doi:10.1007/s42114-022-00460-z.
- Jing X, Li Y, and Zhu J, et al. Improving thermal conductivity of polyethylene/polypropylene by styrene-ethylene-propylene-styrene wrapping hexagonal boron nitride at the phase interface. Adv Compos Hybrid Mater. 2022 5 ;1–10.
- Stephen C, Shivamurthy B, Mohan M, et al. Low velocity impact behavior of fabric reinforced polymer composites–A review. Eng Sci. 2022;18:75–97.
- Luo J, Yin D, Yu K, et al. Facile fabrication of PBS/CNTs nanocomposite foam for electromagnetic interference shielding. Chem Phys Chem. 2022;23(4). doi:10.1002/cphc.202100778
- Li S, Dong K, Li R, et al. Capacitive pressure sensor inlaid a porous dielectric layer of superelastic polydimethylsiloxane in conductive fabrics for detection of human motions. Sens Actuators A Phys. 2020;312:112106.
- Li S, Gu Y, Wu G, et al. A flexible piezoresistive sensor with highly elastic weave pattern for motion detection. Smart Mater Struct. 2019;28(3):035020.
- Lin L, Wang L, Li B, et al. Dual conductive network enabled superhydrophobic and high performance strain sensors with outstanding electro-thermal performance and extremely high gauge factors. Chem Eng J. 2020;385:123391.
- Li S, Xiao X, Hu J, et al. Recent advances of carbon-based flexible strain sensors in physiological signal monitoring. ACS Appl Electron Mater. 2020;2(8):2282–2300.
- Gu J, Zhang X, Duan H, et al. A hygro-thermo-mechanical constitutive model for shape memory polymers filled with nano-carbon powder. Int J Smart Nano Mater. 2021;12(3):286–306.
- Wang P, Song T, Abo-Dief HM, et al. Effect of carbon nanotubes on the interface evolution and dielectric properties of polylactic acid/ethylene–vinyl acetate copolymer nanocomposites. Adv Compos Hybrid Mater 2022:00489.
- Chen L, Rende D, Schadler LS, et al. Polymer nanocomposite foams. J Mater Chem A. 2013;1(12):3837–3850.
- Xiao W, Liao X, Li S, et al. The distinctive nucleation of polystyrene composites with differently shaped carbon-based nanoparticles as nucleating agent in the supercritical CO 2 foaming process. Polym Int. 2018;67(11):1488–1501.
- Hung P, Lau KT, Guo Q, et al. Tailoring specific properties of polymer-based composites by using graphene and its associated compounds. Int J Smart Nano Mater. 2020;11(2):173–189.
- Wang M, Galpaya D, Lai ZB, et al. Surface functionalization on the thermal conductivity of graphene–polymer nanocomposites. Int J Smart Nano Mater. 2014;5(2):123–132.
- Okolieocha C, Beckert F, Herling M, et al. Preparation of microcellular low-density PMMA nanocomposite foams: influence of different fillers on the mechanical, rheological and cell morphological properties. Compos Sci Technol. 2015;118:108–116.
- Ameli A, Nofar M, Park CB. Polypropylene/carbon nanotube nano/microcellular structures with high dielectric permittivity, low dielectric loss, and low percolation threshold. Carbon. 2014;71:206–217.
- Shahbazi M, Aghvami‐Panah M, and Panahi‐Sarmad M, et al. Fabricating bimodal microcellular structure in polystyrene/carbon nanotube/glass‐fiber hybrid nanocomposite foam by microwave‐assisted heating: a proof‐of‐concept study. J Appl Polym Sci. 2022; 52125 .
- Wang Z, Yang X, Wang Q, et al. Epoxy resin nanocomposites reinforced with ionized liquid stabilized carbon nanotubes. Int J Smart Nano Mater. 2011;2(3):176–193.
- Kashi S, Gupta RK, Kao N, et al. Influence of graphene nanoplatelet incorporation and dispersion state on thermal, mechanical and electrical properties of biodegradable matrices. J Mater Sci Technol. 2018;34(6):1026–1034.
- Kuronuma Y, Takeda T, Shindo Y, et al. Electrical resistance-based strain sensing in carbon nanotube/polymer composites under tension: analytical modeling and experiments. Compos Sci Technol. 2012;72(14):1678–1682.
- Li S, Li R, Gonzalez O, et al. Highly sensitive and flexible piezoresistive sensor based on c-MWCNTs decorated TPU electrospun fibrous network for human motion detection. Compos Sci Technol. 2021;203:108617.
- Ameli A, Jung PU, Park CB. Electrical properties and electromagnetic interference shielding effectiveness of polypropylene/carbon fiber composite foams. Carbon N Y. 2013;60:379–391.
- Zhao B, Wang R, Li Y, et al. Dependence of electromagnetic interference shielding ability of conductive polymer composite foams with hydrophobic properties on cellular structure. J Mater Chem C. 2020;8(22):7401–7410.
- Zakiyan SE, Azizi H, Ghasemi I. Effect of cell morphology on electrical properties and electromagnetic interference shielding of graphene-poly(methyl methacrylate) microcellular foams. Compos Sci Technol. 2018;157:217–227.
- Panahi-Sarmad M, Noroozi M, Abrisham M, et al. A comprehensive review on carbon-based polymer nanocomposite foams as electromagnetic interference shields and piezoresistive sensors. ACS Appl Electron Mater. 2020;2(8):2318–2350.
- Lee S-T, and Park CB. Foam extrusion: principles and practice. Routledge: CRC press; 2014.
- Lee LJ, Zeng C, Cao X, et al. Polymer nanocomposite foams. Compos Sci Technol. 2005;65:2344–2363.
- Feng JJ, Bertelo CA. Prediction of bubble growth and size distribution in polymer foaming based on a new heterogeneous nucleation model. J Rheol (N Y N Y). 2004;48(2):439–462.
- Sorrentino L, Aurilia M, Iannace S. Polymeric foams from high-performance thermoplastics. Adv Polym Technol. 2011;30(3):234–243.
- Matuana LM, Diaz CA. Study of cell nucleation in microcellular poly(lactic acid) foamed with supercritical CO 2 through a continuous-extrusion process. Ind Eng Chem Res. 2010;49(5):2186–2193.
- Park CB, Suh NP. Filamentary extrusion of microcellular polymers using a rapid decompressive element. Polym Eng Sci. 1996;36(1):34–48.
- Park CB, Baldwin DF, Suh NP. Effect of the pressure drop rate on cell nucleation in continuous processing of microcellular polymers. Polym Eng Sci. 1995;35(5):432–440.
- Drobny JG. Handbook of Thermoplastic Elastomers Second Edition. A volume in Plastics Design Library: Elsevier; 2014; 978-0-323-22136-8. https://doi.org/10.1016/C2013-0-00140-5
- Zhang H, Zhang G, Gao Q, et al. Electrically electromagnetic interference shielding microcellular composite foams with 3D hierarchical graphene-carbon nanotube hybrids. Compos Part A Appl Sci Manuf. 2020;130:105773.
- Zhao B, Zhao C, Hamidinejad M, et al. Incorporating a microcellular structure into PVDF/graphene–nanoplatelet composites to tune their electrical conductivity and electromagnetic interference shielding properties. J Mater Chem C. 2018;6(38):10292–10300.
- Zhi X, Liu J, Zhang H-B, et al. Simultaneous enhancements in electrical conductivity and toughness of selectively foamed polycarbonate/polystyrene/carbon nanotube microcellular foams. Compos Part B Eng. 2018;143:161–167.
- Hamidinejad M, Zhao B, Chu RKM, et al. Ultralight microcellular polymer-graphene nanoplatelet foams with enhanced dielectric performance. ACS Appl Mater Interfaces. 2018;10(23):19987–19998.
- Feng D, Liu P, Wang Q. Selective microwave sintering to prepare multifunctional poly (ether imide) bead foams based on segregated carbon nanotube conductive network. Ind Eng Chem Res. 2020;59(13):5838–5847.
- de la Hoz A, Diaz-Ortiz A, Moreno A. Microwaves in organic synthesis. Thermal and non-thermal microwave effects. Chem Soc Rev. 2005;34(2):164–178.
- Qin F, Brosseau C. A review and analysis of microwave absorption in polymer composites filled with carbonaceous particles. Appli Phy Rev. 2013: 061301.
- Menéndez JA, Arenillas A, Fidalgo B, et al. Microwave heating processes involving carbon materials. Fuel Process Technol. 2010;91(1):1–8.
- Rezvanpanah E, Ghaffarian Anbaran SR, Di Maio E. Carbon nanotubes in microwave foaming of thermoplastics. Carbon N Y. 2017;125:32–38.
- Rybakov KI, Semenov VE. Micromave heating of electrically conductive materials. Radiophys Quantum Electron. 2005;48(10–11):888–895
- Vazquez E, Prato M. Carbon nanotubes and microwaves : Interactions, responses, and applications. ACS Nano. 2009;3(12):3819–3824.
- Yan X, Liu J, Khan MA, et al. Efficient solvent-free microwave irradiation synthesis of highly conductive polypropylene nanocomposites with lowly loaded carbon nanotubes. ES Mater Manuf. 2020;9. 21–33.
- Wang R, Li S, Hu P, et al. Densification behavior and microstructure evolution of Mo manocrystals by microwave sintering. ES Mater Manuf. 2021;13:97–105.
- Kim KH, Cho KM, Kim DW, et al. The role of layer-controlled graphene for tunable microwave heating and its applications to the synthesis of inorganic thin films. ACS Appl Mater Interfaces. 2016;8(8):5556–5562.
- Qin F, Brosseau C. A review and analysis of microwave absorption in polymer composites filled with carbonaceous particles. Appl Phys. 2012;111(6):061301.
- Aghvami‐Panah M, Jamalpour S, Ghaffarian SR. Microwave‐assisted foaming of polystyrene filled with carbon black; effect of filler content on foamability. SPE Polym. 2021;2(1):86–94
- Galindo B, Benedito A, Gimenez E, et al. Comparative study between the microwave heating efficiency of carbon nanotubes versus multilayer graphene in polypropylene nanocomposites. Compos Part B Eng. 2016;98:330–338.
- Khurram AA, Rakha SA, Ali N, et al. Comparison of the dielectric response of hybrid polymer composites filled with one-dimensional and two-dimensional carbonaceous materials in the microwave range. Adv Polym Technol. 2018;37(3):890–897.
- Liang L, Li Q, Yan X, et al. Multifunctional magnetic Ti 3 C 2 T x MXene/graphene aerogel with superior electromagnetic wave absorption performance. ACS Nano. 2021;15(4):6622–6632.
- Zhang Y, Gu J. A perspective for developing polymer-based electromagnetic interference shielding composites. Nano-Micro Lett. 2022;14(1):89.
- Wang -Y-Y, Zhou Z-H, Zhu J-L, et al. Low-temperature carbonized carbon nanotube/cellulose aerogel for efficient microwave absorption. Compos Part B Eng. 2021;220:108985.
- Zhao B, Liang L, Bai Z, et al. Poly (vinylidene fluoride)/Cu@ Ni anchored reduced-graphene oxide composite films with folding movement to boost microwave absorption properties. ES Energy Environ. 2021;14:79–86.
- Pan D, Yang G, Abo-Dief HM, et al. Vertically aligned silicon carbide nanowires/boron nitride cellulose aerogel networks enhanced thermal conductivity and electromagnetic absorbing of epoxy composites. Nano-Micro Lett. 2022;14(7):209–227.
- Gao T, Rong H, and Mahmoud KH, et al. Iron/silicon carbide composites with tunable high-frequency magnetic and dielectric properties for potential electromagnetic wave absorption. Adv Compos Hybrid Mater. 2022; 5 ;1–10. https://doi.org/10.1007/s42114-022-00507-1
- Wang Y, Wang P, Du Z, et al. Electromagnetic interference shielding enhancement of poly(lactic acid)-based carbonaceous nanocomposites by poly(ethylene oxide)-assisted segregated structure: a comparative study of carbon nanotubes and graphene nanoplatelets. Adv Compos Hybrid Mater. 2022;5(1):209–219.
- Wang -Y-Y, Sun W-J, Dai K, et al. Flexible and heat-resistant carbon nanotube/graphene/polyimide foam for broadband microwave absorption. Compos Sci Technol. 2021;212:108848.
- Bao C, Song L, Wilkie CA, et al. Graphite oxide, graphene, and metal-loaded graphene for fire safety applications of polystyrene. J Mater Chem. 2012;22(32):16399–16406.
- Abràmoff MD, Magalhães PJ, Ram SJ. Image processing with image-J. Biophotonics Int. 2004;11:36–41.
- Tammaro D, Astarita A, Di Maio E, et al. Polystyrene foaming at high pressure drop rates. Ind Eng Chem Res. 2016;55(19):5696–5701.
- Zhao B, Hamidinejad M, Wang S, et al. Advances in electromagnetic shielding properties of composite foams. J Mater Chem A. 2021;9:8896–8949.
- Chen T, Wu G, Panahi-Sarmad M, et al. A novel flexible piezoresistive sensor using superelastic fabric coated with highly durable SEBS/TPU/CB/CNF nanocomposite for detection of human motions. Compos Sci Technol. 2022;227:109563.
- Huang X, Panahi-Sarmad M, Dong K, et al. Tracing evolutions in electro-activated shape memory polymer composites with 4D printing strategies: a systematic review. Compos Part A Appl Sci Manuf. 2021;147:106444.
- Gong P, Buahom P, Tran M, et al. Heat transfer in microcellular polystyrene/multi-walled carbon nanotube nanocomposite foams. Carbon. 2015;3:003.
- Harikrishnan G, Singh SN, Kiesel E, et al. Nanodispersions of carbon nano fiber for polyurethane foaming. Polymer. 2010;51(15):3349–3353.
- Al-saleh MH, Saadeh WH, Sundararaj U. EMI shielding effectiveness of carbon based nanostructured polymeric materials : a comparative study. Carbon N Y. 2013;60:146–156.
- Ke K, Yue L, Shao H, et al. Boosting electrical and piezoresistive properties of polymer nanocomposites via hybrid carbon fillers: a review. Carbon N Y. 2021;173:1020–1040.
- Wang M, Tang XH, Cai JH, et al. Construction, mechanism and prospective of conductive polymer composites with multiple interfaces for electromagnetic interference shielding: a review. Carbon N Y. 2021;177:377–402.
- Panahi-Sarmad M, Zahiri B, Noroozi M. Graphene-based composite for dielectric elastomer actuator: a comprehensive review. Sens Actuators A Phys. 2019;293:222–241.
- Zhao B, Hamidinejad M, Zhao C, et al. A versatile foaming platform to fabricate polymer/carbon composites with high dielectric permittivity and ultra-low dielectric loss. J Mater Chem A 2019;7:133–140. 1