
Abstract
Morphometric analysis is a key to understand the hydrological process and hence is a prerequisite for the assessment of hydrological characteristics of surface water basin. Morphometric analysis to determine the drainage characteristics of Palar sub-watershed, a part of Shanmukha watershed in the Amaravati sub-catchment is done using Advanced Space-borne Thermal Emission and Reflection Global Digital Elevation Model (ASTER GDEM) data, and is supplemented with topographical maps in geographical information systems platform. This study uses ASTER GDEM data to extract morphometric features of a mountain stream at micro-watershed level. The sub-watershed is divided into six micro-watersheds. The sub-watershed includes a sixth-order stream. Lower stream orders, in particular first-order streams, dominate the sub-watershed. Development of stream segments is controlled by slope and local relief. Drainage pattern of the sub-watershed and micro-watersheds is dendritic in general. The mean bifurcation ratio of the sub-watershed is 3.69 but its variation between the various stream orders suggests structural control in the development of stream network. The shape factors reveal the elongation of the sub-watershed and micro-watersheds.The relief ratio reveals the high discharge capability of the sub-watershed and meagre groundwater potential. This study is a useful tool for planning strategies in control of soil erosion and soil conservation.
1. Introduction
Drainage pattern, density and geometry of the fluvial system are controlled primarily by three determinants – topography, climate and geology (Frissel et al. Citation1986; Mesa Citation2006). The drainage characteristics reflect the influence of variation of these determinants from place to place. Detailed morphometric analyses provide an insight on basin evolution and further its role on development of drainage morphometry on landforms and their characteristics. It is a vital tool in any hydrological investigation like assessment of groundwater potential and management, pedology and environmental assessment and is a subject of interest to both geomorphologists and hydrologists. Physiographic characteristics of drainage basins like the size, shape, slope, drainage density, size and length of streams can be correlated with various important hydrologic phenomena (Chorley Citation1969; Gregory & Walling Citation1973; Rastogi & Sharma Citation1976). The morphometric parameters describe and compare the basin characteristics and its processes explaining the geologic and geomorphic history of the drainage basin (Strahler Citation1964). Morphometric analysis is a crucial step in understanding the watershed dynamics. Drainage basin morphometry attempts to explain and predict the long-term aspects of basin dynamics resulting in morphological changes within the basin (Thomas et al. Citation2011) and also delineate physical changes in drainage system with time in response to natural or anthropogenic disturbances (Thompson et al. Citation2001).
Morphometric analysis is comprehensively used in various fields of earth science and engineering applications as an indirect tool for estimation of soil, landslide susceptibility mapping, predicting the movement of groundwater and analysing topography (Pike Citation2000). This paper attempts to use Advanced Space-borne Thermal Emission and Reflection Global Digital Elevation Model (ASTER GDEM), owing to its better accuracy particularly in hilly and complex terrain than Shuttle Radar Topography Mission (SRTM) DEM (Slater et al. Citation2006; Forkuor & Maathuis Citation2012) to study the morphometric parameters. Delineation of sub- and micro-watershed boundaries, drainage network and extraction of terrain features like slope are done using ASTER GDEM. Geographic Information System (GIS) is used for the hydro-spatial analysis. The drainage characteristics of Palar sub-watershed are studied to describe and evaluate its hydrological characteristics by analysing topographical maps and ASTER GDEM data. The present investigation can be used to prepare a comprehensive watershed plan for the development, which integrates topography and erosion status with the drainage characteristics of the region. The use of ASTER GDEM data and GIS enables rapid, precise and inexpensive alternative for morphometric analysis (Grohmann et al. Citation2007). This study describes the results of morphometric analysis of tropical mountain river Palar in the Western Ghats, India to understand the basin behaviour using remote sensing and GIS.
2. Study area
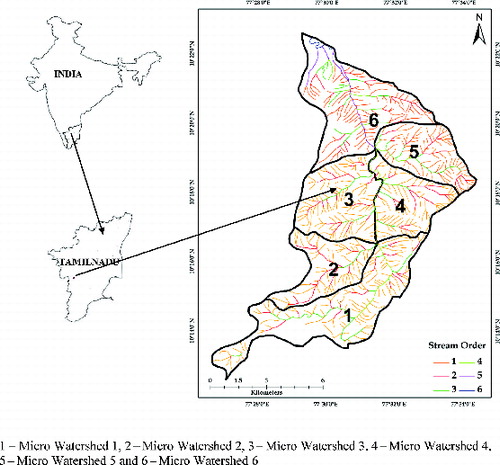
The Palar sub-watershed () is bound between latitudes 10°12′38.17′′ N and 10°22′36.37′′ N and longitudes 77°27′5.13′′ E and 77°34′19.84′′ E, located in the Western Ghats, Kodaikanal taluk of Dindigul district, Tamil Nadu, India and covers an area of 101.21 km2. Palar flows from south to north joining the Shanmukha Nadi and as a typical mountain river is characterized by numerous first-order streams emptying into its two major tributaries – Tevankarai Ar and Gundar. It is the main water source for the Kodaikkanal town. The climate of the region is cold and temperate with high annual rainfall ranging between 1650 and 1800 mm. The region receives both north-west and south-east monsoon with the highest rainfall during October and November while there is sparse rainfall between mid-December and March. There are intense summer showers in April and May. Bedrock geology is monotonous with charnockite in varying degrees of weathering and a limited soil cover. Structural hill and valley complex with pediments and valley fills are the chief terrain features. The elevation is higher in the southern part of the basin and decrease towards the north and rises again in the north-east. This region is a gentle valley – nearly 87% of the slopes have a gradient less than 35°. The southern part of the study area bustles with human activity while the north-eastern areas are barren rock exposures with very limited settlements. Northern part is densely forested.
Figure 1. Location map of the Palar sub-watershed showing the drainage pattern and micro-watershed divides.
3. Methodology
Survey of India (SOI) topographic maps of 1:50,000 scale (58 F/7, 58 F/8, 8 F/11 and 58 F/12) and ASTER GDEM (1 arcsecond, filled, finished, WGS84/EGM96 geoid, 2009) of 30 m resolution are used as base for the delineation of Palar sub-watershed. ASTER data is pre-processed using ENVI 4.1 software. Ground Control Points are collected from topographic maps in 1:50,000 scale for correction and geolocation. A low-pass 3 × 3 filter was applied to smooth the data (Hengl & Evans Citation2009). Data extraction and analysis is carried out using Arc Map 9.2. ASTER GDEM is processed by filling the sinks. Flow direction and flow accumulation grids are generated. Pour points of Tevankarai, Gundar and Palar are digitized as points and converted into raster with the same cell size as ASTER GDEM. Sub-watershed and micro-watersheds are delineated using “watershed” function using the flow direction and pour point grid using the water divide to delineate the boundaries. Detailed drainage network is extracted from SOI topographic maps and stream ordering is based on Strahler's Citation(1964) method.
Length and frequency of the stream of various orders are recorded for the analysis. Basic morphometric parameters such as drainage area (A), perimeter (P), basin length (Lb), stream order (Nu) and mean stream length are estimated. Derived parameters like bifurcation ratio (Rb), mean stream length (Rl), drainage density (Dd), elongation ratio (Re), circulatory factor (Rc), form factor (Ff) and RHO coefficient are calculated from the basic parameters. Relief-related parameters like basin relief, slope, relief ratio, gradient ratio, hypsometric integral and ruggedness number are estimated from ASTER GDEM.
4. Results
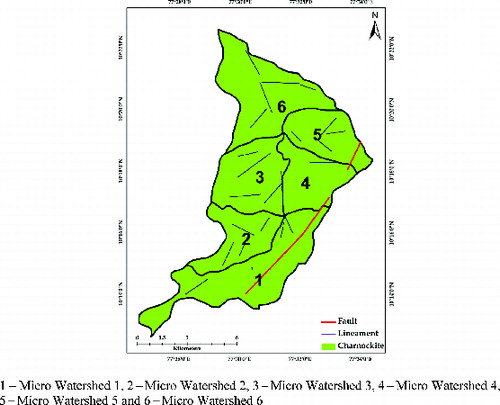
The results of the morphometric analysis of the mountain river sub-watershed Palar and its micro-watersheds are presented in and and are discussed in the following sections. The total drainage area is divided into six micro-watersheds. In general, the watershed exhibits a dominantly dendritic drainage pattern (. The entire region is made of charnockite of khondalite group and the development of dendritic drainage pattern compliments the uniform lithology in this region (Mesa Citation2006). There is a slight change in micro-watershed 1 where it tends to be rectangular owing to the major fault in north-east–south-west direction ().
Table 1. Basic and derived parameters of Palar sub-watershed.
Table 2. Regression trend of stream order and stream number of the micro-watersheds.
4.1 Basic parameters
The basic morphometric parameters of the basin include geometry, stream order, stream length and mean stream length.
4.1.1 Basin geometry
Drainage area (A) is a key watershed characteristic for hydrologic analysis and design. Larger area and higher difference in elevation (relief) leads to greater discharge. The total drainage area of the Palar sub-watershed is 101.28 km2 and the areas of the micro-watersheds are shown in . Micro-watershed 1 is the largest with an area of 24. 97 km2 and micro-watershed 2 is the smallest with an area of 11.86 km2. The perimeter of the Palar sub-watershed is 58.04 km and the micro-watersheds are shown in . The basin length corresponds to the maximum length of the sub-watershed and micro-watersheds measured parallel to the main drainage line. The basin length of the watershed is 23.22 km and that of the sub-watersheds are shown in .
4.1.2 Stream order (Nu)
Classification of streams based on the number and type of tributary junctions is called stream ordering. It is a useful indicator of stream size, discharge and drainage area (Strahler Citation1964). The number of streams (Nu) in each order is presented in for each micro-watershed. The stream characteristics confirm Horton's first law Citation(1945), “law of stream numbers”, which states that number of streams of different orders in a given drainage basin tends closely to approximate an inverse geometric ratio (. Palar is designated as a sixth-order basin. Micro-watersheds 1, 2, 3 and 4 are of fourth order, while micro-watershed 5 is of fifth order and micro-watershed 6 is of sixth order (Horton Citation1945; Strahler Citation1964).
Figure 2. Horton's first law using Palar sub-watershed data.
4.1.3 Stream length (LT) and mean stream length (Lu)
The stream length characteristics of the sub-watershed confirm Horton's second law Citation(1945), “law of stream length”, which states that the average length of streams of each of the different orders in a drainage basin tends closely to approximate a direct geometric ratio. Drainage networks of the sub-watershed and micro-watersheds show a nearly linear relationship with a small deviation from straight line (Chow Citation1964). The total stream length of the sub-watershed is 383.7 km and that of the micro-watersheds is shown in . The total stream length decreases with the increase in stream order. The mean stream length of the watershed is 0.58 and that of the sub-watersheds are shown in .
4.1.4 Maximum and minimum elevation (H and h)
The maximum and minimum elevation of the sub-watershed is 2365 m (in the southern sector, in micro-watershed 1) and 294 m (in the northern sector, in micro-watershed 6) and that of the micro-watersheds are shown in . The relative relief of micro-watersheds 5 and 6 are very high.
4.2 Derived parameters
4.2.1 Bifurcation ratio (Rb)
Bifurcation ratio (Rb) is a dimensionless parameter that reveals the geometric similarity of the basin and expresses the ramification of the drainage network (Strahler Citation1964). The mean Rb of the watershed is 3.69, which falls within the stipulated range of natural drainage system as suggested by Strahler Citation(1964). However, the ambiguous trends in the variation of Rb from 1.91 to 5 for the sub-watershed and from 1.36 to 7.5 for the micro-watersheds between stream orders suggest the influence of geology, structural control and relief on drainage branching. As the geology ( of the area is uniform, relief plays a dominant role and also indicates substantial structural controls (Mekel Citation1970).
Figure 3. Geology and lineament map of Palar sub-watershed.
4.2.2 Stream length ratio (Rl)
Stream length ratio shows a significant relation with surface flow discharge and erosion stage of the basin. The mean stream length of the sub-watershed is 1.44 and that of the micro-watersheds are shown in .
4.2.3 RHO coefficient (RHO)
RHO coefficient relates the drainage density and physiographic development of the basin, allowing the evaluation of the storage capacity of the drainage network (Horton Citation1945). It is influenced by climate, geologic, biologic, geomorphic and anthropogenic factors (Mesa Citation2006). The RHO coefficient of sub-watershed and micro-watersheds vary between 0.32 and 0.68 (). Micro-watersheds 1 and 6 have high RHO and micro-watershed 4 the least.
4.2.4 Stream frequency (Fs)
Stream frequency parameter depends on the lithology of the basin and is an indication of the texture of the drainage network (Horton Citation1945). The stream frequency of the sub-watershed is 6.49 km−2, and that of the micro-watersheds is presented in . Micro-watershed 5 has the highest stream frequency, followed by micro-watershed 4 and micro-watershed 1 the lowest.
4.2.5 Drainage density (Dd)
Drainage density is one of the often-used morphometric parameters in the analysis of various environmental variables. It is a measure of the degree of fluvial dissection and depends on a number of factors like topography, lithology, climate, pedology and vegetation (Nag Citation1998; Mesa Citation2006; Thomas et al. Citation2011). The drainage density of the sub-watershed is 3.79 km/km2 while those of the six micro-watersheds are shown in . Micro-watershed 5 and micro-watershed 4 have a high drainage density while micro-watershed 1 has the lowest.
4.2.6 Drainage texture (T)
Drainage texture portrays the relative channel spacing in a fluvial dissected terrain and depends on a number of natural factors like climate, rainfall, vegetation, rock and soil type, infiltration capacity, relief and stage of development of the basin (Smith Citation1950; Vincy et al. Citation2012). Soft and weak rocks without a vegetative cover show a fine texture, while massive and resistant rocks produce coarse texture. The drainage texture of the sub-watershed is 24.59 and that of the micro-watersheds are given in . Drainage texture of Palar sub-watershed and its micro-watersheds can be categorized as ultra-fine (Smith Citation1950).
4.2.7 Basin relief (R)
Basin relief controls the stream gradient, thereby influencing the quantum of sediment transport and flood patterns (Hadely & Schumm Citation1961). It helps in understanding the denudation characteristics of the basin. The relief of the sub-watershed is 2071 m and that of the micro-watersheds is shown in . The sub-watershed and the micro-watershed have high relief due to physiographic mountainous structure of the region. Micro-watershed 6 has the highest relief and micro-watershed 2 the lowest.
4.2.8 Relief ratio (Rr)
The relief ratio of the sub-watershed is 0.12, characterizing mountainous configuration of the terrain (Schumm Citation1963). Micro-watershed 1 shows the least relief ratio, indicating less erosive power owing to gentle gradient. Relief ratio is higher for micro-watersheds 5 and 6.
4.2.9 Gradient ratio (Gr)
Gradient flow indicates the channel slope for evaluation of run-off volume (Sreedevi et al. Citation2005). The gradient ratio of the sub-watershed is 0.09 and that of the micro-watersheds are presented in . It reflects the hilly nature of the terrain. It is the least for micro-watershed 1 and the highest for micro-watershed 5.
4.2.10 Slope
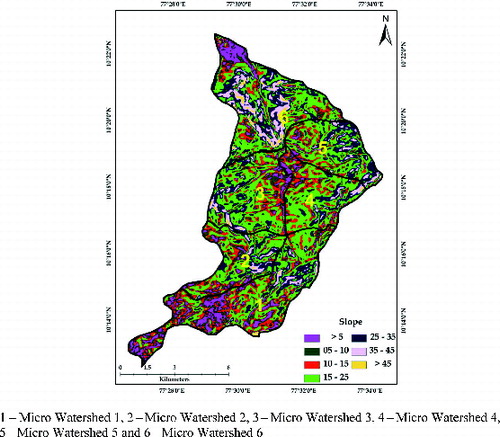
Slope of a basin is a morphometric factor of hydrological relevance (Mesa Citation2006) that indicates the momentum of run-off and time of concentration of run-off. Steep slopes have higher surface run-off and low infiltration rates, which in turn accelerates erosion, especially in the case of barren slopes (Verstappen Citation1983). The slope varies from 0° to 65°, with a mean of 18.89°. The slope derived from the DEM is reclassified into seven classes: <5°, 5°–10°, 10°–15°, 15°–25°, 25°–35°, 35°–45° and >45° (). Maximum pixels fall in the 15°–25° category. The mean slope is the highest for micro-watershed 6 and is the lowest for micro-watershed 1.
Figure 4. Slope map of the Palar sub-watershed and the micro-watersheds.
4.2.11 Ruggedness number (RN)
Ruggedness number is used to measure the flash flood potential of the streams (Patton & Baker Citation1976). It expresses the geometric characteristics of the basin. RN of the sub-watershed is 8.9 and that of the micro-watersheds are given in . Micro-watersheds 4 and 5 have higher RN values showing their susceptibility to erosion.
4.2.12 Hypsometric integral (Ihyp)
Hypsometric integral is a measure of the degree of fluvial landscape erosion (Strahler Citation1952; Markose & Jayappa Citation2011). Ihyp of the sub-watershed is 0.5 and the micro-watersheds range between 0.49 and 0.50 (), which means 50% of the original volume of the sub-watershed still remains in the basins to erode.
4.3 Shape parameters
Watersheds have numerous shapes and its shape reflects the run-off behaviour at the outlet. Typical parameters that describe the basin shape are discussed. The quantification of shape parameters are shown in .
Table 3. Shape factors of Palar sub-watershed.
4.3.1 Elongation ratio (Re)
The elongation ratio for the watershed is 0.49 and that of the sub-watershed is shown in . Micro-watersheds 1, 2 and 4 are elongated in shape, micro-watershed 5 is less elongated and micro-watersheds 3 and 6 oval, showing high relief and considerable slope.
4.3.2 Circularity ratio (Rc)
Circulatory ratio is influenced by the lithology of the basin, stream frequency and gradient of various orders (Strahler Citation1964). It indicates the basin shape, implying the rate of infiltration and time taken for the excess water to reach the basin outlet depending upon the geology, slope and vegetative cover of the area. Rc of the sub-watershed is 0.38, indicating an elongated basin, with a dendritic drainage pattern. Micro-watersheds 3 and 5 have a higher circulatory ratio. Micro-watershed 5 is less elongated with uniform rate of infiltration and hence the excess run-off takes longer time to reach the basin outlet.
4.3.3 Form factor (Ff)
Horton Citation(1945) proposed this parameter to predict the flow intensity of a basin in a defined area. It shows an inverse relationship with square of the axial length and a direct relation with peak discharge (Gregory & Walling Citation1973). The form factor of the sub-watershed is 0.19 and that of the micro-watersheds are shown in . They have peak flows for longer duration. Micro-watershed 6 has the highest form factor and thereby has the highest peak discharge in the sub-watershed.
5. Discussion
An attempt is made to use ASTER GDEM for morphometric study especially in mountain regions. SRTM DEM provides more accurate elevations but ASTER GDEM offers better morphometric and geomorphic details (Pareta & Pareta Citation2011; Forkuor & Maathuis Citation2012). Hence, it can be used in watershed planning at initial phase as it is cost-effective and easily available. The watershed boundaries extracted from pre-processed ASTER GDEM are compared using topographic maps and it shows that the boundaries match closely.
First-order streams account for nearly 75% of the total number of streams in the basin. Numbers of first-order streams are higher in all the micro-watersheds, indicating structural weakness present in the basin dominantly in the form of lineaments (Mesa Citation2006). Regression trend of stream order and stream number exhibit a power function relationship with negative correlation ().
The relationship between area of micro-watershed and total stream length () shows that area bears a linear relation with total stream length and has positive correlation. The mean stream length of an order is higher than the next higher order, except in the case of fourth-order streams, which can be due to local differences in slope and topography (Sreedevi et al. Citation2005; Imran Malik et al. Citation2011). In general, it shows that the evolution of this basin dominantly follows the laws of erosion acting on homogeneous geologic material with uniform weathering–erosion characteristics. However, in the case of micro-watershed 1, it is lower for second-order stream; in the case of micro-watershed 2, it is lower for fourth-order stream; in the case of micro-watershed 4, it is lower for third-order stream; in the case of micro-watershed 5, it is lower for second- and fifth-order streams; and in the case of micro-watershed 6, it is lower for second-, fourth- and sixth-order streams. Discrepancy in stream orders in the micro-watersheds is attributed to anomalous basin development, local variation in the topography and effect of localized geological disturbance.
Figure 5. Correlation between basin area and total stream length.
In general, Rb of lower orders is higher, reflecting high dissection in these sections. Bifurcation ratio of micro-watershed 2 falls in the range of 4–8, showing structural disturbance in the area caused by the presence of a major fault () in its proximity (Clark et al. Citation2004). It is also evident from the higher Rb of second-order stream (), whereas micro-watersheds 1 and 6 have Rb less than 3, indicating that they have no structural disturbance and are also prone to flooding (Chorley Citation1969). Despite homogenous lithology, changes in Rb of various orders suggest dissimilarities in the geometry. Head ward erosion can also be attributed to the changes in Rb owing to general nature of the terrain.
Rl between successive stream orders does not follow any system pattern of variations or empirical rule. This anomaly can be interpreted as a sign of disequilibrium in the drainage development. The Rl of the sub-watershed and the micro-watersheds are below the natural range (2.10–2.19) and, as suggested by Scheidegger Citation(1970), indicates structural control, dominance of slope and topographic conditions. High RHO coefficient of micro-watershed 1 indicates high hydric storage and attenuates the erosion effects during elevated discharge.
The stream frequency of all the micro-watersheds is moderate, indicating a moderate run-off and their drainage density is high showing a highly dissected terrain. The drainage density indicates a highly dissected steep terrain with impervious underlying rocks, which is moderate to well drained with low infiltration. The micro-watersheds have very fine texture, indicating high drainage development with high erosion. Stream frequency, drainage density and texture are very high for micro-watershed 5, indicating that it is erosion intensive while micro-watershed 1 has the least values and thereby is less prone to erosion. shows the regression trend between drainage density and stream frequency. It shows a positive linear correlation.
Figure 6. Relation between drainage density of the micro-watersheds and stream frequency.
Relief ratio depicts a high-energy basin with intense erosion and high sediment load, but it is significantly low for micro-watershed 1, depicting a low-energy basin and this same may be attributed to its gentle topography. The gradient ratio also portrays a similar scenario. Micro-watershed 5 has the highest gradient ratio, indicating higher potential for run-off and steep slopes. The hypsometric integral for both the sub-watershed and its micro-watershed is 50%, depicting that the sub-watershed is in equilibrium state.
The micro-watersheds have a moderate slope (. Despite the least mean slope, the maximum and minimum slopes of the Palar sub-watershed also fall within micro-watershed 1, indicating that a gentle topography and further exploitation by anthropogenic activities has created a plateau-like terrain. It makes the basin a low-energy basin with less sediment load. Micro-watersheds 5 and 6 are at the tail end of the sub-watershed, having higher mean slope, providing a favourable topography for higher rate of erosion. These results are synchronous with the inference from the relief ratio and gradient ratio. Ruggedness number of all the micro-watersheds reflects the mountainous nature of the terrain, with more erosion and dissection with the lowest value for micro-watershed 1 and higher values for micro-watersheds 5 and 6, complimenting the results from slope, relief ratio and gradient ratio.
Shape factors depict geomorphology and provide an insight into the run-off and infiltration process in the basin. In general a higher Re is associated with circular shape and a lower Re with elongated basin. The sub-watershed has an elongated shape according to the classification proposed by Strahler Citation(1964). Elongated basins are characterized by more number of lower order streams and higher bifurcation ratio (Chorley Citation1969). The regression trend between elongation ratio and bifurcation ratio shows negative correlation (). The micro-watersheds 1, 4 and 5 do not reflect this general norm and this anomaly can be attributed to structural and topographical control in drainage development. The elongation ratio also depicts the strong relief in the sub-watershed. Micro-watershed 1 alone has a slightly lower elongation ratio again suggesting a gentler slope. Rc of the micro-watersheds range between 0.27 and 0.71. However, micro-watershed 5 shows high Re and Rc values, indicating differential erosion and watershed displacement. Form factor for elongated basins range between 0.1 and 0.8 (Strahler Citation1964) and all the micro-watersheds fall in this category. Micro-watersheds 3, 6 and 5 have higher form factors than the other micro-watersheds, reflecting their oval and less elongated shapes, respectively, in coherence with their elongation and circulatory ratios. The higher form factor of micro-watersheds 5 and 6 () also indicate higher drainage development and structural control in these micro-watersheds. It is observed that elongation ratio > circulatory ratio > form factor (Srinivasa & Nagesh Citation2011) except for micro-watershed 6, emphasizing structural control. shows the variation of the shape parameters.
Figure 7. Relationship between bifurcation ratio and elongation ratio.
Figure 8. Variation of shape factors in the micro-watersheds.
6. Conclusions
The study demonstrates the successful use of ASTER GDEM for hydrological analysis at micro-watershed level for a mountain river. The stream ordering system of Palar reveals high hierarchy and high degree of ramification of the watershed (Horton Citation1945). The sub-watershed is classified as a sixth-order watershed. First-order streams dominate the sub-watershed, and the drainage network provides a sufficient superficial draining with a high number of lower order streams flowing directly into the higher order. The bifurcation ratio of the watershed and sub-watershed reflect the mountainous or highly dissected nature of the terrain. The mean bifurcation ratio of the sub-watershed in relation to the variation of bifurcation ratio with the successive stream orders suggests that drainage pattern is not influenced by geology but by relief and structural controls. It also relates to the elongated shape of the basin (Schumm Citation1956). The development of the stream segments is affected by slope and local relief (Strahler Citation1964), which accounts for the difference in drainage density of the sub-watersheds. The physiographic structure of the watershed generates high run-off and low infiltration, leading to high proportion and velocity of overland flow. This causes sheet, rill and gully erosion and a high sediment load, which is reflected in the high relief ratio of the watershed. The shape parameters depict an elongated watershed with smaller flood peaks and longer flood flows (Gregory & Walling Citation1973). This is a vital component to be considered in basin management and land use planning. This is a cost-effective alternative for watershed management and planning and is also easily available.
References
- Chorley RJ. 1969. Introduction to fluvial processes. London: Methuen; p. 30–52.
- Chow VT, editor. 1964. Handbook of applied hydrology. New York: McGraw Hill.
- Clark MK, Schoenbohm LM, Royden LH, Whipple KX, Burchfiel BC, Zhang X, Tang W, Wang E, Chen L. 2004. Surface uplift, tectonics, and erosion of eastern Tibet from large-scale drainage patterns. Tectonics. 23. doi:10.1029/2002TC001402
- Forkuor G, Maathuis B. 2012. Comparison of SRTM and ASTER derived digital elevation models over two regions in Ghana – implications for hydrological and environmental modeling. In: Piacentini T, editor. Studies on environmental and applied geomorphology. InTech; p. 219–240.
- Frissel CA, Liss WJ, Warren CE, Hurley MD. 1986. A hierarchical framework for stream habitat classification: viewing streams in a watershed context. Environ Manag. 10:199–214.
- Gregory KJ, Walling DE. 1973. Drainage basin form and process: a geomorphological approach. New York: Wiley; p. 456.
- Grohmann CH, Riccomini C, Alves FM. 2007. SRTM-based morphotectonic analysis of the Poços de Caldas Alkaline Massif southeastern Brazil. Comput Geosci. 33:10–19.
- Hadely RF, Schumm SA. 1961. Sediment sources and drainage basin characteristics in upper Cheyenne River basin. United States Geological Survey water-supply paper, 1531-B. Washington, DC: US Government Printing Office; p. 137–196.
- Hengl T, Evans IS. 2009. Mathematical and digital models of the land surface. In: Hengl T, Reuter HI, editors. Geomorphometry: concepts, software, applications. Amsterdam: Elsevier; p. 31–63.
- Horton RE. 1945. Erosional development of streams and their drainage density: hydrophysical approach to quantitative geomorphology. Geol Soc Am Bull. 56:275–370.
- Imran Malik M, Sultan Bhat M, Kuchay NA. 2011. Morphometric analysis of Lidder catchment in Kashmir valley using geographical information system. Recent Res Sci Technol. 3(4):118–126.
- Markose VJ, Jayappa KS. 2011. Hypsometric analysis of Kali River Basin, Karnataka, India, using geographic information system. Geocarto Int. 26(7):553–568.
- Mekel JFM. 1970. The use of aerial photographs in geological mapping. ITC text book of photo-interpretations. Delft (The Netherlands): International Institute for Aerial Survey and Earth Sciences. Volume 8; p. 1–169.
- Mesa LM. 2006. Morphometric analysis of a subtropical Andean basin (Tucumam, Argentina). Environ Geol. 50(8):1235–1242.
- Nag SK. 1998. Morphometric analysis using remote sensing techniques in the Chaka sub basin Purulia district, West Bengal. J Indian Soc Remote Sensing. 26:69–76.
- Pareta K, Pareta U. 2011. Quantitative morphometric analysis of a watershed of Yamuna basin using ASTER (DEM) data and GIS. Int J Geomatics. 2(1):248–269.
- Patton PC, Baker VR. 1976. Morphometry and floods in small drainage basins subject to diverse hydrogeomorphic controls. Water Resour Res. 12:941–952.
- Pike RJ. 2000. Geomorphometry: diversity in quantitative surface analysis. Prog Phys Geography. 24:1–20.
- Rastogi RA, Sharma TC. 1976. Quantitative analysis of drainage basin characteristics. J Soil Water Conservation India. 26(1–4):18–25.
- Scheidegger AE. 1970. Theoretical geomorphology. London: George Allen and Unwin; p. 243–248.
- Schumm SA. 1956. Evolution of drainage systems and slopes in Badlands at Perth Amboy, New Jersey. Bull Geol Soc Am. 67:597–646.
- Schumm SA. 1963. Sinuosity of alluvial rivers on the great plains. Bull Geol Soc Am. 74:1089–1100.
- Slater JA, Garvey G, Johnston C, Haase J, Heady B, Kroenung G and Little J. 2006. The SRTM data “finishing” process and products. Photogrammetric Eng Remote Sensing. 72:237–247.
- Smith KG. 1950. Standards for grading texture of erosional topography. Am J Sci. 248:655–668.
- Sreedevi PD, Subrahmanyam K, Shakeel A. 2005. The significance of morphometric analysis for obtaining groundwater potential zones in a structurally controlled terrain. Environ Geol. 47(3):412–420.
- Srinivasa R, Nagesh KD. 2011. Classification of microwatersheds based on morphological characteristics. J Hydro-Environ Res. 5:101–109.
- Strahler AN. 1952. Hyposometric (area-altitude) analysis of erosional topography. Geol Soc Am Bull. 63:1117–1141.
- Strahler AN. 1964. Quantitative geomorphology of drainage basins and channel networks. In: Chow VT, editor. Handbook of applied hydrology. New York: McGraw-Hill; p. 439–476.
- Thomas J, Joseph S, Thrivikramji KP, Abe G. 2011. Morphometric analysis of the drainage system and its hydrological implications in the rain shadow regions, Kerala, India. J Geographical Sci. 21(6):1077–1088.
- Thompson JR, Taylor MP, Fryirs KA, Brierley GJ. 2001. A geomorphological framework for river characterization and habitat assessment. Aquatic Conservation Marine Freshwater Ecosystem. 11:373–389.
- Verstappen H. 1983. The applied geomorphology. Enschede (The Netherlands): International Institute for Aerial Survey and Earth Science (ITC).
- Vincy MV, Rajan B, Pradeepkumar AP. 2012. Geographic information system-based morphometric characterization of sub-watersheds of Meenachil river basin, Kottayam district, Kerala, India. Geocarto Int. 27(8):661–684.