
Abstract
The 18 September 2011 Sikkim Himalaya earthquake of Mw 6.9 (focal depth 50 km, NEIC report) with maximum intensity of VII on MM scale (www.usgs.gov) occurred in the Himalayan seismic belt (HSB), to the north of the main central thrust. Neither this thrust nor the plane of detachment envisaged in the HSB model, however, caused this strong devastating earthquake. The Engdahl–Hilst–Buland (EHB) relocated past earthquakes recorded during 1965–2007 and the available global centroid moment tensor) solutions are critically examined to identify the source zone and stress regime of the September 2011 earthquake. The depth section plot of these earthquakes shows that a deeper (10–50 km) vertical fault zone caused the main shock in the Sikkim Himalaya. The NW (North-West) and NE (North-East) trending transverse fault zones cutting across the eastern Himalaya are the source zones of the earthquakes. Stress inversion shows that the region is dominated by horizontal NNW-SSE (North of North-West-South of South-East) compressional stress and low angle or near horizontal ENE-WSW (East of North-East-West of South-West) tensional stress; this stress regime is conducive for strike-slip faulting earthquakes in Sikkim Himalaya and its vicinity. The Coulomb stress transfer analysis indicates positive values of Coulomb stress change for failure in the intersecting deeper fault zone that produced the four immediate felt aftershocks (M ≥ 4.0).
1. Introduction
Continuing convergence between India and Eurasia has given rise to not only the spectacular Himalaya but also a 2500-km-long seismic belt causing large and great earthquakes from Kashmir Himalaya in the west to Arunachal Himalaya in the east. The most widely accepted tectonic model to understand the Himalayan large earthquakes has been the steady-state tectonic model envisaged by Seeber et al. (Citation1981). This model suggested that in the Himalayan seismic belt (HSB), earthquakes between the main boundary thrust (MBT) and main central thrust (MCT) are confined above the plane of detachment, the interface between the Indian basement and the Himalayan sedimentary wedge. In recent investigations, it has been, however, argued that each large or great earthquake in the Himalaya is unique and hence a single generalized model cannot explain all these earthquakes from west to east (Singh & Gupta Citation1980; Holt et al. Citation1991; GSI Citation1993; Kayal Citation2001, Citation2010).
The Sikkim is an Indian state that lies in the north-eastern part of this giant Himalayan belt and is situated between Nepal and Bhutan and is less explored as compared to the other parts of Himalaya (Jain et al. Citation2003; Tiwari et al. Citation2006; Patro & Harinarayana Citation2009). There are a few works on surface geological and geo-chemical studies carried out in this area (Acharya & Sastry Citation1979; Mohan et al. Citation1989; Catlos et al. Citation2004). However, the geophysical investigation in this region is limited to seismic studies only (Engdhal et al. Citation1998; De & Kayal Citation2003; Nath et al. Citation2005; Monsalve et al. Citation2006; Tiwari et al. Citation2006; Joshi et al. Citation2010). The gravity and magnetic measurements of Tiwari et al. (Citation2006) provide a detailed source for gravity and magnetic anomalies across the Sikkim Himalaya and allow mapping a detailed crustal structure in this part of Himalaya. Flexure of under-thrusting Indian plate appears to support the Himalayan topography and produces large variation in Moho depth, which contributes most of the gravity signal observed at the surface. The magnetotelluric study by Patro and Harinarayana (Citation2009) in Sikkim Himalaya region shows distinct electrical signatures associated to the main frontal thrust (MFT), MBT and the MCT. The MFT and MBT zones are expressed by a conductive feature of about 10–40 Ω m, while an anomalously high conductive feature (2–5 Ω m) in the crust in the depth range of 3–15 km is observed to the north of MBT. Recently, Acton et al. (Citation2011) has provided the first image of the descending Indian plate beneath the Darjeeling–Sikkim Himalaya through receiver function analysis. This study shows that the Moho appears to flex upwards beneath Gangtok with a south-easterly dip direction before starting to descend rapidly again beneath the Greater Himalaya.
The epicentre of the 18 September 2011 strong earthquake occurred to the north-west of Sikkim, near the border between India and Nepal. According India Meteorological Department (IMD) report, the earthquake was proceeded with one foreshock (03 June 2011, M 4.9, depth 26 km) and four aftershocks (magnitude 3.9–5.0, depth 9–30 km) (. The hypocentral and the source parameters for this earthquake reported by different national as well as international agencies are found to be consistent but differ drastically on focal depth (varying from 10 to 50 km, ). This earthquake caused huge damages with the economic losses of around 22.3 billion US dollars (Mahajan et al. Citation2012) and about 60 casualties in the Sikkim Himalaya. The reported maximum intensity VII in MM scale is, however, not the root cause of such devastation; the poor construction of houses and the hilly landslide prone terrain (Sengupta et al. Citation2010; INTACH Citation2012; Rai et al. Citation2012) played a major role. From the seismotectonic perspective, Rajendran et al. (Citation2011) confirm that the mid-crustal focal depth of the 18th September Sikkim earthquake reflects the ongoing deformation of the subducting Indian plate by dextral motion (Ravi Kumar et al. Citation2012) or by lateral slip (Dasgupta et al. Citation2013) along steeply dipping fault systems. The macroseismic field observations of Mahajan et al. (Citation2012) find asymmetrical distribution and heterogeneous damage pattern in the region which demonstrates intensity attenuation characteristics of the region. The intensity distribution map indicates a maximum peak ground acceleration (PGA) of 0.45 g at Chungthang, and it is reduced towards north, with a PGA of 0.25 g at Theng, Bichhu, and of 0.15 g at Gangtok city (Mahajan et al. Citation2012). According to Thakur et al. (Citation2012), as the strike-slip fault environment of 2011 Sikkim earthquake at the lower crust is something different to the seismogenic settings of north-western Himalaya and Nepal, there may be some transcurrent deformation at deeper depth in the region. Joshi et al. (Citation2012) have presented a rupture model using simulation of near-field and far-field accelerograms for this earthquake, while Sharma et al. (Citation2013) have prepared the isoseismal maps of the 18 September 2011 earthquake using the intensities assigned to various places in Sikkim and contiguous places. The isoseimlas are found to be of elliptical shape with its major axis in the NE–SW direction and minor axis in the NW–SE direction. On the other hand, by observing the co-seismic displacement and relative movements of global positioning system (GPS) baselines along and across the existing geological faults/lineaments around the Sikkim event, Pradhan et al. (Citation2013) conclude that the region east of Kanchenjunga fault has undergone large deformation (∼10 mm).
Table1. Sikkim earthquake of 18 September 2011 – foreshock, main shock and aftershock parameters given by different agencies.
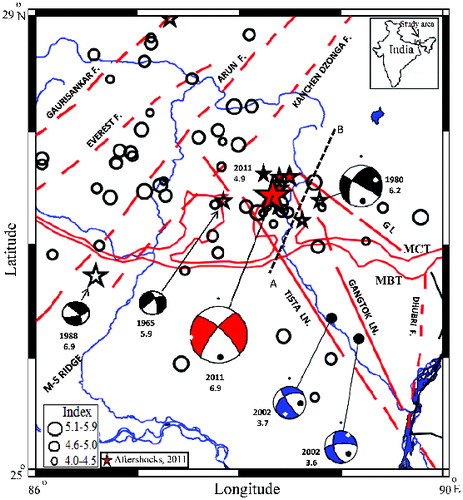
Figure1. Tectonic map of the Sikkim Himalaya (after De & Kayal Citation2003) showing the epicentres of EHB relocated earthquakes (1965–2007). The 18 September 2011 main shock and four significant aftershocks (M ≥ 4.0) are shown by red stars. The foreshock of the earthquake is shown by filled black star. The open black stars show the two damaging strong earthquakes (M ≥ 5.9) with CMT fault-plane solutions. The solution of the 1988 earthquake is from Banghar (Citation1991) based on first motion plot, and the waveform inversion solutions of two smaller events of 2002 are from Baruah et al. (Citation2012a, Citation2012b). MCT: Main Central Thrust, MBT: Main Boundary Thrust, HFT: Himalayan Frontal Thrust, and GL: Goalpara lineament. The blue line indicates the river system. The black dotted line “AB” indicates the profile of MT stations used by Patro and Harinarayan (Citation2009) for their Magnetotelluric study. Inset: key map of the study area.
In this study, we have made an attempt to examine the source zone and stress regime in the Sikkim Himalaya tectonic block. The results shed new light on our understanding of another unique strong event in the eastern Himalaya, which is very different from the western Himalayan earthquakes, and not fit into the widely accepted HSB tectonic model.
2. Seismotectonics of Sikkim Himalaya
The continent–continent collision of India with Asia resulted in the formation of Himalaya at ∼50 Ma (Allegre et al. Citation1984). The Sikkim Himalaya is a part of the active Himalayan fold-thrust belt . The major tectonic features traversing Sikkim Himalaya are MBT and MCT to the north, albeit a circular overturned of the later (Ravi Kumar et al. Citation2012; Pradhan et al. Citation2013). The other important features are NNW–SSE trending Tista and Gangtok lineaments, the WNW–ESE trending Goalpara lineament and the SW–NE trending Kanchanjangha fault. Based on teleseismic hypocentral data, a conceptual tectonic model of the Himalaya was first suggested by Seeber et al. (Citation1981). The model consists of the gently dipping Indian shield, overriding Tethyan slab and the Himalayan sedimentary wedge, which is decoupled from the two converging slabs. In this model, the MBT and the MCT are two active thrusts and are contemporaneous features. Ni and Barazangi (Citation1984), however, argued that the MCT is dormant now, and the MBT is active. In the proposed model, the interface between the subducting slab and the sedimentary wedge is named the plane of detachment (Kayal Citation2010; Dasgupta et al. Citation2013). Acton et al. (Citation2011) have indicated that below Sikkim, the Moho continues to deepen to the north but there are indications of secondary topography. The Moho appears to flex upwards beneath Gangtok (capital of Sikkim) with a south-easterly dip direction before starting to descend rapidly again beneath the Greater Himalaya.
The region has exposed a variety of rocks belonging to a wide range of geological age and tectonic status. These include the comparatively thin sedimentary cover rocks of Tertiary age, affected by the fold-thrust movement during the terminal phase of Himalayan orogeny in the south, followed northward by the pre-tertiary metasedimentaries, dominantly of Proterozoic age, and the intrusive (Joshi et al. Citation2010; Mahajan et al. Citation2012). MBT marks the boundary between the tertiaries and pre-tertiaries. MCT is exposed parallel and north of MBT which separates the highly metamorphosed central crystalline in the north from the comparatively low-grade rocks of the Lesser Himalaya towards south (Joshi et al. Citation2010). Other prominent tectonic features in and around Sikkim include Tista lineament, Kunchenjunga lineament, Purnea–Everest lineament, Arun lineament and Dhubri fault in the southeast.
The entire area of Sikkim lies in Zone IV of the seismic zonation map of India (BIS-1893 Citation2002). The seismic Zone IV is broadly associated with seismic intensity VIII on the Modified Mercalli Intensity (MMI) scale. Earthquakes in this region are broadly associated with strain accumulation associated with the northward tectonic movement of the Indian plate and its subsequent abrupt release (Sharma et al. Citation2013). The 18 September 2011 Sikkim earthquake is located NE to the junction of Kanchenjunga and Tista lineament. In terms of the damage, this is the worst earthquake experienced in this region during the last two decades, i.e., since 1988 (Mahajan et al. Citation2012). Ravi Kumar et al. (Citation2012) have reported 292 aftershocks of this Mw 6.9 earthquake from the temporary and closely spaced station network in the region. However, IMD reports only four of them and NEIC reports three. Most of the aftershocks are of smaller size and IMD could not record the same.
3. Earthquake source zone in the Sikkim Himalaya
Unlike the north-west Himalaya, the seismic activity in the Sikkim Himalaya is not uniform (Kayal Citation2010). Engdahl et al. (Citation1998) (and its update) and Monsalve et al. (Citation2006) suggest that the seismicity occurs in the upper half of the crust but some events occur in lower crust and sub-Moho mantle beneath Sikkim and western Nepal. To identify the earthquake source zone, we have first examined the past earthquakes in the Sikkim Himalaya. It shows that the Sikkim Himalaya has not experienced any major earthquakes (M ≥ 7.0) in the past, except two merely strong earthquakes in 1965 (mb 5.9) and in 1980 (mb 6.0, Mw 6.2), respectively. About 80 earthquakes with M ≥ 4.0 are reported in both the International Seismological Centre and theEngdahl–Hilst–Buland (EHB) relocated catalogue for Sikkim and surroundings within 25o–29o N and 86o–90o E (. Earthquakes in the EHB catalogue were relocated using the relocation analysis method of Engdhal et al. (Citation1998). We prefer this catalogue toexamine the spatial cluster of all these events on a cross section (1°width, from 88o to 89° E) for identifying reliable source of earthquakes at depth.
A visual examination of the epicentre map of the events, recorded during 1965–2007, show a cluster of events at the September 2011 Mw 6.9 earthquake epicentre zone (. This zone is located in between two long lineaments/faults identified by the Geological Survey of India (GSI Citation2000), namely the Tista and the Gangtok lineaments, at an intersection with the Goalpara lineament. The strike-slip mechanism of the 1965 event (mb = 5.9) was attributed to the Tista fault, and the 1980 strike-slip event of Mw 6.2 was attributed to the Goalpara lineament (De & Kayal Citation2003, Citation2004). Further, it may be noted that several long NE and NW trending lineaments from the Himalayan foredeep to the High Himalaya, and even beyond, transect the Sikkim Himalaya (). In addition, two major subsurface ridges are identified by gravity surveys on both sides of the Sikkim block, the NE trending Mungher–Saharsa (M–S) ridge to the west and NW trending Goalpara ridge to the east (; GSI Citation2000). The most significant and a largest of the 20 August 1988 event (mb = 6.9) occurred at the Himalayan frontal thrust (HFT) zone at an estimated depth of 53 km to the southwest of the September 2011 Sikkim main shock. The August 1988 earthquake also shows a strike-slip mechanism. The local broadband network in Assam valley, foredeep of the eastern Himalaya, recorded two small earthquakes with Mw 3.6–3.7 in 2002 at the southern end of the Tista fault and these events also show strike-slip mechanisms (Baruah et al. Citation2012a, Citation2012b, see ).
The CMT (centroid moment tensor) solution for the 18 September 2011 Sikkim earthquake features a strike-slip mechanism with a centroid depth at 47 km (www.usgs.gov). The solution is interpreted to be a right lateral strike-slip mechanism on the NW–SE trending nodal plane that correlates with the long Tista fault, which transversely cuts across the Sikkim Himalaya ().
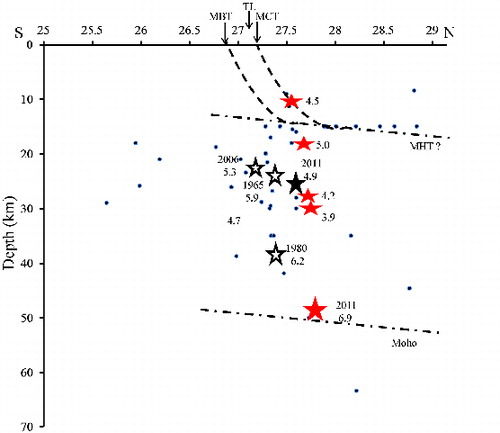
The cross section of the events shows a unique feature of the source zone. The cluster of events that occurred during 1965–2007 in the main shock epicentre zone, including the well-recorded four significant felt aftershocks (M ≥ 4.0) within few days after the main shock (www.imd.gov.in), occurred at a depth zone 10–50 km, almost on a vertical fault plane (). The past two strong earthquakes, the 1965 (mb 5.9) and the 1980 (Mw 6.2), also occurred in this vertical fault zone. This observation not only indicates that the earthquakes are occurring on a vertical fault plane by strike-slip mechanism but also illustrates that the faults are deeper, reaching down to the Moho depth (∼50 km) below the Sikkim Himalaya.
Figure2. A north-south cross section of the earthquakes across the 2011 main shock epicentre zone () showing the past earthquakes (circles) including two (1965 and 1980) strong earthquakes (open black stars), and the 2011 main shock (bigger red star), its four significant aftershocks (smaller red stars) and one foreshock (filled black star) occurred on a vertical fault zone at depth 10–50 km. TL: Tista lineament/fault.
It may be noted that the August 1988 earthquake (mb = 6.9) at the HFT near the border of Nepal and Bihar had been well located with a focal depth of 50–60 km by the US Geological Survey (USGS) and Earthquake Research Institute , Japan, and in the EHB catalogue, its depth is given at 53 km. Kayal Citation(2001, Citation2008, Citation2010) argued that the source zones of strong/great earthquakes to the south of MBT are deeper, much below the envisaged plane of detachment. In the HSB tectonic model, depth of the plane of detachment is given at 10–20 km between the MBT and MCT, and it is much shallower (∼2–5 km) to the south of MBT at the HFT zone. The HFT zone is demarcated to be the southern boundary of the present day plate convergence, and the zone is identified to be vulnerable to future strong/great earthquakes (Nakata Citation1989; Kayal Citation2008). The recent broadband network data recorded in the Nepal Himalaya indicated a deeper source zone (30–60 km) much below the plane of detachment at the HFT (Monsalve et al. Citation2006).
In the western Himalaya, strong earthquakes at depth 15–20 km on the plane of detachment are, however, observed to the north of MBT in the HSB. The two strong earthquakes, the 1991 Uttarkashi earthquake (Ms 6.8, USGS report) and the 1999 Chamoli earthquake (Ms 6.6, USGS report) in the Garhwal Himalaya to the west, occurred at the seismogenic “fault-ends” on the plane of detachment and their aftershocks triggered by these faults also occurred above the plane of detachment at shallower depth (Kayal Citation2001; Kayal et al. Citation2003). The “fault ends” on the plane of detachment were the sesimogenic source zones for the main shocks, and the aftershock sequences were generated by triggering at the active faults of the region (Kayal Citation1996; Kayal et al. Citation2003).
In the eastern or north-eastern Himalaya, the deeper earthquakes down to 70 km, however, do not fit into the plane of detachment model (Kayal et al. Citation1993; Kayal Citation2001, Citation2010). In recent years, several micro-earthquake networks were run to delineate the plane of detachment in the Sikkim Himalaya (De & Kayal Citation2003, Citation2004) and also in the Arunachal Himalaya (Kayal et al. Citation1993; Kayal Citation2001). It was observed that the earthquakes are much deeper in the Sikkim Himalaya as well as in the Arunachal Himalaya, and the events occur much below (down to 70 km) the envisaged plane of detachment at 10–20 km. The Sikkim Himalaya transected by several long NE and NW lineaments (), and the earthquakes occur by strike-slip mechanisms on these lineaments (Mukhopadhyay Citation1984; Dasgupta et al. Citation1987; Kayal Citation2001; De & Kayal Citation2003, Citation2004). Similar observations are reported in the Arunachal Himalaya (Kayal et al. Citation1993; Kayal Citation2001). Further, Kayal et al. (Citation2010) argued that the 21 September 2009 strong Bhutan Himalaya earthquake (Mw 6.3) was caused by the long Kopili fault in the Assam valley, which is transverse to the Himalayan trend and transgresses into the Himalaya. The earthquake on the Kopili fault is an example for such a strike-slip earthquake on a transecting fault. Such long seismogenic transverse structures have caused displacements and curvilinear structures on the MBT and MCT in eastern or north-eastern Himalaya (; Dasgupta et al. Citation1987; Kayal Citation2010; Kayal et al. Citation2010).
4. Tectonic stress regime and Coulomb stress change
Individual fault-plane solutions may not represent precise regional tectonic stress pattern. In such situations, stress inversion techniques using a number of fault-plane solutions estimate the regional stress system much more precisely, especially in seismically active zones (e.g. Angelier Citation2002; Angelier & Baruah Citation2009; D’Amico et al. Citation2010, Citation2012, Citation2013; Baruah et al. Citation2013). In this work, we used two methods, the Michael method (1984 and 1987) and the Gauss method (Zalohar and Vrabec Citation2007), for the inversion analysis. For stress tensor inversion, we used the inversion algorithm of Michael Citation(1984, Citation1987) (Michael method) and Zalohar and Vrabec (Citation2007) (Gauss method). The Michael method uses the statistical technique of bootstrap re-sampling and allows determination of the three principal stresses (σ1 = maximum, σ2 = intermediate and σ3 = minimum) as well as a relative stress magnitude , 0 < φ < 1. These parameters are determined by finding the best-fitting stress tensor to the observed focal mechanisms. Assumptions that need to be fulfilled by the input data are: (1) stress is uniform in each zone of investigation during the observed time interval, (2) the earthquakes are shear-dislocations on pre-existing faults and (3) slip occurs in the direction of the resolved shear stress on the fault plane. On the other hand, the Gauss method involves the concept of the best-fit stress tensor. Here in this algorithm, a new function called “compatibility function” is defined as a Gaussian function that depends on the compatibility measure taking into account both angular misfit between the resolved shear stress and actual direction of movement on the fault plane, and the ratio between the normal and shear stress on the fault plane. The detailed description can be found in Zalohar and Vrabec (Citation2007). As in such studies confidence level is intended to give the assurance whether the statistical model is correct or not, the stress inversion results which satisfy 95% confidence level have been considered.
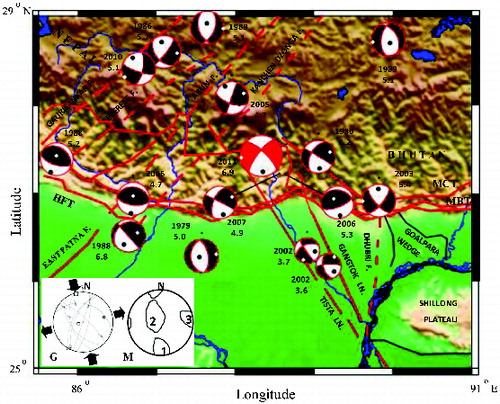
Sixteen available fault-plane solutions in the region are used to estimate the dominant regional tectonic stresses. The 16 solutions include 14 CMT solutions of earthquakes Mw ≥ 4.9 (www.usgs.gov) and two waveform inversion solutions of smaller events Mw ∼ 3.6–3.7 computed by Baruah et al. Citation(2012b). For both methods, the inversion results are very consistent and show a NNW–SSE horizontal compressional stress and an ESE–WSW low angle or near horizontal tensional stress ( and . Such stress system is conducive for dominant strike-slip faulting, although we observe a few other (normal and thrust) fault-plane solutions in the region due to complex tectonics and intersecting faults.
Table2. Results of stress tensor inversion using Michael and Gauss methods.
Figure3. Map shows all the 14 CMT fault-plane solutions available in the area and two waveform inversion solutions of smaller earthquakes of 2002 from Baruah et al. (Citation2012b). The years of occurrence and respective Mw are annotated. In the inset, the G and M indicate the stress inversion results by Gauss and Michael methods, respectively. Principal stress axes with their 95% confidence limits are plotted on lower hemisphere stereonets. The compression and tensional stress axes are indicated by arrows in G, and by 1 and 3 symbols in M, respectively. The intermediate axis is near vertical in both the solutions. The blue line indicates river system.
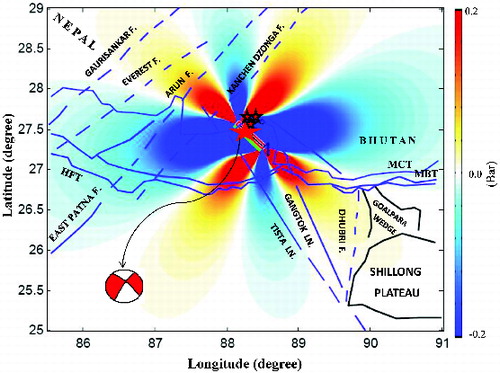
We further examined the Coulomb static stress change ΔSf using the CMT solution of the main shock. Coulomb 3.2 software (http://earthquake.usgs.gov/research/modeling/coulomb/) has been used for the computation of the Coulomb stress pattern. We use NW–SE fault plane as the causative fault plane for the earthquake with the strike of 313°, dip of 73°, rake −163° and moment magnitude of 6.9. We present here the map of Coulomb stress change at the hypocentral depth i.e. at 50 km (e.g. Ma et al. Citation2005; Gahalaut Citation2006, etc.). The Coulomb stress change is defined as (e.g. King et al. Citation1994; Stein et al. Citation1994; Toda et al. Citation1998***), where
is the shear stress change resolved on a given failure plane (assumed to be positive in the direction of fault slip),
is the normal stress change, positive if compressive and
is the effective coefficient of friction, calculated from
, where B is the Skempton's coefficient varying between 0 and 1. Skempton's coefficient B is defined as the ratio of the induced pore pressure to the change of stress loading under undrained condition (Skempton Citation1954). It can also be explained by the compressibility of rock and pore fluid (Brown & Korringa Citation1975; Zhang et al. Citation2009). We computed the stress change in an elastic half space considering a uniform slip model (eg. Gahalaut Citation2006) on a rectangular fault (here, Tista lineament is taken as the receiver fault with its NW–SE orientated plane as the causative fault plane) taken at the respective depth assuming a shear modulus of 3.32 × 10¹⁰ dyne-cm2, a Possion's ratio of 0.25 and an effective coefficient of friction of 0.4 (Stein et al. Citation1994). Failure is encouraged if
is positive and discouraged if it is negative. Thus, aftershocks are expected to occur in the zone of increased
, which is the case for all four felt aftershocks (M ≥ 4.0; see ). We expect most of the smaller and felt stronger aftershocks within this increased
zone.
Figure4. Change in Coulomb static stress on optimally oriented strike-slip plane due to slip on the rupture of the 18 September 2011 earthquake Mw 6.9. The hot colours (red) indicate the increase in coulomb stress and the light colour (blue colours) indicate the decrease in stress.
5. Conclusions
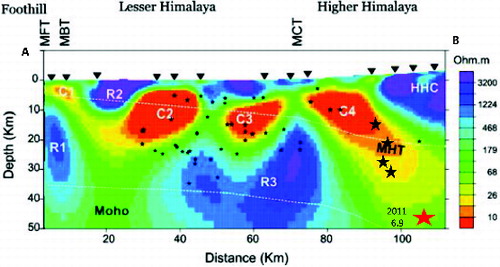
The study clearly indicates that the 18 September 2011 Sikkim Himalaya strong earthquake (Mw 6.9) and its four significant aftershocks (M ≥ 4.0) occurred on a near vertical deeper (10–50 km) fault zone in a strike-slip faulting regime. Plane of detachment shallow thrust faulting earthquakes as envisaged in the HSB tectonic model is not evident in the Sikkim Himalaya and in its foot hills region. The August 1988 strong earthquake of similar magnitude (mb = 6.9 and Mw = 6.8) also occurred at larger depth (53 km) beneath the foothills of the eastern Himalaya showing a strike-slip mechanism ( and ). Generally, earthquake occurs in the structure having heterogeneous resistivity (high or low resistivity zone) and more competent zone where stress is concentrated (Ichihara et al. Citation2008). The magnetotelluric study of Patro and Harinarayana (Citation2009) shows a low resistive zone near the source zone of 2011 Sikkim earthquake and its aftershock region (. The receiver function analysis of Acton et al. (Citation2011) also exhibits the existence of secondary topography under Darjeeling–Sikkim Himalaya where the Moho continues to dip to the north. Thus, the extent of vertical fault zone in Sikkim Himalaya is well supported by the low-resistivity region as well as the depth section plot of the hypocentres and secondary topography. However, other geophysical studies like GPR survey, resistivity survey, etc. could give more evidences regarding the existence of vertical structure in Sikkim Himalaya which may be a scope of future studies.
Figure5. Deep geoelectric structure obtained from two-dimensional inversion of magnetotelluric data (after Patro & Harinarayan Citation2009). The red star indicates the 18 September 2011 Sikkim earthquake and small black stars indicate the aftershocks which are plotted with respect to. the profile AB (see ).
The NE and NW trending long and deep transverse intersecting faults that cut across the region from foredeep to the High Himalaya play an important role on seismotectonics of the region. Shear failures on the transverse faults oblique to the direction of regional compressional stress, as it is happening in the eastern Himalaya, may be explained by dynamics of faulting (Anderson Citation1951; Dasgupta et al. Citation1987).
Stress inversion shows that in Sikkim Himalaya and its vicinity, the direction of horizontal compressive stress is along NNW–SSE direction and that of the horizontal tensional stress along ESE-WSW direction (). This tectonic pattern is favouring for strike-slip faulting earthquakes in the region. The Coulomb stress change map indicates that the four felt aftershocks occurred within the zone of increased ().
In a recent GPS survey, Bilham et al. (Citation1998) reported that all the segments of Himalaya attained enough stress level to trigger strong or great earthquake(s) in any segment anytime, and they further advocated that among all the segments, the Sikkim Himalaya segment is most vulnerable for an impending large earthquake as it had not ruptured in the past. The 18 September 2011 Sikkim Himalaya strong earthquake is thus not a surprise to the Earth scientists; its strike-slip CMT solution with a centroid depth at 47 km shed new light to our understanding of the Himalayan earthquakes that are of unique characteristic in each tectonic block, not uniform all along the entire Himalaya as envisaged in the HSB tectonic model.
Acknowledgements
We gratefully acknowledge the kind and long funding support of the Department of Science and Technology (DST), New Delhi, and the Russian Academy of Sciences (RAS), Moscow, for continuing our Indo-Russian collaboration, presently the DST- RFBR (Russian Foundation for Basic Research) project (no.11-05-92694). We sincerely thank Prof. A Gliko, Director, Institute Physics of the Earth (IPE), Moscow, and Dr D. Ramaiah, Director, North East Institute of Science and Technology (NEIST), CSIR Laboratory, Jorhat, for giving us all facilities and logistic support for carrying out the collaborative research. We are thankful to Dr Sebastiano D’Amico, Department of Physics, Malta University, for his kind review. The two anonymous reviewers are also gratefully acknowledged for their kind suggestions and for constructive comments. The first author is grateful to Council of Scientific & Industrial Research, Govt. of India, for providing CSIR-RA fellowship.
Related Research Data
References
- Acharya SK, Sastry MVA. 1979. Stratigraphy of Eastern Himalaya. Geol Surv India Misc Publ. 41:49–67.
- Acton CE, Priestley K, Mitra S, Gaur VK. 2011. Crustal structure of the Darjeeling–Sikkim Himalaya and southern Tibet. Geophys J Int. 184:829–852.
- Allègre CJ, Courtillot V, Tapponnier P, Hirn A, Mattauer M, Coulon C, Jaeger JJ, Achache J, Schärer U, Marcoux J, et al. 1984. Structure and evolution of the Himalaya-Tibet orogenic belt. Nature. 307:17–22.
- Anderson EM. 1951. The dynamics of faulting and dyke formation with applications to Britain. 2nd ed. London: Oliver and Boyd.
- Angelier J. 1975. Sur l’analyse de mrsures recueillies dans des sites failles: l’utilite d’une conformation entre les methods dynamiques et cinematiques. C R Acad Sci Paris, D. 284:1805–1808.
- Angelier J. 1989. From orientation to magnitudes in paleostress determination using fault slip data. J Struct Geol. 11:37–50.
- Angelier J. 2002. Inversion of earthquake focal mechanisms to obtain the seismotectonic stress, IV: a new method free of choice among nodal planes. Geophys J Int. 150:588–609.
- Angelier J, Baruah S. 2009. Seismotectonics in northeast India: a stress analysis of focal mechanism solutions of earthquakes and its kinematic implications. Geophys J Int. 178:303–326.
- Banghar AR. 1991. Mechanism solution of Nepal-Bihar earthquake of August 20, 1988. J Geol Soc India. 37:25–30.
- Baruah S, Baruah S, Bora P, Duarah R, Kalita A, Biswas R, Gogoi N, Kayal JR. 2012a. Moment magnitude (MW) and local magnitude (ML) relationship for earthquakes innortheast India. Pure Appl Geophys. 169:1977–1988.
- Baruah S, Baruah S, Kalita A, Biswas R, Gogoi N, Gautam JL, Sanoujam M, Kayal JR. 2012b. Moment magnitude – local magnitude relationship for the earthquakes of the Shillong-Mikir plateau, northeastern India region: a new perspective. Geomatics Nat Hazards Risk. 3:365–375.
- Baruah S, Baruah S, Kayal JR. 2013. State of tectonic stress in Northeast India and adjoining South Asia region. Bull Seismol Soci Am. 103:894–910.
- Bilham R, Frederick B, Rebecca B, Gaur VK. 1998. Geodetic constraints on the translation and deformation of India: implications for future great Himalayan earthquakes. Curr Sci. 74:213–229.
- [BIS] Bureau of Indian Standards-1893. 2002. Indian standard criteria for earthquake resistant design of structures, 458 part 1 – general provisions and buildings. New Delhi: Bureau of Indian Standards.
- Brown RJS, Korringa J. 1975. On the dependence of the elastic properties of a porous rock on the compressibility of the pore fluid. Geophys. 40:608–616.
- Catlos EJ, Dubey CS, Harrison TM, Edwards MA. 2004. Late Miocene movement within the Himalayan main central thrust shear zone, Sikkim, north-east. India J Metamorph Geol. 22:207–226.
- D’Amico S, Gervasi A, Guerra I, Neri G, Orecchio B, Presti D, Totaro C. 2012. Seismicity and focal mechanisms at the Calabro-Lucanian boundary along the Apennine chain (southern Italy), Rend. Online Soc Geol It. 21:778–779.
- D’Amico S, Orecchi B, Presti D, Neri G, Wu WN, Sandhu I, Zhu L, Herrmann RB. 2013. Source parameters of small and moderate earthquakes in the area of 2009 L’Aquila seismic sequence (central Italy). Phys Chem Earth. 63:77–91.
- D’Amico S, Orecchio B, Presti D, Zhu L, Herrmann RB, Neri G. 2010. Broadband waveform inversion of moderate earthquakes in the Messina straits, southern Italy. Phys Earth Planetary Inter. 179:97–106.
- Dasgupta S, Mukhopadhyay B, Mukhopadhyay M, Nandy DR. 2013. Role of transverse tectonics in the Himalayan collision: further evidences from two contemporary earthquakes. J Geol Soc India. 81:241–247.
- Dasgupta S, Mukhopadhyay M, Nandy DR. 1987. Active transverse features in the central portion of the Himalaya. Tectonophysics. 136:255–264.
- De R, Kayal JR. 2003. Seismotectonic model of the Sikkim Himalaya: constraint from microearthquake surveys. Bull Seismol Soc Am. 93:1395–1400.
- De R, Kayal JR. 2004. Seismic activity at the MCT in Sikkim Himalaya. Tectonophysics. 386:243–248.
- Engdahl ER, van der Hillst R, Buland RP. 1998. Global teleseismic earthquake relocation with improved travel times and procedures for depth determination. Bull Seismol Soc Am. 88:3295–3314.
- Gahalaut VK. 2006. 2005 Kashmir earthquake: not a Kashmir Himalaya seismic gap event. Curr Sci. 90:507–508.
- [GSI] Geological Survey of India. 1993. Bihar-Nepal earthquake, August 20, 1988. In: Nandy DR, Choudhury AK, Chakraborty C, Narula PL, editors. Kolkata: Geological survey of India, Special Pub. 31; p. 1–104.
- [GSI] Geological Survey of India. 2000. Seismotectonic Atlas of India and its environs. In: Narula PL, Acharya SK, Banerjee J, editors. Kolkata: Geological survey of India, Special Pub.; p. 86.
- Holt WE, Ni JF, Wallace TC, Haines AJ. 1991. The active tectonics of the eastern Himalayan syntaxis and surrounding regions. J Geophys Res. 96:14,595–14,632.
- Ichihara H, Honda R, Mogi T, Hase H, Kamiyama H, Yamay Y, Ogawa Y. 2008. Resistivity structure around the focal area of the 2004 Rumoi-Nanbu earthquake (M 6.1), northern Hokkaido, Japan. Earth Planets Space. 60:883–888.
- INTACH. 2012. Earthquake damage assessment vulnerability of Sikkim's built heritage, Indian National Trust for Art and Cultural Heritage, New Delhi. Available from: http://www.intach.org/
- Jain AK, Singh S, Manickavasagam RM, Joshi M, Verma PK. 2003. HIMPROBE program: integrated studies on geology, petrology, geochemistry and geophysics of the Trans-Himalaya and Karakoram. In: Mahadeven TM, Arora BR, Gupta KR, editors. Indian continental lithosphere: emerging research trend. 53. Bangalore: Geological Society of India.
- Joshi A, Kumari P, Singh S, Sharma ML. 2012. Near-field and far-field simulation of accelerograms of Sikkim earthquake of September 18, 2011 using modified semi-empirical approach. Nat Hazards. 64:1029–1054.
- Joshi KC, Sengupta S, Kandpal GC. 2010. Macroseismic study of 20th May 2007 Sikkim Earthquake – its seismotectonics implications for the region. J Geol Soc India. 75:383–392.
- Kayal JR. 1996. Earthquake source process in northeast India: a review. J Himalayan Geol. 17:53–69.
- Kayal JR. 2001. Microearthquake activity in some parts of the Himalaya and the tectonic model. Tectonophysics. 339:331–351.
- Kayal JR. 2008. Microearthquake seismology and seismotectonics of South Asia. Germany: Springer; p. 503.
- Kayal JR. 2010. Himalayan tectonic model and the great earthquakes: an appraisal. Geomatics Nat Hazards Risk. 1:51–67.
- Kayal JR, Arefiev SS, Baruah S, Tatevossian R, Gogoi N, Sanoujam M, Gautam JL, Hazarika D, Borah D. 2010. The 2009 Bhutan and Assam felt earthquakes (Mw 6.3 and 5.1) at the Kopili fault in the northeast Himalaya region. Geomatics Nat Hazards Risk. 1:273–281.
- Kayal JR, De R, Chakraborty P. 1993. Microearthquakes at the main boundary thrust in eastern Himalaya and the present day tectonic model. Tectonophysics. 218:375–381.
- Kayal JR, Ram S, Singh OP, Chakraborty PK, Karunakar G. 2003. Aftershocks of the March 1999 Chamoli earthquake and seismotectonic structure of the Garhwal Himalaya. Bull Seismol Soc Am. 93:109–117.
- King GCP, Stein RS, Lin J. 1994. Static stress changes and the triggering of earthquakes. Bull Seismol Soc Am. 84:935–993.
- Ma KF, Chan CH, Stein RS. 2005. Response of seismicity to Coulomb stress triggers and shadows of the 1999 Mw = 7.6 Chi-Chi, Taiwan, earthquake. J Geophys Res. 110:B05S19, doi:10.1029/2004JB003389
- Mahajan AK, Gupta V, Thakur VC. 2012. Macroseismic field observations of 18 September 2011 Sikkim earthquake. Nat Hazards. 63:589–603.
- Michael AJ. 1984. Determination of stress from slip data: faults and folds. J Geophys Res. 89:11517–11526.
- Michael AJ. 1987. Stress rotation during the Coalinga aftershock sequence. J Geophys Res. 92:7963–7979.
- Mohan A, Windley BF, Searle MP. 1989. Geothermobarometry and development of inverted metamorphism in the Darjeeling–Sikkim region of the eastern Himalaya. J Metamorph Geol. 7:95–110.
- Monsalve G, Sheehan AF, Pandey MR, Rajanre S, Wu F. 2006. Seismicity and 1-D velocity structure of the Himalayan collision zone: results from the Himalayan Nepal Tibet SeismicExperiment (HIMNT). J Geophys Res. 111:B10301, doi:10.1029/2005JB004062
- Mukhopadhyay M. 1984. Seismotectonics of transverse lineaments in the eastern Himalaya and its foredeep. Tectonophysics. 109:227–240.
- Nakata T. 1989. Active fault of the Himalayas of India and Nepal. In: Malinconico Jr. LL, LillieR, editors. Tectonics of Western Himalayas. Geological Society of America. SpecialPaper, 232; p. 243–264.
- Nath SK, Vyas M, Pal I, Sengupta P. 2005. A seismic hazard scenario in the Sikkim Himalaya from seismotectonics, spectral amplification, source parameterization, and spectral attenuation laws using strong motion seismometry. J Geophys Res. 110:B01301, doi:10.1029/2004JB003199
- Ni J, Barazangi M. 1984. Seismotectonics of the Himalayan collision zone: geometry of the underthrusting Indian plate beneath the Himalaya. J Geophys Res. 89:1147–1163.
- Patro P, Harinarayana T. 2009. Deep geoelctric structure of the Sikkim Himalaya (NE India) using magnetotelluric studies. Phys Earth Planetary Inter. 173:171–176.
- Pradhan R, Prajapati S, Chopra S, Kumar A, Bansal BK, Reddy CD. 2013. Causative source of Mw 6.9 Sikkim-Nepal border earthquake of September 2011: GPS baseline observations and strain analysis. J Asian Earth Sci. 70–71:179–192.
- Rai DC, Singhal V, Mondal G, Parool N, Pradhan T, Mitra K. 2012. The M 6.9 Sikkim(India–Nepal Border) earthquake of 18 September 2011. Curr Sci. 102:1437–1446.
- Rajendran K, Rajendran CP, Thulasiraman N, Andrews R, Sherpa N. 2011. The 18 September 2011, north Sikkim earthquake. Curr Sci. 101:1475–479.
- Ravi Kumar M, Hazarika P, Prasad GS, Singh A, Saha S. 2012. Tectonic implications of the September 2011 Sikkim earthquake and its aftershocks. Curr Sci. 102:788–792.
- Seeber L, Armbruster JG, Quittmeyer R. 1981. Seismicity and continental subduction in the Himalayan Arc. In: Gupta HK, Delany FM, editors. Zagros, Hindu Kush, Himalaya, geodynamic evolution, geodynamics series. Washington (DC): American Geophysical Union; p. 215–242.
- Sengupta A, Gupta S, Anbarasu K. 2010. Landslides – investigations and mitigation in eastern Himalayan region. J Indian Roads Congr. Paper No. 560, 133–142.
- Sharma ML, Sinvhal A, Singh Y, Maheshwari BK. 2013. Damage survey report for Sikkim earthquake of 18 September 2011. Seismol Res Lett. 84:49–56.
- Singh DD, Gupta HK. 1980. Source dynamics of two great earthquakes of Indian Subcontinent: the Bihar-Nepal earthquake of January 15, 1934 and the Queta earthquake of May 30, 1935. Bull Seismol Soc Am. 70:757–773.
- Skempton AW. 1954. The pore water coefficient A and B. Geotechnique. 4:143–147.
- Stein RS, King GCP, Lin J. 1994. Stress triggering of the 1994 M = 6.7 Northridge, California earthquake by its predecessors. Science. 265:1432–1435.
- Thakur VC, Mahajan AK, Gupta V. 2012. Seismotectonics of 18 September 2011 Sikkim earthquake: a component of transcurrent deformation in eastern Himalaya. Himalayan Geol. 33:89–96.
- Tiwari VM, Vyghreswara Rao MBS, Misra DC, Singh B. 2006. Crustal structure across Sikkim, NE Himalay from new gravity and magnetic data. Earth Planet Sci Lett. 247:61–69.
- Toda S, Stein RS, Reasenberg PA, Dieterich JH. 1998. Stress transferred by the Mw = 6.5 Kobe, Japan, shock: effect on aftershocks and future earthquake probabilities. J GeophysRes. 103:24543–24565.
- Zhang Y, Huang F, Lai G. 2009. Research on Skempton's coefficient B based on the observation of groundwater of Changping station. Earthquake Sci. 22:631–638.
- Zalohar J, Vrabec M. 2007. Paleostress analysis of heterogeneous fault-slip data: the Gauss method. J Struct Geol. 29:1798–1810.