
 ?Mathematical formulae have been encoded as MathML and are displayed in this HTML version using MathJax in order to improve their display. Uncheck the box to turn MathJax off. This feature requires Javascript. Click on a formula to zoom.
Abstract
The Kalsi-Chakrata road corridor, located in the Lesser Himalayas, experiences several landslides every year, resulting in a considerable amount of damage to roads, assets, and other infrastructure and even loss of lives. During the monsoon season (June–August), the disruption of routes due to landslide resulted in economic losses and barred villagers from accessing critical and essential facilities, thus impacting the livelihood of the communities residing along the road corridor. Hence immediate requirement was to systematically assess the landslide susceptibility for the study area that would support in the preparation of the planning and mitigation goal, both short and long term. The present study adopted the fuzzy analytic hierarchy process (fuzzy AHP) method integrated with geospatial technology that may be highly effective for landslide susceptibility assessment in the landslide-prone Lesser Himalayas. The use of validated landslide inventory data and high-resolution remote sensing images for selection and mapping of landslide conditioning factors gratifies the geospatial aspect of local variations across the Kalsi-Chakrata road corridor. For fuzzy AHP model setup, prominent landslide contributing factors viz., slope, aspect, altitude, lithology, proximity to road, fault & drainage, Stream Power Index (SPI), Topographical Wetness Index (TWI), rainfall, land use/land cover (LULC), soil, and seismicity, were mapped and classified into significant classes. The resultant landslide susceptibility map (LSM) shows that about 55% (45.23 km2) of the study area was categorized as a very high and high landslide susceptibility zone. Of this, about 21% (17.7 km2) was within very high LSM zone, while 33% (27.5 km2) fell under high landslide susceptibility categories. Approximately 17.6% (14.5 km2) areas fall within the moderately susceptible zone, where chances of future landslides may be amplified without periodic observation and prospective study. At the village level, it was observed that Jhutaya village, located nearer foothill of Lesser Himalayas, is most susceptible to landslide followed by Dhaira, Chapanu, and Sairi villages. The fuzzy AHP model shows 86.52% accuracy in landslide prediction evaluated through the ROC curve (at 95% confidence level). Hence, the output LSI may be referred by the planners and engineers for monitoring, prevention, and mitigation of landslide hazards and development of infrastructure in the Kalsi-Chakrata road corridor, and the fuzzy AHP methodology adopted may be applied in other areas of the Lesser Himalayas.
1. Introduction
In the Himalayan terrain, landslides are among the most common natural hazards that carry a significant threat to the socio-economic development in an area and the life and livelihood of the communities residing in those mountainous regions. The statistics published by the Geological Survey of India (GSI) shows that about 0.14 million sq km area in North West Himalayas (Uttarakhand, Himachal Pradesh, and Jammu & Kashmir) are prone to landslide hazard. It is estimated that approximately 13% of Indian land has witnessed landslide events that had caused a loss of over 4.5 million USD (Thai Pham et al. Citation2018). During the monsoon season (June–August), large numbers of landslides are triggered in the Himalayan mountain chain due to its unique geological setup and tectonic movements. The steep slopes, deep weathering of substrata, and intense southwest Monsoon rainfall in the Lesser and the Middle Himalayas in conjunction develop complex geological conditions that are favorable for the frequent occurrence of landslides (Gabet et al. Citation2004; Ambrosi et al. Citation2018). In Uttarakhand, a northern state of India, the landslides are among the most critical natural hazards that cause considerable damages every year. Most often triggered either by heavy precipitation and earthquakes, or anthropogenically due to heavy vehicles' movement or, usually, human activities on unstable slopes. In addition to rugged terrain, high seismicity, and climatic phenomena that are the main triggering factor for landslide occurrence (Kwan et al. Citation2014; Li et al. Citation2014), the hydro-geological conditions, and anthropogenic activities are among the key elements that too strongly influence the landslide occurrences in the Himalayan region of India (Rai et al. Citation2014; Singh et al. Citation2020).
The Himalayas are an extensive range of landmass shadowing the subcontinent of India that differs from one region to another regarding topography, climate, soils, and rock types. The seismically active Lesser Himalaya, a comparatively recent formation, is bounded by two tectonic planes, i.e., the Main Central Thrust (MCT) in the north and the Main Boundary Thrust (MBT) in the south. Due to intense folding and faulting, this rugged and hilly terrain is highly fractured, sheared, less consolidated, and highly weathered (Pachauri Citation2010). Moreover, compared to other Himalayas regions, the Lesser Himalayas experience a higher degree of human interference through construction activities, cultivation, deforestation, construction of roads cutting the slopes, more vehicular movements, mining, and other economic activities. These factors make the Lesser Himalayan terrain fragile and weak and often aggravate landslides phenomena, particularly during the Monsoon (Khanduri Citation2017).
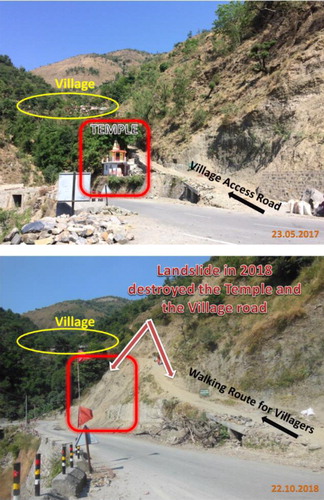
Located in the Lesser Himalayas on the right bank of Amlana River, the Chakrata-Kalsi road corridor is 42 km long corridor situated in the western part of the Dehradun district of Uttarakhand state bordering with Himachal Pradesh. This road corridor well connects the famous hill station of Chakrata with the neighboring densely populated northern plains. During the southwest monsoon season (July–September) every year, the Kalsi-Chakrata road corridor experiences several landslides that incur a considerable amount of damage to roads, buildings, and other assets, even loss of lives. Some of these landslides are even recurring every year (e.g., Amroha landslide). The incidents reported in the national and local newspapers show that this road corridor is frequently blocked by landslide debris in July and August every year. The most common types of landslides in this area include debris slide, debris flow, rock slide, and rockfall. Besides direct damages in the form of property loss and infrastructure disruption, the indirect damages due to landslide include disruption of road transport, interruption, and losses in economic activities (rotten fruits and vegetables) and livelihood of the communities residing in those areas. Significantly, blocked, and sometimes washed out village roads left the mountain communities in a challenging situation barred from access to critical and essential facilities ().
Figure 1. Landslide in 2018 razed the village access road and temple near Amroha.
In the last two decades, the Lesser Himalayas has witnessed a substantial increase in developmental activities, which was proven to be disastrous, coupled with extreme climate events (Allen et al. Citation2016). Therefore, the requirement was obvious to conduct a thorough investigation at a finer resolution applying a reliable statistical technique. It was observed that the area, particularly between Kalsi and Sahiya town, experienced recurring landslides every year, disrupting the road connectivity and often bringing the life to a complete stand-still. The literature survey available on landslides in the Kalsi-Chakrata road corridor reveals that so far, no in-depth and holistic scientific research has been conducted for this area except one published paper on terrain classification and land hazard mapping (Choubey and Litoria Citation1990). The present investigation was carried out at a sub-regional scale by generating base maps for land hazard evaluation using only five conditioning factors. Hence, to fill in the voids, it is necessary to assess detailed landslide susceptibility applying advanced and predictive contemporary statistical models using advanced geospatial techniques to detect the landslide susceptible areas that require immediate attention.
The predictions associated with landslide studies are always subjected to certain degrees of uncertainties. Hence, investigations concerning ‘when’ ‘where’ and ‘what magnitude’ is considered crucial aspects of prediction (Singh and Sharma Citation2015). In this regard, the landslide susceptibility mapping (LSM) may be a significant step towards landslide management and mitigation. It effectually helps to delineate the spatial distribution of probable landslide occurrences. The investigation of LSM has been carried out using different prediction methods worldwide, however, their accuracy and predictability vary widely (Chen et al. Citation2016). Therefore, it is notable to select a present-day approach that locally addresses the landslide issues considering the above speculation. There has been quite a lot of proper research works conceded in the prior two decades to assess landslide susceptibility based on both qualitative and quantitative methods (Varnes Citation1984; Guzzetti et al. Citation1999; Pradhan and Lee Citation2010; Tien Bui et al. Citation2012, Citation2015; Thai Pham et al. Citation2017; Marinos et al. Citation2019). In recent years, statistical and heuristic landslide prediction models integrated with Geographic Information System (GIS) have been instrumental for improved mapping of hazard footprints. More often, it includes modeling approaches, for example, multi-criteria evaluation, index of entropy, weights of evidence, statistical information value, linear and logistic regression, discriminant analysis, frequency ratio, fuzzy systems, and neuro-fuzzy models, neural networks, random forests (Guzzetti et al. Citation1999; Lee and Pradhan Citation2007; Tien Bui et al. Citation2015; Chen et al. Citation2017; Thai Pham et al. Citation2017; Ambrosi et al. Citation2018; Noorollahi et al. Citation2018; Taalab et al. Citation2018; Sur and Singh Citation2019; Sharma et al. Citation2020; Singh et al. Citation2020). It should be kept in consideration that the reliability and accuracy of LSM of a particular area depend on the spatial and temporal frequency of landslides and the modeling methodologies adopted (Glade Citation2001, Pellicani et al. Citation2014, Wang et al. Citation2020).
Saaty introduced the analytic hierarchy process (AHP) as a valued tool for multi-criteria decision-making (MCDM) adopted as a thriving natural resource management technique and environmental and ecological impact assessment. Literature shows that AHP can be successfully applied in natural resource management, ecological studies, susceptibility mapping, planning, and development (Saaty Citation1990; Ouma and Tateishi Citation2014; Hanine et al. Citation2016; Mallick Citation2016). However, in practice, while dealing with complex natural environments, the crisp data are often found inadequate to represent the system's relationships and uncertainties (Mallick et al. Citation2018). In the fuzzy AHP method, the pairwise comparisons or two-dimensional priority matrix through a linguistic variable are performed for both criteria and the alternatives. Such pairwise comparisons are represented by triangular numbers (Ayhan Citation2013; Mallick et al. Citation2018). Hence, in many cases, the experts prefer to choose intermediate pairwise comparison ratings for factors in AHP instead of definite ratings because, in complex natural systems, the evaluation method of fuzzy set theory shows a better representation of human experiences, judgments, and thinking styles addressing real-world complications (Gorsevski and Jankowski Citation2010; Hanine et al. Citation2016). Zadeh (Citation1965) introduced the fuzzy set theory as a tool to address complex problems. The fuzzy set theory is based on a membership degree for specific attributes of interest known as membership function (Shahabi et al. Citation2012). Because of this, the application of the theory can be found in many disciplines such as data processing, artificial intelligence, decision support, engineering, medicines, expert systems, operational research, and others (Zimmermann Citation1992). Over the years, fuzzy AHP has evolved as an imperative MCDM technique in a fuzzy environment where the best choices can be selected. The weight of criteria can be determined according to pairwise comparisons and hierarchical relationships between criteria (Mallick et al. Citation2018). In this study, the fuzzy set theory was adopted to determine the fuzzy membership function (MF) based on the conditioning factors' spatial relationships.
Several procedures are discussed in various literature to compute the factor weights using the fuzzy AHP technique (Bozbura et al. Citation2007). Laarhoven and Pedrycz (Citation1983) were among the researchers who applied fuzzy AHP for the first time. Among the successors, Buckley (Citation1985), and later Chang (Citation1996) were phenomenal. Chang introduced a new method based on the degree of probabilities of each criterion using triangular numbers in a pairwise comparison. The next step is to develop a pairwise construction matrix. This task is carried out for a particular level on the hierarchy by placing triangular fuzzy values for the linguistic variables. By comparing each couple, membership functions are then constructed, and the intersections' are determined. The membership value here represents the degree of possibility of the value. The minimum degree of possibility of the situation defines a particular criterion's weight. Subsequently, weights for each criterion are normalized to get the final weights (also known as final importance degrees) for the hierarchy level (Chang Citation1996). The literature review suggests that LSM generated through the AHP technique was adopted quite frequently by the researchers due to easier understanding and computation. The author observed much literature on applying the AHP technique on LSM in India; however, using the fuzzy AHP technique in this context was less, incredibly scarce for the Himalayas. Moreover, although multiple LSM studies are conducted for Uttarakhand's main highways connecting the "four abodes," scientific research lacks smaller road corridors such as Kalsi-Chakrata are experiencing frequent landslides every year. Hence, the effort has been made to conduct a detailed investigation to delineate landslide susceptible areas applying a GIS-based fuzzy AHP approach following Chang's techniques. The outcome of this study provides a substantial prediction of future landslide susceptible areas in the Kalsi-Chakrata road corridor that can help decision-makers and planners emphasize on appropriate mitigation measures that can lead to the prospective future economic growth of the area.
2. Study area
The Kalsi-Chakrata road corridor lies in the Lesser Himalayan ranges at the western end of the Central Himalayas. Chakrata (2,118 m above mean sea level) is a small hill station and a famous tourist destination, and Kalsi is primarily a tiny Cantonment Town located in the bank of river Yamuna in the foothill of the Lesser Himalayas. The Kalsi-Chakrata road corridor is about 42 km long and located in the Dehradun district of Uttarakhand state (). The state highway starts ascending from Kalsi towards Chakrata. The road corridor is linked with Dehradun (Capital of Uttarakhand state) and Saharanpur (a market hub in Uttar Pradesh state) through Vikasnagar-Kalsi road.
Figure 2. Location of the Study Area.
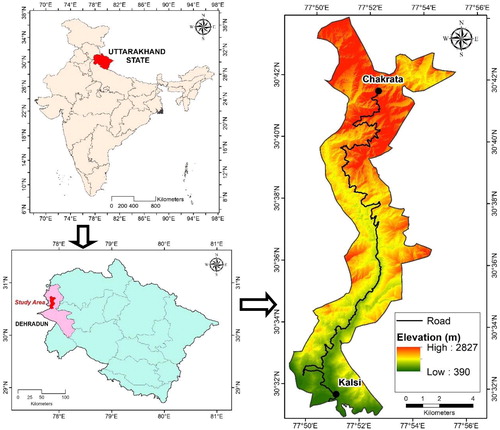
The study area's whole terrain has a very rugged topography with altitude varying from 433 m near Yamuna River and 2456 m near Chakrata town (mean = 1445 m, std. dev. = 585 m). The temperature ranges from 1.4° C in winter to 34° C in summer, with an average annual rainfall varies between 1,339 cm and 1,479 cm. The study area typically experiences three seasons. The winter season starts in October and ends in February, and the summer months extend from March to June. The rainy season begins in July, and it ends in September. Often this area gets heavy rainstorms, sometimes cloudbursts, in July and August, which cause lots of damages resulting in erosion, floods, and landslides. The road corridor is situated in the Siwalik and Middle Himalayas, one of the most seismically active regions. The geology, structures, and lithology of the area have been mapped using geological maps acquired from GSI. In the study area, the outer sedimentary belt consists of the Krol belt, while the inner belts constitute thick sequences of unmetamorphosed sediments. There are seven geological formations observed in the study area, of which the Jaunsar group is the predominant formation that covers more than 90% of the geographical area. During the field investigation, the Mandhali-Chakrata Formation (Proterozoic II) and Chandpur Formation (Proterozoic III lower), where most of the landslides occur, were studied concerning other landslide conditioning factors. The Main Boundary Thrust (MBT), passes through the road corridor, can be distinguished after crossing Kalsi town moving towards Chakrata.
In this study, 34 Census villages and one municipal corporation (Chakrata) intersect with the Kalsi-Chakrata road corridor, have been considered for susceptibility mapping. According to the Census of India (2011) village boundary, the study area spreads over more than 80 sq. Km. with more than 19,679 persons residing in 3,961 households. Agriculture and social forestry play an essential part of livelihood among the villagers. The fruits and vegetables produced here have been transported to the nearby wholesale market in Saharanpur, further connected with the large vegetable market of Delhi.
3. Data, materials and methods
In any LSI study, the first important step is to detect the past and the present landslide locations in an area, followed by the determination of conditioning factors such as terrain, geology, hydrology, climate, and anthropogenic activities that are liable to contribute to the occurrence of landslides (Guzzetti et al. Citation2012; Deng et al. Citation2017; Ambrosi et al. Citation2018). Next, based on literature review and field data analysis, the critical conditioning factors (geo-environmental factors) that might have been responsible for triggering a past landslide have been identified for further consideration in predictive models (Marinos et al. Citation2019). The geo-environmental factors commonly considered for LSM include terrain, geology, hydrology, climate, and anthropogenic activities (Wang et al. Citation2019). More emphasis was put to select the high resolution and latest vintage landslide conditional data layers from authentic sources judiciously. These data were duly validated before inclusion in the chosen statistical model through available literature and published open-source information. The following sub-sections briefs the data and materials used and the methodology adopted for fuzzy AHP based LSM:
3.1. Data types, resolution and sources
The data types for various conditioning factors and their resolution, vintage and sources used in this study are the following ().
Table 1. Data and materials used with their resolution and sources.
3.2. Landslide inventory mapping
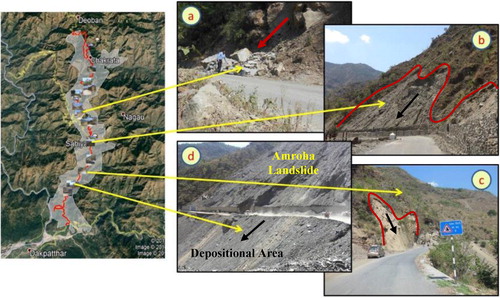
The landslide inventory dataset helps to understand the factors or conditions that might be accountable for triggering a past landslide or signify the incidence of an active landslide (Marinos et al. Citation2019). In this study, an extensive landslide inventory dataset was prepared using two primary sources: (1) the landslide records collected from the GSI portal (http://bhukosh.gsi.gov.in/Bhukosh/Public) and the Public Works Department (PWD), Uttarakhand; (2) identification of possible past landslide events from higher resolution periodic earth observation data (LISS-IV satellite images captured in March 2017 and Google Earth satellite images between the year 2001 and 2017). The landslide extent was delineated as precisely as possible, along with metadata for future use. The records collected in this process were examined through extensive field surveys mostly along the road corridor, including the connecting village roads using the Global Positioning System (GPS) instrument and geo-tagged camera during the Monsoon and post-Monsoon periods (). It was observed that the most common types of rain-induced landslides in this area include debris slide, debris flow, topple failure, rock slide, and rockfall. The landslide inventory comprises the type of movement, type of material, the slide's dimension, the damages/losses caused by past events. The most widespread and threatening landslide in the area was observed in Amroha, a rotational slide with steep slopes and road undercut areas. The analysis of satellite images and ancillary reports from PWD shows that the Amroha landslide has increased by more than ten times in size over the past two decades and presently covering an area of about 0.05224 sq km. For both modeling and validation, the landslide point locations (demarcated at the centroid of the delineated landslide areas) were used. Though there are no standard procedures for the choosing the training dataset (for model preparation) and validation dataset (for verification of model’s performance) (Guzzetti et al. Citation2012), however, the most commonly practiced ratio is 70/30 for training and validation samples (Tsangaratos and Ilia Citation2016, Deng et al. Citation2017, Nachappa et al. Citation2020). The compiled landslide inventory finally comprises 55 records as of June 2019, and these were divided randomly into 38 training data (70% of the inventory) and 17 validation data (30% of the inventory).
Figure 3. Field photographs showing (a) rock fall on Kalsi-Chakrata Highway in 2018 (b) slope instabiliy at a landslide site near Sahiya (2017) (c) warning board (rarely found) for frequent rock fall (2017) (d) major landslide area in Amroha (2017).
3.3. Selection and mapping of landslide conditioning factors
The landslide conditioning factors (also called geo-environmental factors), without any predefined criteria for selection, are picked up based on a thorough literature review, and the numbers may vary from a few factors (Pradhan and Lee Citation2010; Akgun Citation2012) to a large number of factors (Catani et al. Citation2013; Tien Bui et al. Citation2015; Xu et al. Citation2016; Zhang et al. Citation2018; Nachappa et al. Citation2020). In the current investigation, 14 landslide conditioning factors were carefully selected based on hydro-geomorphological characteristics, literature, and expert consultation. These are slope, aspect, rainfall, lithology, normalized differential vegetation index (NDVI), soil, altitude, proximity to road/drainage/fault, seismicity, land-use, and land-cover (LULC), topographic wetness index (TWI), and stream power index (SPI). The conditioning factor thematic layers were arranged from authentic sources using remote sensing and geographic information system (GIS) software with a pixel size of 10 m and categorized applying Jenks natural breaks. Among these factors, the digital terrain model (DTM) was used to produce the thematic layers for topographical parameters such as altitude, slope, aspect, TWI, SPI. The DTM was generated from Cartosat digital elevation model (DEM) (10 m resolution) and LISS-IV satellite images (5 m resolution) in Global Mapper software at a 10 m resolution. The DTM was validated through the Survey of India (SOI) spot heights, GPS reading collected during field visits, and differential global positioning system (DGPS) points already used in other published reports in the Chakrata-Kalsi area. The remaining conditioning factors were generated using ArcGIS 10.8 software from secondary sources selected carefully based on their authenticity, scale, and vintage (). See for all the conditioning factors.
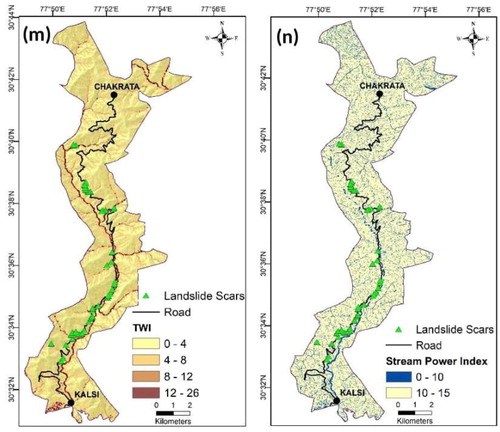
Figure 4. Thematic maps of the conditioning factors used in this study: (a) slope, (b) aspect, (c) Altitude, (d) rainfall, (e) lithology, (f) distance to roads, (g) distance to drainage, (h) distance to fault, (i) NDVI, (j) LULC, (k) seismicity, (l) soil, (m) TWI, (n) SPI.
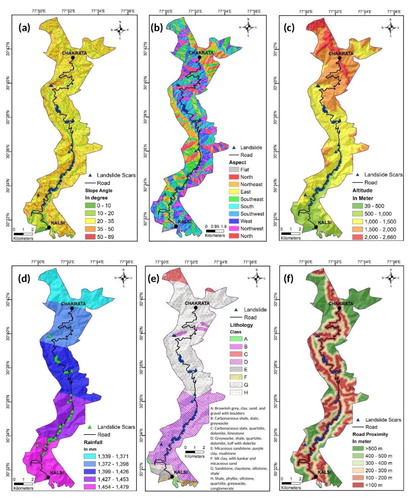
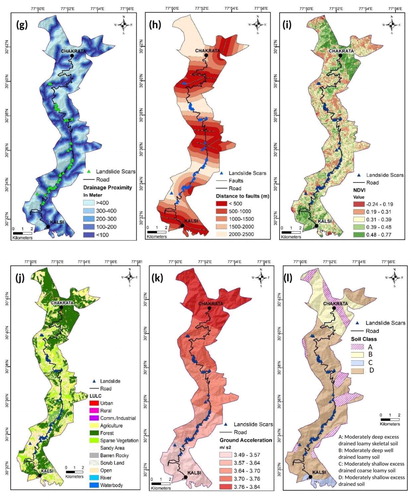
The slope, directly influences shear strength, is one of the most critical factors accountable to the slope failure (Zhang et al. Citation2018; Thai Pham et al. Citation2019; Wang et al. Citation2019). The topographies with steeper slopes are usually more susceptible to failure. The slope angle was produced from the DTM in raster format and categorized into five distinct slope classes of <10°, 10°–20°, 20°–35°, 35°–50°, >50° applying Jenk’s Natural Breaks method.
The aspect has a significant impact on vegetation growth. The vegetation cover retains the soil's moisture capacity, which can instigate landslide (Das et al. Citation2011; Basharat et al. Citation2016). Aspects represent the slope direction. In this study, the aspect map generated from the DTM was classified into nine distinct sub-classes as flat (-1), north (337.5°–360°, 0°–22.5°), northwest(22.5°–67.5°), east (67.5°–112.5°), southeast (112.5°–157.5°), south (157.5°–202.5°), southwest (202.5°–247.5°), west (247.5°–292.5°) and northwest (292.5°–337.5°).
The variation in altitude influences the geomorphological and biological processes and is often attributed to spatial landscape variability (Raja et al. Citation2018; Sur and Singh Citation2019). The elevation may be correlated to different environmental settings, such as fluctuations in rainfall and vegetation types variation. Elevation was categorized into five classes: 39–500 m, 500–1000 m, 1000–1500 m, 1500–2000 m, and 2000–2660 above mean sea level.
For landslide initiation, rainfall is often considered the main triggering factor as it affects slope stability through surface overflow and pore water pressure (Wu et al. Citation2016; Wang et al. Citation2019). The spatiotemporal differences in rainfall quantity and intensity can instigate landslides both over large and small areas (Nachappa et al. Citation2020). The daily rainfall records for eight sub-districts headquarter stations surrounding the road corridor were obtained from the Indian Meteorological Department (IMD) for the past 70 years (from 1947 to 2017). Using the inverse distance weighted (IDW) method in ArcGIS 10.8 software, the mean annual rainfall thematic layer was produced having five classes: 1339–1371 mm, 1371–1398 mm, 1398–1426 mm, 1426–1453 mm, and 1453–1479 mm. It was observed that about 75% of the landslides occurred in the high and very high rainfall classes.
Lithology is another widely accepted and significant conditioning factor in LSM studies (Chen et al. Citation2017). Lithological units determine the strength and permeability of rocks. From the literature, it is evident that landslides often originate along with a rock stratum with less shear strength and less permeability. We have eight lithological units captured from the geological map. One significant observation from the map is the Mandhali-Chakrata Formation and Chandpur Formation that covers large areas along the road corridor containing highly weathered and less amalgamated greywacke rock materials. The investigation also depicted that the majority of past landslides occurred in the Mandhali-Chakrata Formation and Chandpur Formation.
The anthropogenic factors like distance to roads have been considered a vital conditioning factor for landslide occurrence (Meena et al. Citation2019). It has been observed that a considerable number of landslides occur across the road cuts mainly due to slope excavation, additional hydrologic load change, deforestation that affects the stability of the slope (Wang et al. Citation2019). The distance to roads was categorized into six classes: 0–100 m, 100–200 m, 200–300 m, 300–400 m, 400–500 m, and >500 m. The interval was chosen based on the fact that most of the landslides occurred within a distance of 500 m due to road construction activity. In this regard, it may be kept in consideration that there is no standard procedure to determine the distance to roads, drainage, faults as landslide conditioning factor in the literature. By changing the distance to any of these parameters, the output will be different. Hence, based on expert opinion, past studies, and observations during the field investigation, the distance parameters are usually determined for the LSM studies as carried out in this study too.
The distance to drainage controls the slope's stability due to runoff and leads to landslides by eroding slopes (Wang et al. Citation2019). The presence of drainage near landslides has comparatively more impact on landslide initiation than areas located far-off (Bera et al. Citation2019). The effect of streams on the slope failure was correlated using five drainage buffer zones were generated, each 100 m wide, using the Euclidean distance, namely, 0–100 m, 100–200 m, 200–300 m, 300–400 m, and >400 m.
The distance to faults is another influential factor for landslide activities as the tectonic breaks usually reduce the adjacent rock strength (Meena et al. Citation2019). With an increase in distance from faults, the number of landslides decreases sharply (Xu et al. Citation2016; Wang et al. Citation2019). The faults were delineated from the geological map obtained from GSI. The tectonically active Himalayan Main Boundary Thrust (MBT) passes through the road corridor, and the same can be detected passing near to Kalsi across the road corridor. The distance to faults was categorized into an interval of 500 m, namely <500 m, 500–1000 m, 1000–1500 m, 1500–2000 m, and >2000 m.
NDVI is another important conditioning factor that strongly influences the likelihood of land sliding. Bare earth without vegetation coupled with steeper slope and higher rainfall is more susceptible to frequent landslides (Singh and Sharma Citation2015; Sur and Singh Citation2019). The NDVI values (near to −1) specifies that the bare earth surface devoid of vegetation, while value (near to +1) indicates a higher and healthier vegetation cover. The NDVI data was generated from LISS-IV satellite imagery and classified into five classes: −0.24–0.19, 0.19–0.31, 0.31–0.39, 0.39–0.48 and 0.48–0.77.
LULC directly or indirectly reflects the natural process and human-made activities that influence the slope stability in an area. Usually, the land cover like forested areas has fewer landslides than that of barren lands. In this study, The LULC layer was generated from the LISS-IV satellite image applying the pixel-wise classification technique following the classification scheme followed by the National Remote Sensing Centre (NRSC), which was further validated with available SOI toposheets and NRSC maps. There are 14 distinct LULC classes derived from the study area. It has been noted that 67% of the landslides incidents occurred in LULC classes of sparse vegetation, scrubland, and barren rocky areas where weathering of rocks and erosion is more intense.
The effect of seismicity in the Lesser Himalayas is another critical factor for earthquake-induced landslides (Pachauri Citation2010). In this study, the Bureau of Indian Standards (BIS) Earthquake map was referred to produce the seismicity layer in GIS, which was further modified after USGS Vs30 data (the time average shear wave velocity at 30 m depth). The final thematic layer had five classes with the ground acceleration varying between 3.5 and 3.84 m/s2.
Soil characteristics such as clay content in the mountainous terrain become potential slip zone that can lead to slope failure resulted in landslides . The fundamental soil properties such as texture, organic matter content, structure, and permeability greatly influence the soil erodibility. Hence, the soil layer, generated from the National Bureau of Soil Survey (NBSS) soil map, was categorized into four distinct categories based on the depth of soil cover, soil texture, morphology related to slope, and drainage, and used in this study. These are- (i) moderately shallow, excessively drained, thermic, loamy skeletal soils on moderately steep slopes with loamy surface, moderate erosion and moderate stoniness (found mainly in summits and ridge tops); (ii) moderately deep, excessively drained, thermic, loamy skeletal soils on moderately steep slopes with loamy surface and moderate erosion (found in side slopes); (iii) moderately deep, well drained, thermic coarse loamy soils on moderate slopes with loamy surface and moderate erosion (found in fluvial valleys); and (iv) moderately shallow, excessively drained, thermic, coarse loamy soils on steep slopes with loamy surface, moderate erosion, and strong stoniness (found in side slopes).
Topographic wetness index (TWI) is a ‘steady-state wetness index; that describes topography's influence. It identifies the water saturation zones in an area when there is a high catchment area with a low slope gradient. TWI, after Moore et al. (Citation1988), is defined as:
(1)
(1)
where,
= Natural logarithm;
= Flow accumulation/specific catchment area of each cell;
= Slope gradient in degrees.
In this study, TWI was generated from DTM using ArcGIS software and divided into four categories, namely, 0–4, 4–8, 8–12, and 12–14.
The stream power index (SPI) represents the erosive power of the streams. The slope gradient in the catchment area and the streams' erosive power show a positive relationship. According to Moore et al. Citation1988 and Wang et al. Citation2019-
(2)
(2)
where,
= Natural logarithm;
= Flow accumulation/specific catchment area of each cell;
= Slope gradient in degreesgradient in degrees
The SPI values generated were further classified into two distinct classes ranging from 0–10 to 10–15.
3.4. Modeling approach for fuzzy AHP
As discussed in the introduction section of this paper, the fuzzy AHP modeling approach in the present study adopted the Chang’s (Citation1996) extent method using triangular fuzzy numbers (TFN) to calculate the fuzzy weights for the selected landslide conditioning factors. The fuzzy AHP modeling was conducted in open source (LPGL 3) package for ‘R’ programming language using the ‘Fuzzy AHP’ package developed by Jan Kaha (version 0.9.5, 2019) (http://github.com/JanCaha/FuzzyAHP/) after necessary adjustment in the code. This package follows the fuzzy comparison matrix approach described by Siebert et al. (Citation2016). While presents the workflow that was followed by the authors for generating the LSM for the study area. The following section briefly details the fuzzy AHP modeling steps followed.
Figure 5. Fuzzy AHP methodology adopted in this study.
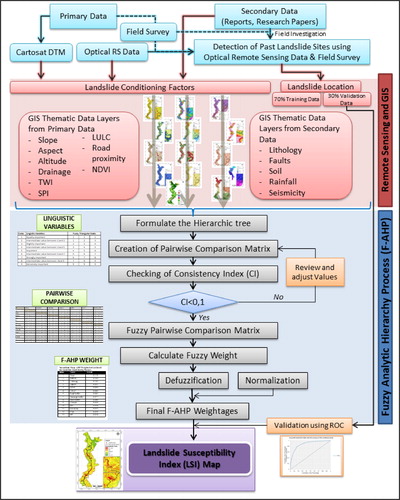
3.4.1. Step-1: Development of hierarchical structure
In this step, the AHP method is adopted based on the literature survey and expert opinion specific to the study area. Next, a judgment matrix is developed using pairwise comparison, and decision-makers/experts are invited with their judgments. The matrices were examined for consistency, and eigenvalues and eigenvectors were calculated to compare the priority of the elements (Li et al. Citation2009). This step is followed by checking of consistency of the matrix judgments in the pairwise evaluation. If the consistency test fails, the pairwise comparison matrix's original values have to be revised ().
Table 2. Development of hierarchical structure.
3.4.2. Step-2: Determination of degree of membership and computation of fuzzy evaluation matrix
The fuzzy logic in decision-making uses the fuzzy set theory to determine the fuzzy membership function (MF) based on the conditioning factors' spatial relationships. In the fuzzy set theory, the objects can be assigned a membership value ranging between 0 and 1 that shows MF's degree. The scores of pairwise comparisons in Step-1 above are transformed into linguistic variables to assess alternatives under the fuzzy environment following Chang’s fuzzy AHP theory. Therefore, all the landslide conditioning factors were converted in the range of 0 (low susceptible) to 1 (high susceptible). In Chang’s fuzzy AHP method, the fuzzy MF and Si (synthetic extent value) were computed for the ith criteria through the following equation:
(3)
(3)
where,
is the goal set for (
=
) and all the
(
) are Triangular Fuzzy Numbers (TFNs).
Here, to obtain i.e., to perform ‘fuzzy addition’ operation of
extent, sub-totals are calculated for each row of the matrix and new set (
) is obtained, where l is the lower limit value, m is the most promising value and u is the upper limit value. The equation can be presented as-
(4)
(4)
Similarly, to get , the inverse of the vector is calculated ().
Table 3. Mean pairwise comparison with respect to GOAL.
3.4.3. Step-3: Evaluation of fuzzy index weights (degree of possibility of value)
In this step, the comparison of fuzzy values (degree of possibility) were computed. The degree of possibility of is determined using the following equations-
The degree of possibility of is defined by-
(5)
(5)
(6)
(6)
Otherwise,
(7)
(7)
where,
and
is the ordinate of the highest intersection point.
For ;
the weight vector is calculated by-
(8)
(8)
where,
are
elements.
3.4.4. Step-4: Generation of normalized fuzzy decision matrix
Finally, through normalization of fuzzy decision matrix using maximum likelihood function, the normalized fuzzy weight vectors are calculated.
(9)
(9)
where
is a non-fuzzy number.
The weights calculated from the model were used for weighted sum overlay analysis in GIS. The final landslide susceptibility score was obtained for the study area by integrating various landslide factor weights through the following-
3.5. Landslide susceptibility mapping
The weights derived from the fuzzy AHP model were used for weighted sum overlay analysis in ArcGIS software (Version 10.8). The final LSI score was obtained for the study area by integrating various landslide factor weights through-
(10)
(10)
where
is the normalized fuzzy AHP weights for conditioning factor
is the weighted value of sub-class
in conditioning factor
and
is the number of parameters.
i.e., LSI for each grid cell = (0.11 * Slope sub-class weights of the cell) + (0.104 * Lithology sub-class weights of the cell) + … … … … … …+ (0.01 * SPI sub-class weights of the cell)
The LSI values were further classified into five distinct LSM categories (very high, high, moderate, low, very low) using Jenk’s Natural Breaks. The results attained from the fuzzy AHP model were validated using the validation dataset using Receiver Operating Characteristics (ROC) curve and relative landslide density index (R-index).
4. Results
As presented in , concerning the goal defined in Chang’s fuzzy AHP, the slope is the top priority among the conditioning factors. The next priorities are rainfall, lithology, NDVI, aspect, road buffer, LULC, drainage buffer, fault buffer, altitude, soil, seismicity, TWI, and SPI obtained weights. More precisely, considering each factor weights derived applying fuzzy AHP for all 14 landslide conditioning factors, slope >50° is the most critical landslide conditioning class. Next in the priority classes are rainfall >1450 mm, NDVI < 0.2, slope 35°–50°, rainfall 1427–1450 mm, road buffer < 100 m, drainage buffer < 100 m, fault buffer < 100 m, NDVI 0.2–0.3, lithology class L1 having greywacke content, slope class 20°–35°, road buffer 100 m–200 m, drainage buffer 100 m–200 m, aspect class S and SW. Conversely, slope < 10°, LULC class of agriculture, soil class 13 (moderately shallow, excessively drained, thermic, loamy skeletal soils on moderately steep slopes), lithology class L-7 (micaceous sandstone, purple clay, mudstone), and aspect class flat are the conditioning factors having the least weightages.
Table 4. Normalized fuzzy AHP weights derived for the conditional factors.
The geospatial technology integrated with the fuzzy AHP based MCDM technique focuses more on the correlation of landslide conditioning factors and the spatial distribution of landslide susceptibility. The resultant LSI data overlay on the village boundary depicts that as high as about 55% (45.23 sq km) of the study area fall within the very high and high landslide susceptibility zones (). About 21% (17.7 km2) was under very high LSI, while 34% (27.5 km2) fell under high LSI categories (). Approximately 17.6% (14.5 km2) areas fall within the moderately susceptible zone. These are the areas where future landslides possibilities are high, which may be amplified without periodic observation and prospective study.
Figure 6. (a) Landslide susceptibility map applying fuzzy AHP model (b) Distribution of LSI zones.
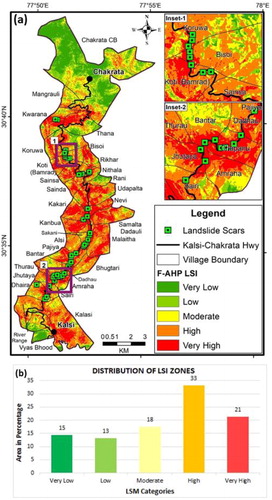
This landslide susceptibility assessment technique provides a strong basis to comprehend the nature of the threat for the decision-makers, architects, and engineers to minimize the damages and losses and help mitigate risks caused by existing and future landslides at the village level. The analysis shows that Nevi village, located near Sahiya town, is most vulnerable to landslides. It has 61.6% of its areas fall within a very high LSI zone. The other villages that also show the higher distribution of very high landslide susceptibility are Chapanu (59.8%), Kakari (52.3%), Kanbua (48.9%), and Pajiya (46.7%). Conversely, the villages having very low LSI (less than 5% of the village area are highly susceptible to potential landslides) are Chakrata CB (1.1%), Bantar (2.3%), Vyas Bhood (3.6%), Rani (4.4%), and Mangrauli (4.8%).
Since the likelihood of landslide is notably higher in both very high and high LSM zones, the overlay analysis was performed to identify the villages that have more areas fall in those categories. The result specifies that Nevi (93.4%), Dadhau (92.7%), Chapanu (91.5%), and Kanbua (91.2%) are the villages that are likely to be more susceptible to future landslides. presents the villages put in order as per the % of geographical areas under very high and combined very high & high LSI classes. The top ten villages having considerably high landslide susceptibility in descending order are- (i) Kakari, (ii) Kanbua, (iii) Pajiya, (iv) Koti (Bamrad), (v) Malaitha, (vi) Udapalta, (vii) Sainsa, (viii) Samalta Dadauli, (ix) Dadhau and (x) Sainda. In continuation of the present investigation, we recommend conducting a detailed landslide risk reduction assessment in these villages for appropriate preparedness and mitigation in future.
Table 5. Distribution of very high and high LSI areas by village.
5. Model validation
The validation of the LSM results from the fuzzy AHP model was performed through the Area Under the Curve (AUC) approach and relative landslide density (R-index) in terms of prediction probability.
5.1. Receiver operating characteristics (ROC)
The ROC curve represents the true positive rates known as sensitivity versus the false-positive rates (also known as specificity) consistent with the cut-off value or the threshold (Mohammady et al. Citation2012). In this study, the training sample or the validation data sets were used to validate the LSM model output. The ROC curve was created by plotting the cumulative distribution of the false alarm probability on the y-axis and the variable's detected probability on the x-axis (Qianqian et al. Citation2017). Next, the LSM was spatially correlated with the landslide validation datasets, and rate curves were produced, and finally, the AUC was estimated ().
Figure 7. Validation of landslide susceptibility index through ROC curve and R-index.
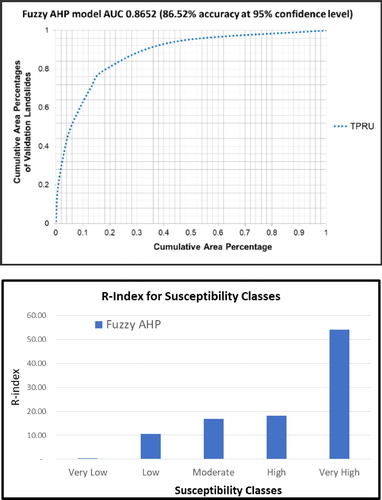
The validation result indicates a higher accuracy of the adopted fuzzy AHP model in classifying existing landslides. The AUC value obtained for the Kalsi-Chakrata road corridor, using 30% of the total observed landslides, was 86.52% at a 95% confidence level. This figure depicts that the current model coupled with the use of high resolution latest vintage data has an excellent prediction capability, and the LSM generated has a close resemblance for future landslide scenarios at specified locations. Hence, the fuzzy AHP model adopted here is statistically significant for landslide susceptibility assessment and is endorsed for landslide susceptibility mapping.
5.2. Relative landslide density (R-index)
In addition to the ROC validation above, the LSM output accuracy was tested using the relative landslide density approach (R-index). R-index assesses the relationship among landslide validation datasets and the LSM result (Meena et al. Citation2019). The R-index can be computed using the following equation-
(11)
(11)
where
is the percentage of landslide susceptible area in each landslide susceptibility class, and
is the percentage of landslide in each landslide susceptibility class. The R-index for each vulnerability class is graphically represented in that illustrates the landslide distribution detected in the classes, indicating the consistency of vulnerability levels.
6. Discussion
The study outcomes reveal that the GIS-based fuzzy AHP technique adopted in the present study is a powerful and essential MCDM tool for landslide susceptibility assessment in the Kalsi-Chakrata road corridor. As presented in the introduction section of this paper, the two-dimensional priority matrix (criterion vs. criterion) following Chang’s AHP method is instrumental and the output LSM has closer resemblance with the prevailing landslide sites observed during the field investigation.
Fuzzy AHP deals substantially well with the qualitative conditioning factors (e.g., slope, aspect, soil, geology, LULC) in LSM studies that are difficult to correlate using crisp values in AHP method. Hence, the decision making procedure becomes more comprehensive and rational as both priorities and data are calculated by fuzzy sets (Chen et al. Citation2011; Mallick et al. Citation2018). Though a few authors pointed out the lack of matrix consistency in fuzzy AHp studies (Duru et al. Citation2012), several authors established that the integrated fuzzy sets with AHP give high adaptability in decision making (Mallick et al. Citation2018; Noorollahi et al. Citation2018). The fuzzy logic adopted with AHP technique is much easier to comprehend and implement; hence, the weighting can be defined by the experts and data for any measurement scale can be contained within the system (Chen et al. Citation2011; Feizizadeh et al. Citation2013; Mijani and Samani Citation2017).
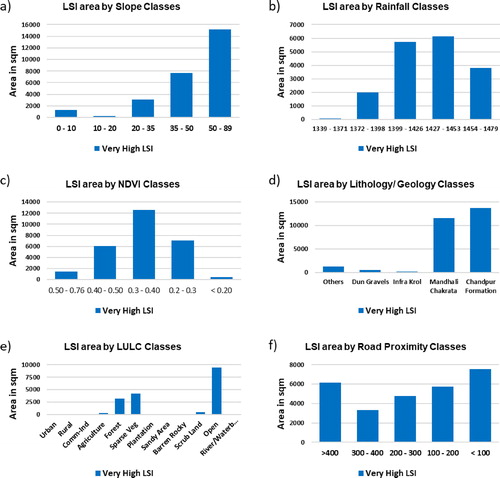
To better understand the fuzzy AHP model results, the LSI estimated through the fuzzy AHP model was correlated with the landslide conditioning factors adopted in the study. The areas under the very high LSI classes were overlaid on the slope, rainfall, lithology, NDVI, road proximity, and LULC thematic layers. presents the % distribution of the LSI area on these conditioning factors. While correlating the slope classes with the very high LSI areas, it was observed that steeper slope reflects higher landslide susceptibility. The areas with a greater slope than 35° have accounted for about 83% of the very high LSI areas. About 88% of the very high LSI areas are covered by average annual rainfall more than 1,400 mm for rainfall categories. Such higher rainfall areas are located in the study area's central and southern parts between Kasli and Sahiya. The NDVI classes that represent sparse vegetation cover shows more landslide susceptibility. The lithology classes of Chandpur formation and Mandhali-Chakrata formation contains about 92% of the very high landslide susceptible class. Therefore, it is evident that the higher presence of greywacke and unconsolidated rocks are more vulnerable to landslides. About 48% of the area under 200 m proximity from roads shows more landslide susceptibility due to mining activity, cutting slope, and heavy vehicles movement in the study area. Among the LULC classes, the open areas account for more than 53% of the total very high LSI followed by sparse vegetation and forest having 24%, and 18% of their areas fall under very high LSI, respectively. Hence, more attention is needed. It has been observed that landslides in the study area are mainly affected by slope, rainfall, lithology, NDVI, aspect, construction of roads by cutting slopes, and land-use practices. This fact is well supported by the field observations by the author that supports the incidence of past landslides along with the correlation of various conditioning factors in those areas. Overall, the areas located in the southern and south-central part of the road corridor are characterized by a lack of vegetation cover (rocky and barren land class in LULC with NDVI value of less than 0.2) coupled with the steeper slope of >50°, rainfall >1420 mm and greywacke type lithology along the Kalsi-Chakrata highway are more prone to potential landslide occurrences.
Figure 8. Correlation of fuzzy AHP model output and the landslide conditioning factors a) Slope classes, b) Rainfall classes, c) NDVI classes d) Lithology/ Geology Classes, e) Land use classes, f) Road proximity classes.
7. Conclusion
In the preceding two decades, landslides have been considered quite disastrous, coupled with extreme climate events in India's Himalayas. Therefore, to systematically assess the landslide hazard in both the short and long term, this study adopted an integrated GIS-based fuzzy AHP – MCDM approach to understanding the processes that contribute to landslides landslide-prone Lesser Himalayas.
The proposed fuzzy AHP based on Chang’s approach ascertains that this method of GIS-based MCDM can be highly effective for landslide susceptibility assessment. The combined use of validated landslide inventory data and high-resolution satellite images to select and map landslide conditioning factors gratifies the geo-spatial aspect of local variations across the Kalsi-Chakrata road corridor. Regarding choosing the probabilistic LSI model for complex geo-environmental setup, the crisp weights and consistency index method of conventional AHP is not appropriate because of the fuzziness. Following Chang's theory, the fuzzy AHP method is a proven method where the membership values or possibilities are compared during the pairwise comparison. Thus, this method provides more comprehensive, flexible, and substantial results when the decision criteria are qualitative, as in the landslide risk assessment.
The study area's resultant landslide susceptibility zones were identified and mapped into five categories: very low susceptibility, low susceptibility, moderate susceptibility, high susceptibility, and very high susceptibility. The susceptibility map's spatial pattern shows that higher landslide susceptibility areas are mainly concentrated along the south-central and central part of the study area along the Kalsi-Chakrata highway. The analysis presents that about 55% (45.23 km2) of the study area was categorized as a very high and high landslide susceptibility zone (). About 21% (17.7 km2) was under very high LSI, while 34% (27.5 km2) fell under high LSI categories. At the village level, the result specifies that Nevi (93.4%), Dadhau (92.7%), Chapanu (91.5%), and Kanbua (91.2%) are the villages that are likely to be more susceptible to future landslides.
The present study contributes significantly to providing a useful prediction for the decision-makers and authorities in adopting appropriate approaches to minimize the potential damages and losses from existing and future landslides in the Kalsi-Chakrata road corridor. It has been observed that landslides along the road corridor are predominantly more affected by slope, rainfall, lithology, NDVI, aspect, construction of roads, and land use practices. Due to the uncertainties inherent in the landslide conditioning factors, certain uncertainties will always persist in landslide susceptibility assessment. The subjectivity of evaluation by experts also may have some limitations. Therefore, the fuzzy AHP approach in the future may consider other significant conditioning factors such as spatiotemporal change of rainfall distribution and frequency under the climate change scenarios. The fuzzy AHP model applied in this study shows 86.52% accuracy in predicting landslides evaluated through the ROC curve (at 95% confidence level). Thus, the current model has an excellent prediction capability, and the LSM generated for this study has a close resemblance for future landslide scenarios at specified locations. Hence, the fuzzy AHP method applied herein may be encouraged for landslide susceptibility assessment in the other Lesser Himalayan road corridors.
Acknowledgements
Authors like to thank the anonimous reviewers for their constructive inputs on the manuscript.
Data availability statement
The data that support the findings of this study are available from the corresponding authors, upon reasonable request.
Disclosure statement
No potential conflict of interest was reported by the author(s).
References
- Allen SK, Rastner P, Arora M, Huggel C, Stoffel M. 2016. Lake outburst and debris flow disaster at Kedarnath, June 2013: hydrometeorological triggering and topographic predisposition. Landslides. 13(6):1479–1491.
- Akgun A. 2012. A comparison of landslide susceptibility maps produced by logistic regression, multi-criteria decision, and likelihood ratio methods: a case study at Izmir, Turkey. Landslides. 9(1):93–106.
- Ambrosi C, Strozzi T, Scapozza C, Wegmuller U. 2018. Landslide hazard assessment in the Himalayas (Nepal and Bhutan) based on earth-observation data. Engg Geol. 237 (2018):217–228.
- Ayhan MB. 2013. A fuzzy AHP approach for supplier selection problem: A case study in a gearmotor company. IJMVSC. 4(3):11–23.
- Basharat M, Shah HR, Hameed N. 2016. Landslide susceptibility mapping using GIS and weighted overlay method: a case study from NW Himalayas, Pakistan. Arab J Geosci. 9(4):292.
- Bera S, Guru B, V R. 2019. Evaluation of landslide susceptibility model: A comparative study on the part of Western Ghat Region, India. Remote Sens Appl: Soc Environ. 13:39–52..
- Bozbura FT, Beskese A, Kahraman C. 2007. Prioritization of human capital measurement indicators using fuzzy AHP. Expert Syst Appl. 32(4):1100–1112.
- Buckley JJ. 1985. Ranking alternatives using fuzzy numbers. Fuzzy Sets Syst. 15(1):21–31.
- Catani F, Lagomarsino D, Segoni S, Tofani V. 2013. Landslide susceptibility estimation by random forests technique: Sensitivity and scaling issues. Nat Hazards Earth Syst Sci. 13(11):2815–2831.
- Chen VYC, Hui-Pang L, Liu C, Liou JJH, Tzeng G, Yang L. 2011. Fuzzy MCDM approach for selecting the best environment-watershed plan. Appl Soft Comput. 11(1):265–275.
- Chen W, Chai H, Sun X, Wang Q, Ding X, Hong H. 2016. A GIS-based comparative study of frequency ratio, statistical index and weights-of-evidence models in landslide susceptibility mapping. Arab J Geosci. 9(3):1–16.
- Chen W, Pourghasemi HR, Panahi M, Kornejady A, Wang J, Xie X, Cao S. 2017. Spatal prediction of landslide susceptibility using an adaptive neuro-fuzzy inference system combined with frequency ratio, generalized additive model, and support vector machine techniques. Geomorphology. 297:69–85.
- Chang DY. 1996. Application of the extent analysis method on fuzzy AHP. Euro J Op Res. 95(3):649–655.
- Choubey VD, Litoria PK. 1990. Terrain classification and land hazard mapping in Kalsi-Chakrata area (Garhwal Himalaya), India. Int J Appl Earth Obs Geoinformation. 1:58–66.
- Das I, Stein A, Kerle N, Dadhwal VK. 2011. Probabilistic landslide hazard assessment using homogeneous susceptible units (HSU) along a national highway corridor in the northern Himalayas, India. Springer. 8(3):293–308.
- Deng X, Li L, Tan Y. 2017. Validation of spatial prediction models for landslide susceptibility mapping by considering structural similarity. IJGI. 6(4):103.
- Duru O, Bulut E, Yoshida S. 2012. Regime switching fuzzy AHP model for choice-varying priorities problem and expert consistency prioritization: A cubic fuzzy-priority matrix design. Expert Syst Appl. 39(5):4954–4964.
- Feizizadeh B, Blaschke T, Nazmfar H, Rezaei Moghaddam MH. 2013. Landslide susceptibility mapping for the Urmia Lake basin, Iran: A multi-criteria evaluation approach using GIS. Int J Environ Res. 7(2):319–336.
- Gabet EJ, Burbank DW, Putkonen J, Pratt-Sitaula B, Ojha T. 2004. Rainfall thresholds for landsliding in the Himalaya of Nepal. Geomorphology. 63(3–4):131–143.
- Glade T. 2001. Landslide hazard assessment and historical landslide data—An inseparable couple? In: The use of historical data in natural hazard assessments. Dordrecht: Springer.
- Gorsevski PV, and, Jankowski P. 2010. An optimized solution of multi-criteria evaluation analysis of landslide susceptibility using fuzzy sets and Kalman filter. Comput Geosci. 36(8):1005–1020.
- Guzzetti F, Carrara A, Cardinali M, Reichenbach P. 1999. Landslide hazard evaluation: a review of current techniques and their application in a multi-study, Central Italy. Geophys J R Astr Soc. 31(1–4):181–216.
- Guzzetti F, Mondini AC, Cardinali M, Fiorucci F, Santangelo M, Chang K-T. 2012. Landslideinventory maps: New tools for an old problem. Earth-Sci Rev. 112(1–2):42–66.
- Hanine M, Boutkhoum O, Tikniouine A, Agouti T. 2016. Comparison of fuzzy AHP and fuzzy TODIM methods for landfill location selection. SpringerPlus. 5:501.
- Khanduri S. 2017. Landslide hazard around Mussoorie: The Lesser Himalayan tourist destination of Uttarakhand, India. J Geogr Nat Disast. 07(02):1–10. 1000200
- Kwan JSH, Chan SL, Cheuk JCY, Koo RCH. 2014. A case study on an open hillside landslide impacting on a flexible rock fall barrier at Jordan Valley, Hong Kong. Landslides. 11(6):1037–1050.
- Laarhoven PV, Pedrycz W. 1983. A fuzzy extension of Saaty’s priority theory. Fuzzy Sets Syst. 11(1–3):229–227.
- Lee S, Pradhan B. 2007. Landslide hazard mapping at Selangor, Malaysia using frequency ratio and logistic regression models. Landslides. 4(1):33–41.
- Li L, Shi Z, Yin W, Zhu D, Ng SL, Cai C, Lei A. 2009. A fuzzy analytic hierarchy process (FAHP)approach to eco-environmental vulnerability assessment for the Danjiangkou Reservoir area, China. Ecol Modeling. 220(23):3439–3447.
- Li Y, Zhou R, Zhao G, Li H, Su D, Ding H, Yan Z, Yan L, Yun K, Ma C. 2014. Tectonic uplift and landslides triggered by the Wenchuan earthquake and constraints on orogenic growth: a case study from Hongchun Gully, Longmen Mountains, Sichuan, China. Quat Int. 349:142–152.
- Mallick J. 2016. Geospatial-based soil variability and hydrological zones of Abha semi-arid mountainous watershed, Saudi Arabia. Arab J Geosci. 9(4):281..
- Mallick J, Singh RK, AlAwadh MA, Islam S, Khan RA, Qureshi MN. 2018. GIS-based landslide susceptibility evaluation using fuzzy-AHP mlti-criteria decision-making techniques in the Abha Watershed, Saudi Arabia. Env Earth Sci. 77:276.
- Marinos V, Stoumpos G, Papazachos C. 2019. Landslide hazard and risk assessment for a natural gas pipeline project: The case of the Trans Adriatic Pipeline, Albania Section. Geosciences. 9(2):61.
- Meena SR, Ghorbanzadeh O, Blaschke T. 2019. A comparative study of statistics-based landslide susceptibility models: A case study of the region affected by the Gorkha Earthquake in Nepal. IJGI. 8(2):94..
- Mijani N, Samani NN. 2017. Comparison of fuzzy-based models in landslide hazard mapping. Int Arch Photogramm Remote Sens Spatial Inf Sci. 42:407–416.
- Mohammady M, Pourghasemi HR, Pradhan B. 2012. Landslide susceptibility mapping at Golestan Province, Iran: a comparison between frequency ratio, Dempster–Shafer, and weights-of evidence models. J Asian Earth Sci. 61:221–236.
- Moore ID, O'Loughlin EM, Burch GJ. 1988. A contour-based topographic model for hydrological and ecological applications. Earth Surf Process Landf. 13(4):305–320.
- Nachappa TG, Kienberger S, Meena SR, Hölbling D, Blaschke T. 2020. Comparison and validation of per-pixel and object-based approaches for landslide susceptibility mapping. Geomatics Nat Hazards Risk. 11 (1):572–600.
- Noorollahi Y, Sadeghi S, Yousefi H, Nohegar A. 2018. Landslide modeling and susceptibility mapping using AHP and fuzzy approaches. Int J Hydro. 2(2):137–148.
- Ouma Y, and, Tateishi R. 2014. Urban flood vulnerability and risk mapping using integrated multi-parametric AHP and GIS: methodologi-cal overview and case study assessment. Water. 6(6):1515–1545.
- Pachauri AK. 2010. Landslide hazard mapping and assessment in Himalayas. Fifth Int Conf on Recent Advances in Geotechnical Earthquake Engineering and Soil Dynamics; May 24–29; San Diego, California, USA. http:scholarsmine.mst.edu/icrageesd/05Sicrageesd/session04b/22.
- Pradhan B, Lee S. 2010. Landslide susceptibility assessment and factor effect analysis: back propagation artificial neural networks and their comparison with frequency ratio and bivariate logistic regression modeling. Env Model Software. 25(6):747–759.
- Pellicani R, Van Westen CJ, Spilotro G. 2014. Assessing landslide exposure in areas with limited landslide information. Landslides. 11(3):463–480.
- Qianqian B, Yumin C, Susa D, Qianjiao W, Jiaxin Y, Jingyi Z. 2017. An improved information value model based on gray clustering for landslide susceptibility mapping. IJGI. 6(1):18. doi;10.3390
- Rai PK, Mohan K, Kumra VK. 2014. Landslide hazard and its mapping using remote sensing & GIS techniques. J Sci Res. 58:1–13.
- Raja NB, Çiçek I, Türkoğlu N, Aydin O, Kawasaki A. 2018. Correction to: landslide susceptibility mapping of the sera river Basin using logistic regression model. Nat Hazards. 91(3):1423–1423.
- Saaty TL. 1990. How to make a decision: the analytic hierarchy process. Eur J Oper Res. 48(1):9–26.
- Shahabi H, Khezri H, Ahmad BB, Allahvirdiasl H. 2012. Application of Satellite images and fuzzy set theory in landslide hazard mapping in Central Zab basin. IOSRJAP. 1(4):17–24.
- Sharma A, Sur U, Singh P, Rai PK, Srivastava PK. 2020. Probabilistic landslide hazard assessment using Statistical Information Value (SIV) and GIS techniques: A case study of Himachal Pradesh, India. In: Wiley on technique for disaster risk management and mitigation. Hoboken (NJ): Wiley; p. 173–208.
- Siebert J, Pavlacka O, Talasová J. 2016. A fuzzy extension of analytic hierarchy process based on the constrained fuzzy arithmetic. Fuzzy Optim Decis Making. 16(1):89–110.
- Singh P, Sharma A, Sur U, Rai PK. 2020. Comparative landslide susceptibility assessment using statistical information value and index of entropy model in Bhanupali-Beri region, Himachal Pradesh, India. Environ Dev Sustainability. https://doi.org/10.1007/s10668-020-00811-0
- Singh P, Sharma A. 2015. Probabilistic landslide susceptibility mapping using binary logistic regression model and geospatial techniques: A case study of Uttarakhand. 16th ESRI User Conf; December 2015; New Delhi, India.
- Sur U, Singh P. 2019. Landslide susceptibility indexing using geospatial and geostatistical techniques along Chakrata-Kalsi road corridor, India. Indian Cartographer. J Indian National Cartographic Assoc (INCA). 38:2018.
- Taalab K, Cheng T, Zhang Y. 2018. Mapping landslide susceptibility and types using random forest. Big Earth Data. 2(2):159–178. doi:10.1080/20964471.2018.1472392
- Tien Bui D, Pradhan B, Lofman O, Dick O. 2012. Landslide susceptibility assessment in the Hoa Binh Province of Vietnam: a comparison of the Levenberg-Marquardt and Bayesian regularized neural networks. Geophys J R Astr Soc. 171–172:12–29.
- Tien Bui D, Pradhan B, Revhaug I, Nguyen DB, Pham HV, Bui QN. 2015. A novel hybrid evidential belief function-based fuzzy logic model in spatial prediction of rainfall-induced shallow landslides in the Lang Son city area (Vietnam). Geomatics Nat Haz Risk. 6(3):243–271.
- Thai Pham B, Tien Bui D, Prakash I, Dholakia MB. 2017. Hybrid integration of multilayer perceptron neural networks and machine learning ensembles for landslide susceptibility assessment at Himalayan area (India) using GIS. Catena. 149:52–63.
- Thai Pham B, Prakash I, Khosravi K, Chapi K, Trinh PT, Ngo TQ, Hosseini SV, Bui DT. 2019. A comparison of support vector machines and Bayesian algorithms for landslide susceptibility modelling. Geocarto Int. 34(13):1385–1407.
- Thai Pham B, Tien Bui D, Prakash I. 2018. Landslide susceptibility modelling using different advanced decision trees methods. Civil Eng Environ Syst. 35(1–4):139–157.
- Tsangaratos P, Ilia I. 2016. Comparison of a logistic regression and Naïve Bayes classifier inlandslide susceptibility assessments: The influence of models complexity and training datasetsize. Catena. 145:164–179.
- Varnes DJ. 1984. Landslide hazard zonation: a review of principles and practice. Paris, France: UNESCO Press; p. 61.
- Wang Q, Guo Y, Li W, He J, Wu Z. 2019. Predictive modeling of landslide hazards in Wen County, northwestern China based on information value, weights-of-evidence, and certainty factor. Geomatics Nat Haz Risk. 10(1):820–835.
- Wang Y, Fang Z, Wang M, Ling P, Hong H. 2020. Comparative study of landslide susceptibility mapping with different recurrent neural networks. Comput Geosci. 138:104445.
- Wu Y, Li W, Wang Q, Liu Q, Yang D, Xing M, Pei Y, Yan S. 2016. Landslide susceptibility assessment using frequency ratio, statistical index and certainty factor models for the Gangu County, China. Arab J Geosci. 9(2):84.
- Xu C, Xu X, Shen L, Yao Q, Tan X, Kang W, Ma S, Wu X, Cai J, Gao M, et al. 2016. Optimized volume models of earthquake-triggered landslides. Sci Rep. 6:1–9.
- Zadeh LA. 1965. ‘Fuzzy sets’, information and control. 8: 338-53.
- Zimmermann H-J. 1992. Fuzzy set theory. Vol. 2. Hoboken (NJ): Wiley.
- Zhang J, He P, Xiao J, Xu F. 2018. Risk assessment model of expansive soil slope based on Fuzzy-AHP method and its engineering application. Geomatics Nat Haz Risks. 9(1):389–402.