
 ?Mathematical formulae have been encoded as MathML and are displayed in this HTML version using MathJax in order to improve their display. Uncheck the box to turn MathJax off. This feature requires Javascript. Click on a formula to zoom.
Abstract
Many empirical typhoon economic loss models consider that the losses caused by typhoons mainly depend on the intensity of the hazards and the exposure in the affected areas. Few studies have attracted attention to the role of disaster-formative environmental factors in typhoon losses. In this study, we chose land use and land cover (LULC) as disaster-formative environmental factors together with typhoon wind speed, rainfall, and gross domestic product (GDP) as predictive factors for typhoon economic losses in Guangdong Province, China. The results showed that the intensity of wind speed was the most important factor, while LULC played weak roles in typhoon economic losses for 23 typical typhoons in terms of county level losses in Guangdong. Subregionally, typhoon economic loss models performed better in coastal areas than in noncoastal areas.
1. Introduction
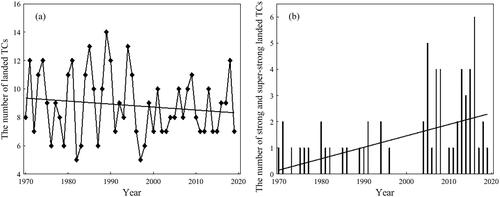
In the context of global warming, extreme weather events have occurred more frequently (Diffenbaugh et al. Citation2017). A tropical cyclone (abbreviated as TC), which is called a ‘typhoon’ in the West Pacific and a ‘hurricane’ in the Northeast Pacific and Atlantic, is one of the most frequent meteorological events threatening large losses of lives and property for people around the world. Because of climate change, the global TC intensity, impact time and TC rainfall all show an upward trend (Webster et al. Citation2005; Tsuboki et al. Citation2015; Mei and Xie Citation2016; Liu et al. Citation2019). In a warming world, TCs last longer on land, and their destructive power extends progressively farther inland (Chavas and Chen Citation2020; Li and Chakraborty Citation2020). In recent decades, the threats posed by TCs to the Western North Pacific (WNP) have increased (Park et al. Citation2014). The number of strong and super-strong landed TCs also shows an upward trend in China (). From 2005 to 2016, the annual mean loss of TC disasters in mainland China was approximately 10 billion U.S. dollars (Wang et al. Citation2019).
Figure 1. (a) The number of landed TCs in China by year, from 1970–2019; and (b) the number of strong and super-strong landed TCs from 1970–2019 in China.
The loss caused by TCs mainly depends on the intensity of TCs and exposure, such as population, property and infrastructure, in the affected areas (Schmidt et al. Citation2009; Klotzbach et al. Citation2018; Ye et al. Citation2020). Many studies have explored the influencing factors of TC loss (). The existing models shown in illustrate that there are strong relationships between direct economic loss and wind speed. Storm size, rainfall, exposed population and GDP are also key factors in typhoon-caused economic losses.
Table 1. Selected typical TC loss models.
Currently, most studies directly use the wind speed at landfall when modeling losses, which may lead to large deviations in the loss-wind speed relationship, especially for inland areas. The TC wind speed and loss relationships for most studies were based on yearly loss data, and few were based on TC event- and county level data. On the other hand, few studies have paid attention to the role of disaster-formative environmental factors in typhoon economic losses. According to the disaster system, disaster loss is the combination of a disaster-formative environment, hazards and exposure (Shi Citation1991). Under the same hazard and exposure conditions, there may be large differences in the influences of disasters due to the hazard-formative environment. Land use and land cover (LULC) are typical disaster-formative environmental factors in typhoon disaster systems, but they have rarely been considered. What role does LULC play in typhoon economic losses? In contrast to the extensive studies of the effects of hazards and exposure on typhoon losses, this question has attracted scant attention. Therefore, this study tries to discuss the TC hazard, exposure and loss relationships by considering the effects of LULC with examples from 23 typical typhoons with 693 county level cases from 2013 to 2018 in Guangdong Province, China.
The rest of this article is organized as follows. Section 2 introduces the data sources and the methods of wind field simulation and typhoon economic loss estimation. Section 3 introduces the parameter settings in the wind field simulation models and illustrates how well the typhoon economic loss models work. Finally, section 4 provides a conclusion of this study.
2. Data and methods
2.1. Data sources
Five datasets were used in this study (). First, the best track dataset for TCs over the WNP from 2013 to 2018 was downloaded from the China Meteorological Administration (CMA, Ying et al. Citation2014). Each best track record includes the TC intensity category, the location of the TC center, the minimum pressure, and the 2-min mean maximum sustained wind near the TC center every 6 hours. Second, LULC data for Guangdong Province, China, with 1 km × 1 km grids in 2010, 2015, and 2018, were downloaded from the Resource and Environment Data Cloud Platform of China, which includes 6 primary types of LULC, including cropland, forest, grassland, water, urban and built-up land and unused land, and 25 secondary types. Third, GDP data at the county level of Guangdong from 2015 to 2019 were obtained from the Guangdong Statistical Yearbooks Database. Fourth, the precipitation datasets of the Tropical Rainfall Measurement Mission (TRMM) Multisatellite Precipitation Analysis (TMPA) were downloaded from the NASA Goddard Earth Sciences Data and Information Services Center (GES DISC; Huffman et al. Citation2010). In this study, we selected the TRMM 3B42 Daily datasets as the daily accumulated precipitation from 2013 to 2018 at a 0.25° resolution from 50°N to 50°S. Fifth, typhoon loss data at the county level of Guangdong from 2013 to 2018 were obtained from Guangdong Climate Center. In this study, we selected 23 typical typhoons from 2013 to 2018 () as research cases.
Table 2. Data and sources.
2.2. Wind field model
The time interval of a TC track from the CMA described above is 6 hours, which is too coarse to model the wind field. That is, the buffers of recorded points established based on the wind field model are not continuous and cannot completely cover the TC-affected extent. Therefore, this study interpolated 35 points equidistantly between every two consecutive TC points by a linear spline referenced from Li et al. (Citation2014), and the temporal resolution was increased to 10 minutes.
In this study, the Georgiou wind field model (Georgiou Citation1985) is used to calculate the gradient balance velocity for a stationary storm as follows:
(1)
(1)
where
is the density of air and
is the Coriolis parameter.
is the translational speed of the typhoon.
is the heading angle, which is the angle between the straight line from the target point to the center of the typhoon and the direction of the typhoon (the clockwise direction is positive).
is the central pressure of the typhoon,
is the pressure at the periphery of the typhoon that is not affected by the typhoon, and the default value in the Northwest Pacific is 1010 hPa. The radius to maximum winds
is the radius from the hurricane eye to the maximum wind location.
is the air pressure profile parameter, also called the Holland
parameter, and
is the distance from the target point to the center of the typhoon.
To assess typhoon wind hazards, the gradient wind speed must be converted into the near-surface wind speed by the gradient-to-surface conversion factors. In this study, the 10-m surface wind speed is used as the near-surface wind by referring to Tan and Fang (Citation2018). The gradient-to-surface conversion factor is usually set as a constant value (Georgiou Citation1985) or obtained by the planetary boundary layer model (Meng et al. Citation1997). In this study, the former is set to a constant value of 0.75 by following Georgiou (Citation1985), and the 10-m surface wind speed is as follows:
(2)
(2)
2.3. Typhoon economic loss model
From the perspective of the regional disaster system, the disaster loss () is the product of the interaction between the disaster-formative environment, hazards, and exposure. In the case of typhoon disasters in this study, we take the wind speed (
) and rainfall (
) as the hazards and GDP (
) as the exposure. In the 6 primary types of LULC data, cropland, forest, and grassland belong to agricultural land. There is a linear correlation between the agricultural land rate and the urban and built-up land rate at the county level in Guangdong Province. Therefore, we select the urban and built-up land rate (
) as the disaster-formative environment. The matrix plots of the above variables are shown in . By referring to , the loss estimation models are set as Formula 3a (Murnane and Elsner Citation2012), Formula 4a (Geiger et al. Citation2016) and Formula 5a (Wen et al. Citation2019). The corresponding models considering LULC are established as Formula 3 b, Formula 4 b and Formula 5 b.
(3a)
(3a)
(3b)
(3b)
(4a)
(4a)
(4b)
(4b)
(5a)
(5a)
(5b)
(5b)
where
and
represent county level losses and exposed GDP, respectively.
is the wind speed,
is the rainfall, and
is the ratio of urban and built-up land. Parameters
and
are the coefficients. The 10-m surface wind speed is simulated by the wind field model in section 2.2, and we calculated the maximum wind speed at each grid (∼0.01 degrees).
3. Results and discussion
3.1. Parameter settings
Parameters
and
in Formula 1 can be obtained using the TC track dataset. Air density
is set to 1.15 kg/m3, and
is set to 1010 hPa (Lin Citation2014). Parameter
is calculated based on the latitude and longitude of the target point and the center of the typhoon, where the latitude and longitude of the typhoon center can be obtained using the TC track dataset. The Coriolis parameter
is set to
where
is the angular rotation rate of the earth (7.272 × 10⁻⁵ rad/s) and
is the latitude at the target point. The radius to maximum winds
is set to
which was empirically presented by Lin and Fang (Citation2013). The Holland
parameter is set to
where
represents the latitude of the typhoon center (Vickery and Wadhera Citation2008).
3.2. Analysis of the results
To explore the role of LULC in those typhoon loss models, the average value of maximum wind speed in each county and the maximum daily rainfall during a typhoon are selected as and
for fitting, respectively. The regression results of those models are shown in (The details of p-value for each parameter can be found in Table S2). shows the scatter plots of six models between reported economic losses and estimated economic losses, where both quantities are expressed in logarithms of base 10.
Figure 2. Correlation between reported and modeled losses, where x- and y-axes are log scales. The solid line marks the bisectrix (1:1 line), and the dashed lines deviate by a factor of ten. (a) Model I; (b) Model I’; (c) Model II; (d) Model II’; (e) Model III; and (f) Model III’, where the point color represents the point density.
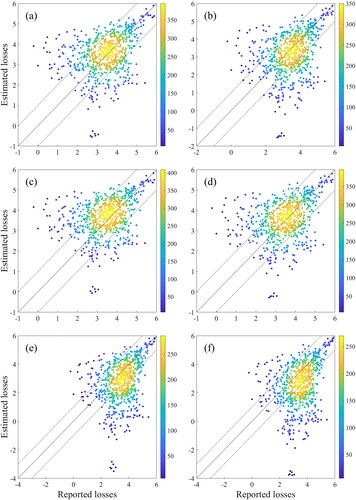
Table 3. Regression results of each model.
In , we can see that the determination coefficient (R2) values of the models considering LULC (Models I’, II’ and III’) are slightly different from those of Models I, II and III, respectively. It should be noted that the models involved in this paper must be solved with multiple nonlinear regression. Thus, to evaluate the models, we need to not only reference the R2 value but also refer to the root mean square error (RMSE) and the number of points where the deviation is less than ten times (NPLT) (Geiger et al. Citation2016). The RMSEs of Models I’, II’ and III’ are also slightly different from those of Models I, II and III, respectively. It is obvious that those scenarios considering LULC are not significantly superior to the models without considering LULC, which implies that LULC relate to typhoon economic loss but play a weak role at the county level in Guangdong Province. The NPLTs of Models I, II and III are greater than those of Models I’, II’ and III’, respectively. The larger the NPLT of the model is, the more points are clustered near the 1:1 line in , which indicates that the model is better. From this perspective, those scenarios considering LULC are inferior to those without considering LULC, which also implies that LULC play weak roles in county level typhoon economic loss. According to the R2 values, Models I, I’, II and II’ appear similar, while Models III and III’ seem better. Models III and III’ are slightly better than others by referring to RMSEs. However, Models I, I’, II and II’ are significantly better than Models III and III’ by referring to NPLTs.
In Models I and I’, the parameter usually ranges between 3 and 9, and this relationship can also better fit the aggregate normalized economic losses and maximum wind speed at landfall in the United States (Murnane and Elsner Citation2012). Herein, the parameter
in the two scenarios ranges between 6 and 7.5, which means that Models I and I’ are also proper at the county level. Compared with Models I and I’, Models II and II’ take into account the combined impact of hazards and exposure on economic loss. In Model II, the parameter
is positive while negative in Model II’. According to the regional disaster system, the more exposed GDP is, the higher the economic loss is under the same hazard intensity, which also coincides with the study results of Geiger et al. (Citation2016). Parameters
and
mean that there is a positive correlation between economic losses and GDP and wind speed; that is, economic losses are closely related to exposure and hazards. Higher exposure and strong hazard intensity can lead to greater losses. The negative value of parameter
implies that the disaster-formative environment factor is not suitable in Model II’. In Models III and III’, the multiple hazards of wind speed and rainfall are considered. However, we find that both values of parameter
in Models III and III’ are negative, which contradicts common sense. This indicates that Models III and III’ may not be suitable for simulating typhoon losses at the county level in this study. One of the possible reasons is that the relationship between wind speed and rainfall is not considered in this model.
According to to , we find that the center of gravity of the points (approximately in the yellow area) is distributed around the 1:1 line. In and , there are a few points far away from the 1:1 line; dots at the top left indicate counties that suffer from high wind speeds but have low economic losses, and dots at the bottom right indicate counties that suffer from low wind speeds but have high economic losses. Because the negative parameter of rainfall contradicts common sense, we believe wind speed and rainfall are not satisfied with Models III and III’ here. In and , we find that the center of gravity of the points is off the 1:1 line, and the points are more discrete than those of . However, it is difficult to judge which is better between and . The disaster-formative environment factor does not eliminate this difference according to , , and . From this perspective, LULC play weak roles in the typhoon economic losses at the county level in the cases of this study.
However, a typhoon may cause various secondary hazards in different disaster-formative environments. For instance, a typhoon often causes storm surges in coastal areas and floods in plain areas. shows the scatter plots of and in different environments, where red dots represent cases in coastal areas and blue dots are cases in noncoastal areas. Most coastal dots are distributed around the 1:1 line, which shows that Model I and Model II are suitable for coastal cases. To further investigate this, we fit the data for coastal and noncoastal areas. The regression results of Models I, I’, II, II’, III, and III’ for coastal and noncoastal areas are shown in (The details of p-value for each parameter can be found in ). According to , we can see that the regression results of Models I’, II’, and III’ are slightly different from those of Models I, II, and III, respectively. This also implies that LULC play weak roles in county level typhoon economic losses in coastal and noncoastal areas. We also find that the fitting results of the 6 models in coastal areas are quite different from those in noncoastal areas. However, it should be noted that both values of parameter in Models III and III’ in coastal areas are negative, while those in noncoastal areas are positive; in addition, all of the values of parameter
in Models I’, II’, and III’ in coastal areas are positive, while those in noncoastal areas are negative, which means that building different models for coastal areas and noncoastal areas might be necessary.
Table 4. Regression results of each model for coastal and noncoastal areas.
Overall, the most important factors in the typhoon economic loss model are hazards, followed by exposure according to R2, RMSE and NPLT of Models I and II in and . It should be noted that a multi-hazard model has to be developed when considering the joint effects of wind and rainfall on economic losses. Thus, the hazard-loss relationship might be very different between Model III and Model III’. On the other hand, disaster losses also depend on the vulnerability of exposures and regional coping capacity. For example, regional adaptive measures, such as strengthening the wind resistance of buildings, can reduce the vulnerability of buildings to typhoons. However, many hard-adaptive measures can even cause greater losses if the hazard intensity exceeds the regional fortification level (Logan et al. Citation2018).
4. Conclusions
Most previous studies have focused on how typhoon economic losses increase with elements of hazards and exposure while ignoring disaster-formative environmental factors. In this study, we used three models to explore the role of the disaster-formative environmental factor of LULC in typhoon economic losses. We find that LULC play weak roles in typhoon economic loss at the county level in 23 typical typhoons with 693 cases from 2013 to 2018 in Guangdong Province, China. The typhoon economic loss models in coastal areas are better than those in noncoastal areas. We also find that although the models by Murnane and Elsner (Citation2012) and Geiger et al. (Citation2016) proved to be good choices at the national scale, there are still many outliers in modeling the losses at the county level in this study. Further investigation is needed to discuss whether these outliers are related to regional adaptive measures or coping capacity. Another concern is that when considering multiple hazards, the results of Model III and Model III’ do not match the actual situation. How to construct a joint hazard scenario to combine wind speed and rainfall in a typhoon loss model is a problem to be solved in future study.
Supplemental Material
Download MS Word (5 MB)Acknowledgements
We thanked the Guangdong Climate Center (http://gd.cma.gov.cn/) for providing the typhoon losses data at the county level of Guangdong. TC track dataset were downloaded from the CMA at http://tcdata.typhoon.org.cn/en/index.html. LULC data were downloaded from the Resource and Environment Data Cloud Platform of China at http://www.resdc.cn/Datalist1.aspx?FieldTyepID=1,3. GDP data were downloaded from Guangdong Statistics Bureau at http://stats.gd.gov.cn/gdtjnj/. TRMM 3B42 Daily dataset were downloaded from GES DISC at https://disc.gsfc.nasa.gov/datasets/TRMM_3B42_Daily_7/summary.
Disclosure statement
No potential conflict of interest was reported by the authors.
Additional information
Funding
Related Research Data
References
- Chavas D, Chen J. 2020. Tropical cyclones could last longer after landfall in a warming world. Nature. 587(7833):200–201.
- Diffenbaugh NS, Singh D, Mankin JS, Horton DE, Swain DL, Touma D, Charland A, Liu Y, Haugen M, Tsiang M, et al. 2017. Quantifying the influence of global warming on unprecedented extreme climate events. Proc Natl Acad Sci USA. 114(19):4881–4886.
- Geiger T, Frieler K, Levermann A. 2016. High-income does not protect against hurricane losses. Environ Res Lett. 11(8):084012.
- Georgiou PN. 1985. Design wind speeds in tropical cyclone-prone regions [dissertation]. London: Department of Civil Engineering, University of Western Ontario, Canada.
- Huffman GJ, Adler RF, Bolvin DT, Nelkin EJ. 2010. The TRMM multi-satellite precipitation analysis (TMPA). In: Gebremichael M, Hossain F, editors. Satellite rainfall applications for surface hydrology. Dordrecht: Springer; p. 3–22.
- Klotzbach PJ, Bowen SG, Pielke R, Jr., Bell M. 2018. Continental US hurricane landfall frequency and associated damage: Observations and future risks. Bull Am Meteorol Soc. 99(7):1359–1376.
- Li L, Chakraborty P. 2020. Slower decay of landfalling hurricanes in a warming world. Nature. 587(7833):230–234.
- Li XY, Fang WH, Lin W. 2014. Comparison of interpolation methods for tropical cyclone tracks and their intensity over the northwestern pacific basin. J Beijing Normal Univ (Nat Sci). 50(2):111–116. (in Chinese)
- Lin W, Fang WH. 2013. Regional characteristics of Holland B parameter in typhoon wind field model for Northwest Pacific. Tropic Geography. 33(2):124–132. (in Chinese)
- Lin W. 2014. Typhoon wind hazard analysis of Hainan Island [MS dissertation]. Beijing: Academy of Disaster Reduction and Emergency Management, Beijing Normal University, China. (in Chinese)
- Liu M, Vecchi GA, Smith JA, Knutson TR. 2019. Causes of large projected increases in hurricane precipitation rates with global warming. Npj Clim Atmos Sci. 2(1):1–5.
- Logan TM, Guikema SD, Bricker JD. 2018. Hard-adaptive measures can increase vulnerability to storm surge and tsunami hazards over time. Nat Sustain. 1(9):526–530.
- Mei W, Xie SP. 2016. Intensification of landfalling typhoons over the northwest Pacific since the late 1970s. Nature Geosci. 9(10):753–757.
- Meng Y, Matsui M, Hibi K. 1997. A numerical study of the wind field in a typhoon boundary layer. J Wind Eng Ind Aerodyn. 67:437–448.
- Murnane RJ, Elsner JB. 2012. Maximum wind speeds and US hurricane losses. Geophys Res Lett. 39(16):L16707.
- Park DSR, Ho CH, Kim JH. 2014. Growing threat of intense tropical cyclones to East Asia over the period 1977–2010. Environ Res Lett. 9(1):014008.
- Schmidt S, Kemfert C, Höppe P. 2009. Tropical cyclone losses in the USA and the impact of climate change - a trend analysis based on data from a new approach to adjusting storm losses. Environ Impact Assess Rev. 29(6):359–369.
- Shi P. 1991. Theory and practice of disaster research. J Nanjing Univ (Nat Sci). 11:37–42. (in Chinese)
- Tan C, Fang W. 2018. Mapping the wind hazard of global tropical cyclones with parametric wind field models by considering the effects of local factors. Int J Disaster Risk Sci. 9(1):86–99.
- Tsuboki K, Yoshioka MK, Shinoda T, Kato M, Kanada S, Kitoh A. 2015. Future increase of supertyphoon intensity associated with climate change. Geophys Res Lett. 42(2):646–652.
- Vickery PJ, Wadhera D. 2008. Statistical models of Holland pressure profile parameter and radius to maximum winds of hurricanes from flight-level pressure and H* Wind data. J Appl Meteorol Climatol. 47(10):2497–2517.
- Wang H, Xu M, Onyejuruwa A, Wang Y, Wen S, Gao AE, Li Y. 2019. Tropical cyclone damages in Mainland China over 2005–2016: losses analysis and implications. Environ Dev Sustain. 21(6):3077–3092.
- Webster PJ, Holland GJ, Curry JA, Chang HR. 2005. Changes in tropical cyclone number, duration, and intensity in a warming environment. Science. 309(5742):1844–1846.
- Wen S, Su B, Wang Y, Fischer T, Li X, Yin Y, Chao G, Wang R, Jiang T. 2018. Economic sector loss from influential tropical cyclones and relationship to associated rainfall and wind speed in China. Global Planet Change. 169:224–233.
- Wen S, Wang Y, Su B, Gao C, Chen X, Jiang T, Tao H, Fischer T, Wang G, Zhai J. 2019. Estimation of economic losses from tropical cyclones in China at 1.5° C and 2.0° C warming using the regional climate model COSMO‐CLM. Int J Climatol. 39(2):724–737.
- Ye M, Wu J, Liu W, He X, Wang C. 2020. Dependence of tropical cyclone damage on maximum wind speed and socioeconomic factors. Environ Res Lett. 15(9):094061.
- Ying M, Zhang W, Yu H, Lu X, Feng J, Fan Y, Zhu Y, Chen D. 2014. An overview of the China Meteorological Administration tropical cyclone database. Journal of Atmospheric and Oceanic Technology. 31(2):287–301.
- Zhai AR, Jiang JH. 2014. Dependence of US hurricane economic loss on maximum wind speed and storm size. Environ Res Lett. 9(6):064019.